3339
Altered intrinsic brain functional network dynamics in drug-naïve, first-episode adolescents with major depressive disorder1Huaxi MR Research Center (HMRRC), Department of Radiology, West China Hospital of Sichuan University, Chengdu, China, 2Department of Nuclear Medicine, West China Hospital of Sichuan University, Chengdu, China
Synopsis
Keywords: Psychiatric Disorders, fMRI (resting state)
This study aimed to explore the dynamic FC in adolescent MDD patients, with a focus on the temporal properties of functional connectivity states as well as the variability of network topological organization. We found that adolescent MDD patients spent more time in the weakly-connected and relatively highly-modularized State 1, spent less time in the strongly-connected and low-modularized State 2, and had higher variability in the network efficiency than healthy controls. These findings suggest impaired local segregation and global integration of functional networks, as well as segregation-integration imbalance in adolescent MDD patients.Introduction
Major depressive disorder (MDD) is a common mental disease that severely limits psychosocial functioning and diminishes quality of life 1, and tends to emerge during adolescence 2. Emerging evidence suggests that dynamic functional connectivity (FC) analysis can capture additional important neural activity fluctuations that underlie cognition and behavior. Although aberrant static FC has been well demonstrated in adolescent MDD, studies focusing on dynamic FC in these patients are very limited. Thus, the present study aimed to explore the dynamic aspects of FC in adolescent MDD patients.Methods
Adolescents with MDD and healthy controls (HCs) aged 12 to 18 years were recruited. Diagnosis of depression was determined by two experienced clinical psychiatrists using the Structured Clinical Interview for DSM-IV and the Schedule for Affective Disorders and Schizophrenia for School-Age Children. The severity of depression was rated using the 17-item Hamilton Rating Scale for Depression.All subjects underwent MR imaging on a 3T GE Discovery MR750 scanner with a 16-channel head coil. The resting-state fMRI data were obtained using a gradient-echo echo-planar imaging sequence. First, group independent component analysis was used to identify intrinsic connectivity networks. Then, dynamic FC was calculated using a sliding window approach. Next, FC state analysis was performed to calculate the temporal properties of dynamic FC states. Finally, a graph theory method was applied to examine variability of topological organization of the FC network.
Between-group differences in temporal properties and dynamic graph metrics were estimated using nonparametric permutation tests (10,000 iterations). False discovery rate was used to correct for multiple comparisons. For adolescent MDD patients, partial correlation analyses were used to estimate the relationships between altered dynamic FC metrics and clinical variables. Age, sex, education level and mean FD were set as nuisance covariates.
Results
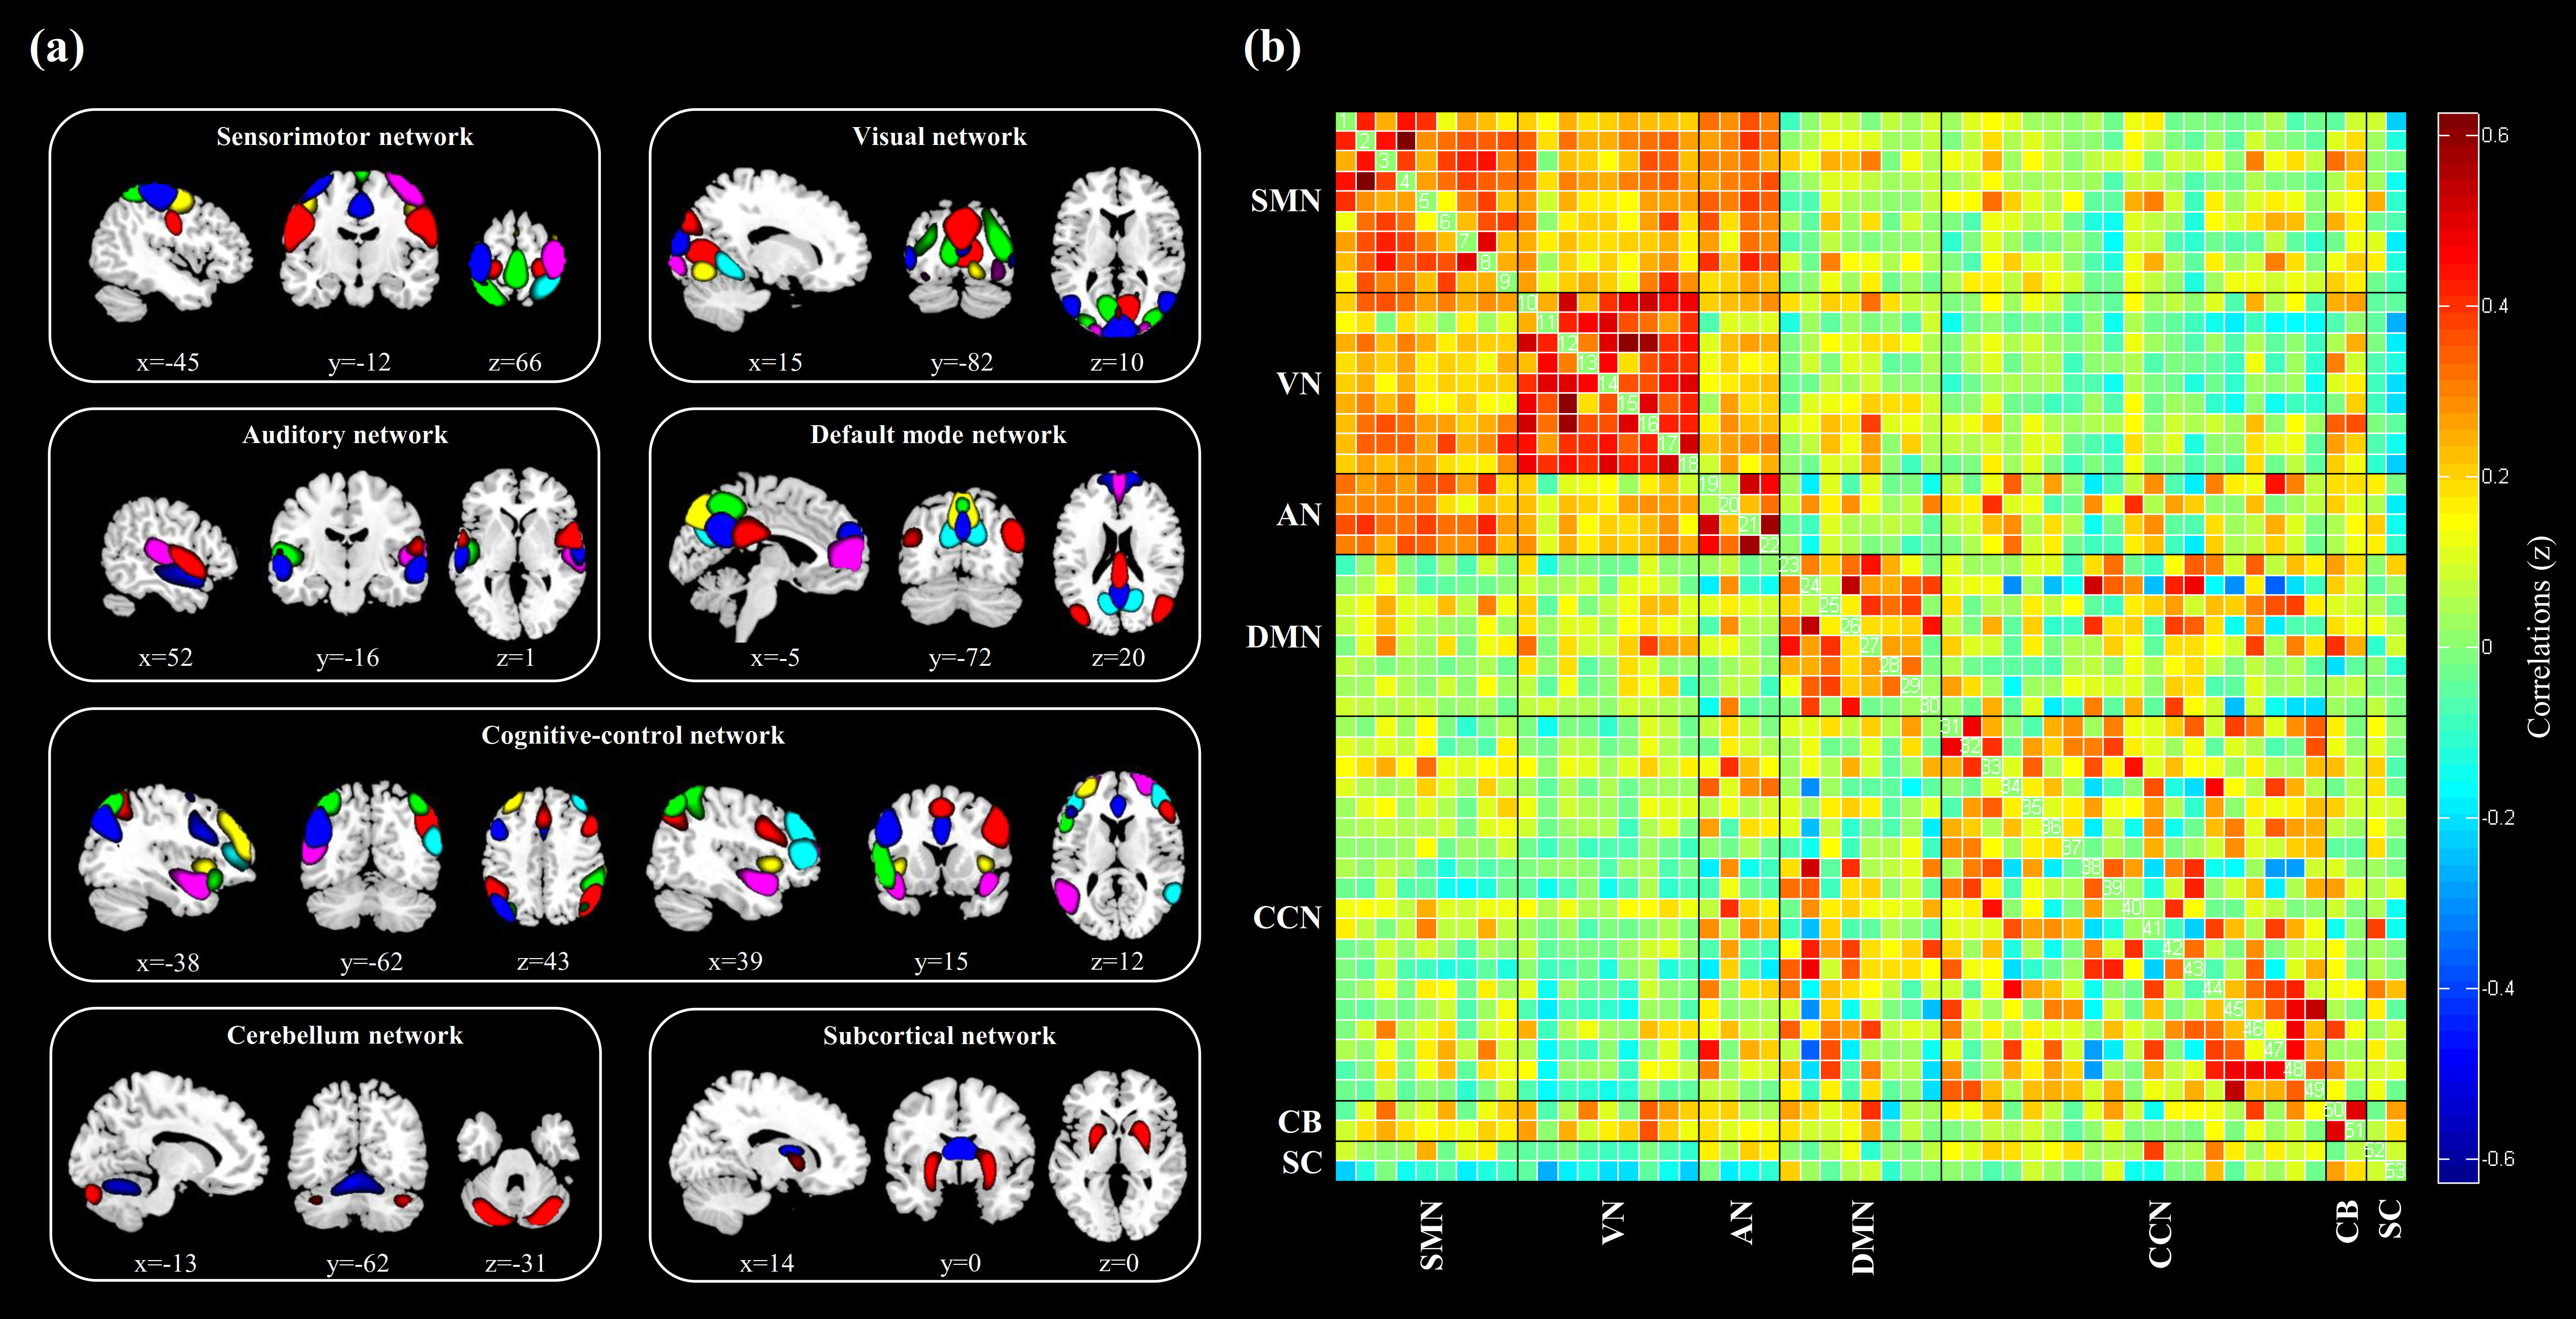
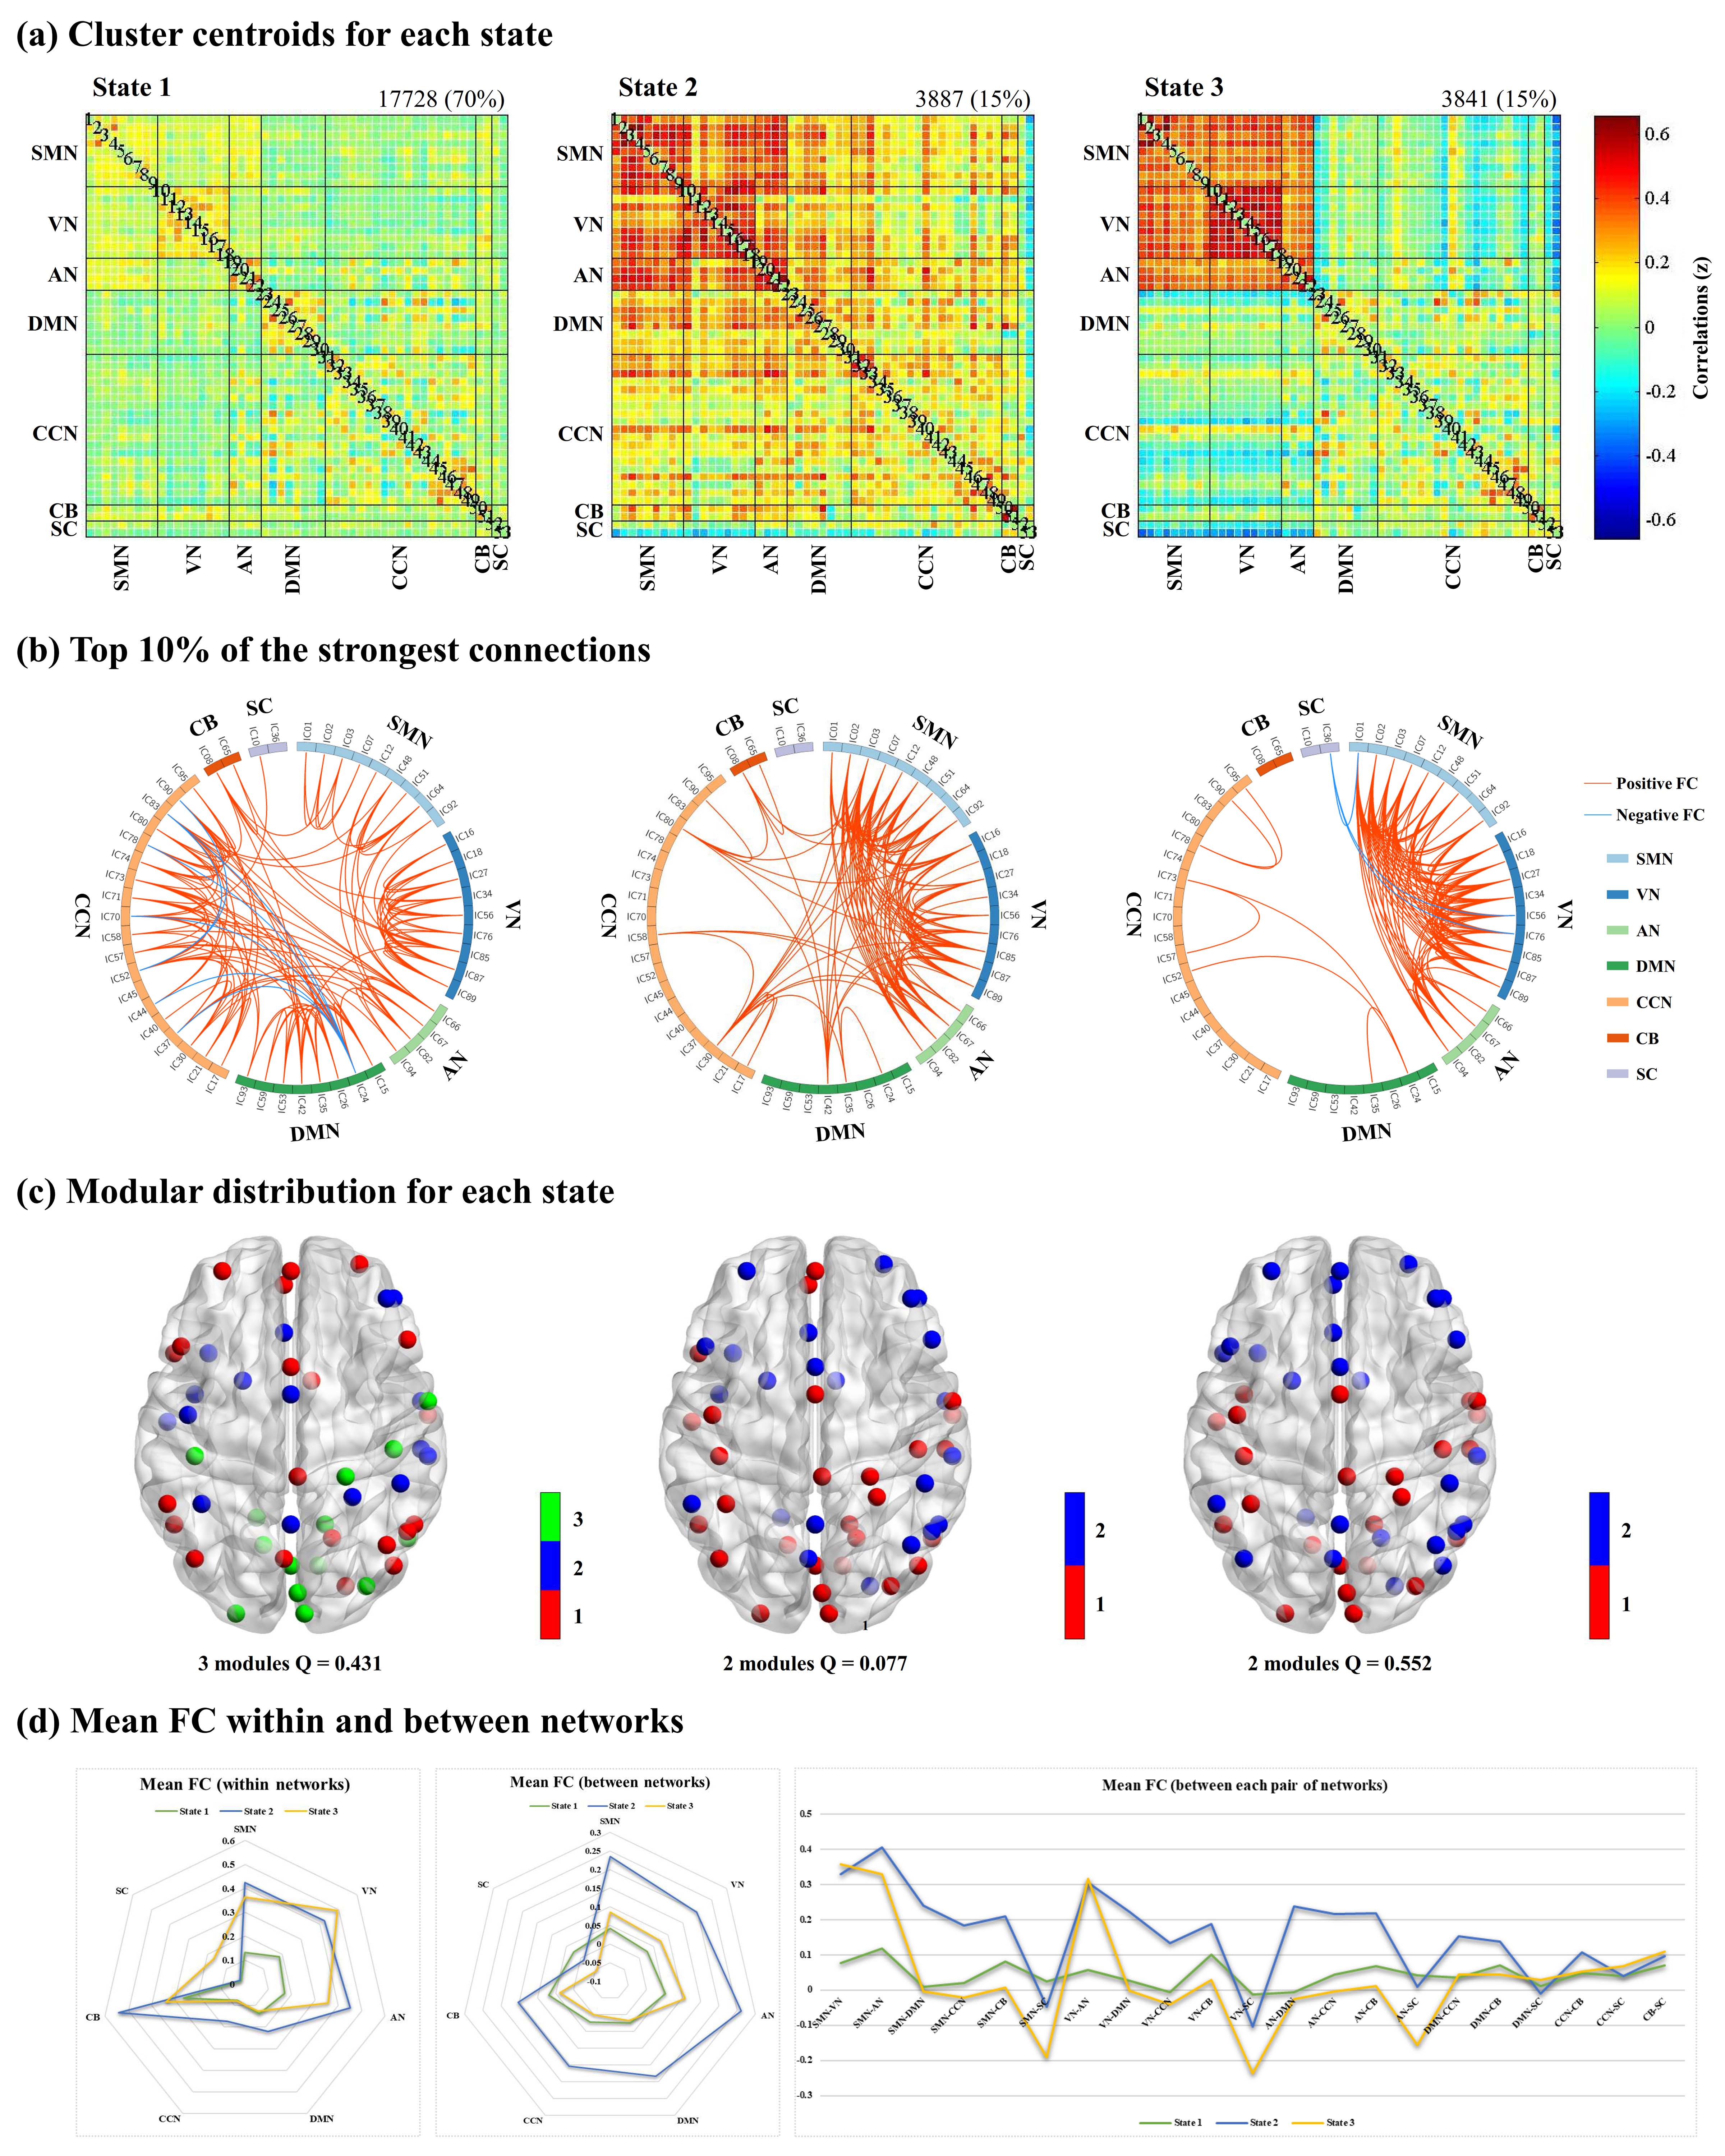
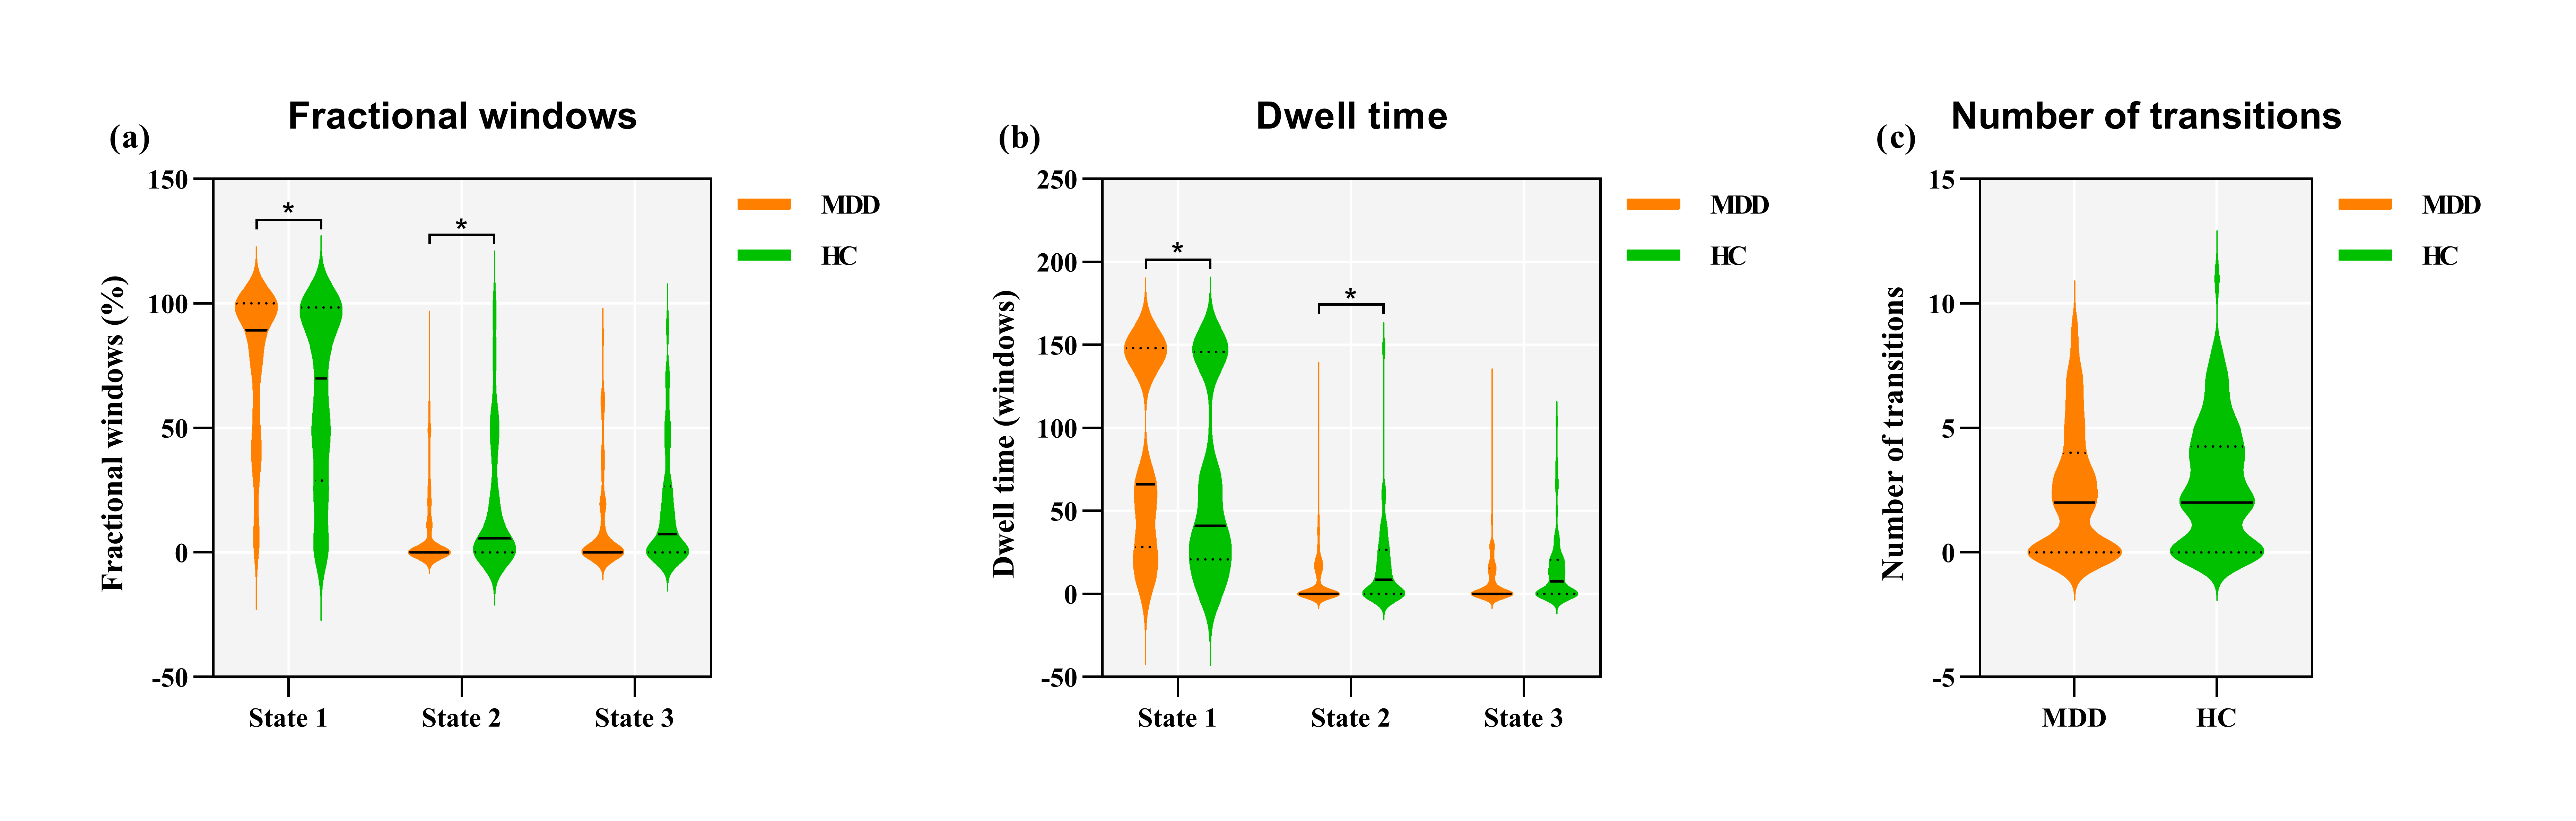
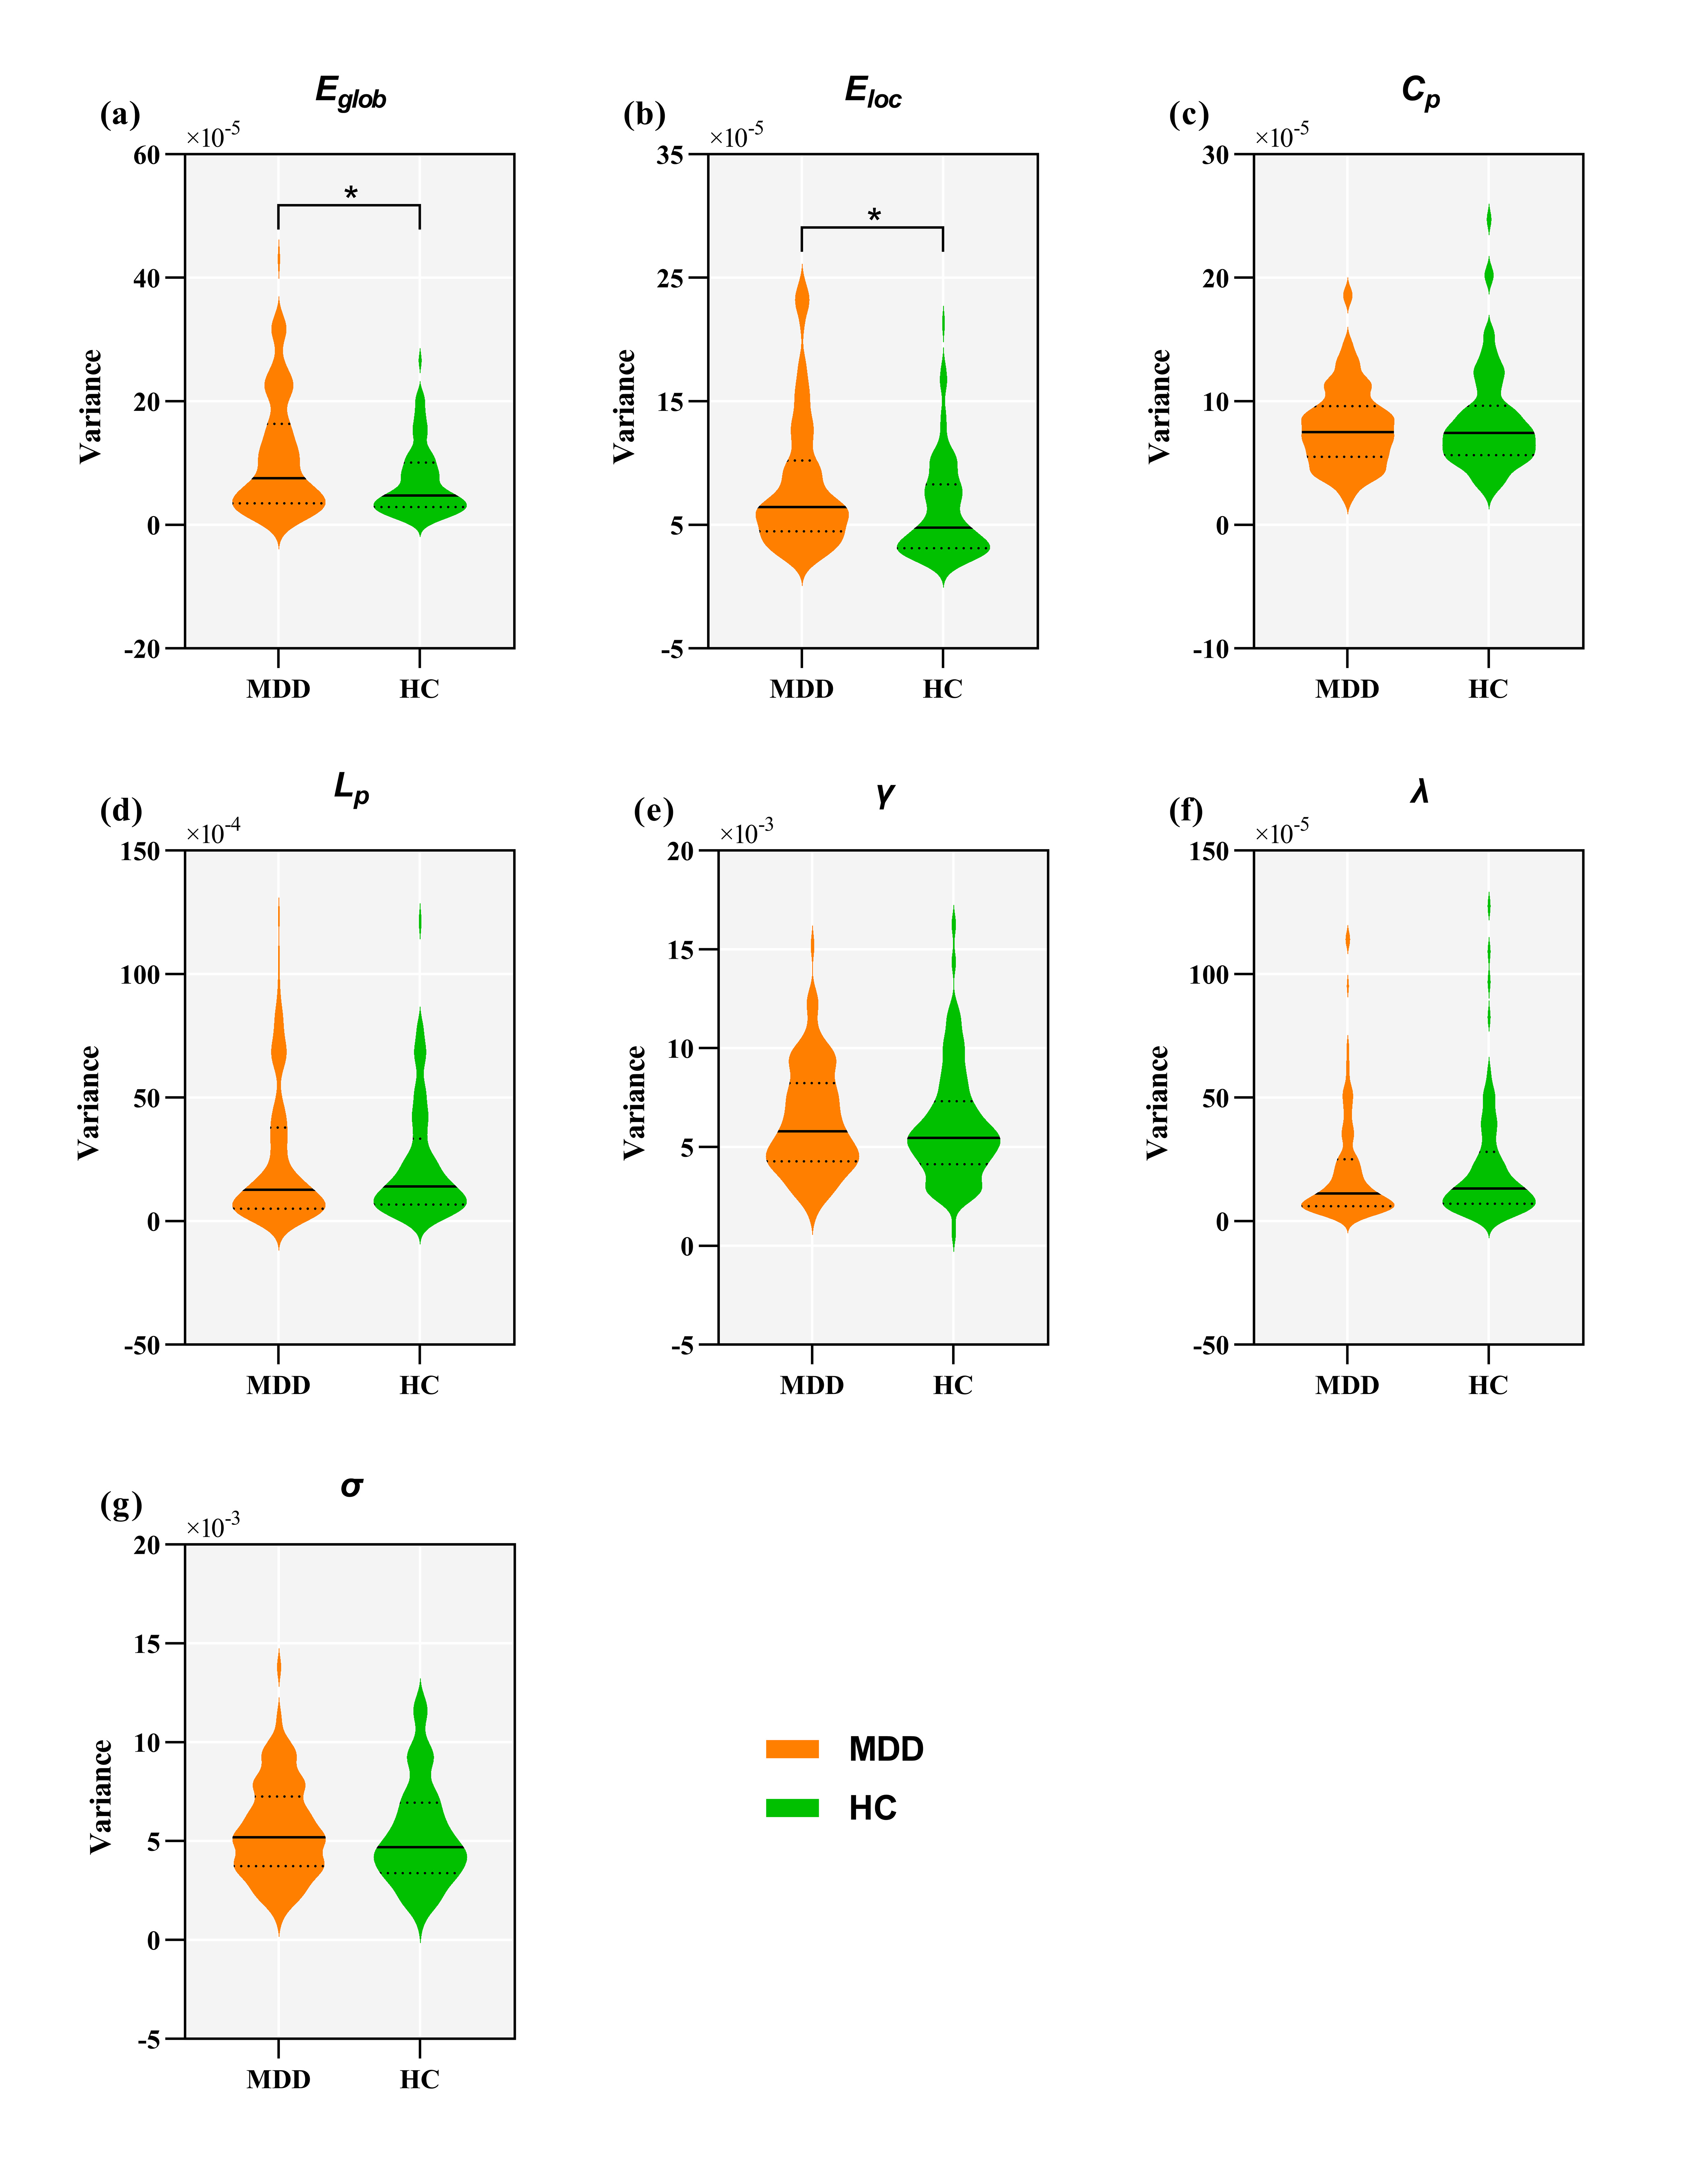
A total of 94 adolescent MDD patients (45 males and 49 females, mean age 15.95 ± 1.66 years) and 78 HCs (38 males and 40 females, mean age 16.12 ± 1.60 years). Demographic and clinical characteristics of the two groups are shown in Fig. 1. The selected 53 meaningful components were sorted into seven functional brain networks: sensorimotor, visual, auditory, default mode, cognition control, cerebellar and subcortical networks (Fig. 2). Three highly structured functional connectivity states were identified (Fig. 3a), and the three states had different global integration abilities and connection characteristics (Fig. 3b-d). Compared to controls, adolescents with MDD had higher fractional windows and longer mean dwell time in the frequently occurred, weakly-connected and relatively highly-modularized State 1, and had lower fractional windows and shorter mean dwell time in the less frequently occurred, strongly-connected and low-modularized State 2 (Fig. 4). Additionally, the variability of global and local efficiency was higher in adolescent MDD patients than in the control group (Fig. 5).Discussion
The main findings of our study were as follows: (1) adolescent MDD patients spent more time in the weakly-connected and relatively highly-modularized State 1, but less time in the strongly-connected and low-modularized State 2; (2) Disrupted FC among multiple networks were found in State 1; (3) a higher variability in the network efficiency (both global and local level) was observed in depressed adolescents, suggesting impaired local segregation and global integration of the functional brain networks.The brain dynamically reconfigures its functional organization to support diverse cognitive task performances 3. Successful reconfiguration underlying better task performance relies not only on sufficiently independent processing in specialized subsystems (i.e., segregation) but also on effective global cooperation between different subsystems (i.e., integration) 3-7. In healthy individuals, the resting brain’s functional organization is configured to maintain a balance between network segregation and integration, and this segregation–integration balance empowers the brain to support diverse cognitive abilities 8. Thus, our findings of increased time of functional segregation and decreased time of functional integration in adolescent MDD patients may reflect an abnormal dynamic network configuration. As a result, the optimal balance between network segregation and integration might be disrupted in depressed adolescents, leading to impaired functional flexibility.
This study also revealed the instability of the dynamic FC in adolescent MDD, as characterized by the higher variability of both global and local efficiency. In general, dynamic FC based on rs-fMRI reflects fluctuations in the exchange of information between brain regions during resting state, which occurs in an organized sequential manner. Eglob and Eloc measure the ability of a network to transmit information at the global and local level, respectively. Thus, the increased variance in network efficiency in adolescent MDD patients means low and unstable information transmission efficiency within/between the functional networks, and further suggests impaired local segregation and global integration of functional brain networks in adolescents with MDD.
Conclusion
Our study suggests abnormal dynamic functional network configuration in adolescents with MDD. Impaired local segregation and global integration of functional networks as well as segregation-integration imbalance may play important roles in the neurobiology of adolescent MDD.Acknowledgements
This study was supported by the National Natural Science Foundation of China (Grant Nos. 81971595, 81771812, 81820108018 and 81621003), the Program for Changjiang Scholars and Innovative Research Team in University (PCSIRT, Grant No. IRT16R52) of China, the Key Program of the National Natural Science Foundation of Sichuan Province (Grant No. 2022NSFSC0047), and the 1·3·5 Project for Disciplines of Excellence–Clinical Research Incubation Project, West China Hospital, Sichuan University (Grant No. 2020HXFH005).References
1. Malhi GS, Mann JJ. Depression. Lancet (London, England). 2018;392(10161):2299-2312.
2. Kessler RC, Avenevoli S, Costello EJ, et al. Prevalence, persistence, and sociodemographic correlates of DSM-IV disorders in the National Comorbidity Survey Replication Adolescent Supplement. Archives of general psychiatry. 2012;69(4):372-380.
3. Bassett DS, Bullmore ET. Small-World Brain Networks Revisited. The Neuroscientist : a review journal bringing neurobiology, neurology and psychiatry. 2017;23(5):499-516.
4. Deco G, Tononi G, Boly M, Kringelbach ML. Rethinking segregation and integration: contributions of whole-brain modelling. Nature reviews Neuroscience. 2015;16(7):430-439.
5. Shine JM. Neuromodulatory Influences on Integration and Segregation in the Brain. Trends in cognitive sciences. 2019;23(7):572-583.
6. Sporns O. Network attributes for segregation and integration in the human brain. Current opinion in neurobiology. 2013;23(2):162-171.
7. Fair DA, Dosenbach NU, Church JA, et al. Development of distinct control networks through segregation and integration. Proceedings of the National Academy of Sciences of the United States of America. 2007;104(33):13507-13512.
8. Wang R, Liu M, Cheng X, Wu Y, Hildebrandt A, Zhou C. Segregation, integration, and balance of large-scale resting brain networks configure different cognitive abilities. Proceedings of the National Academy of Sciences of the United States of America. 2021;118(23).
Figures
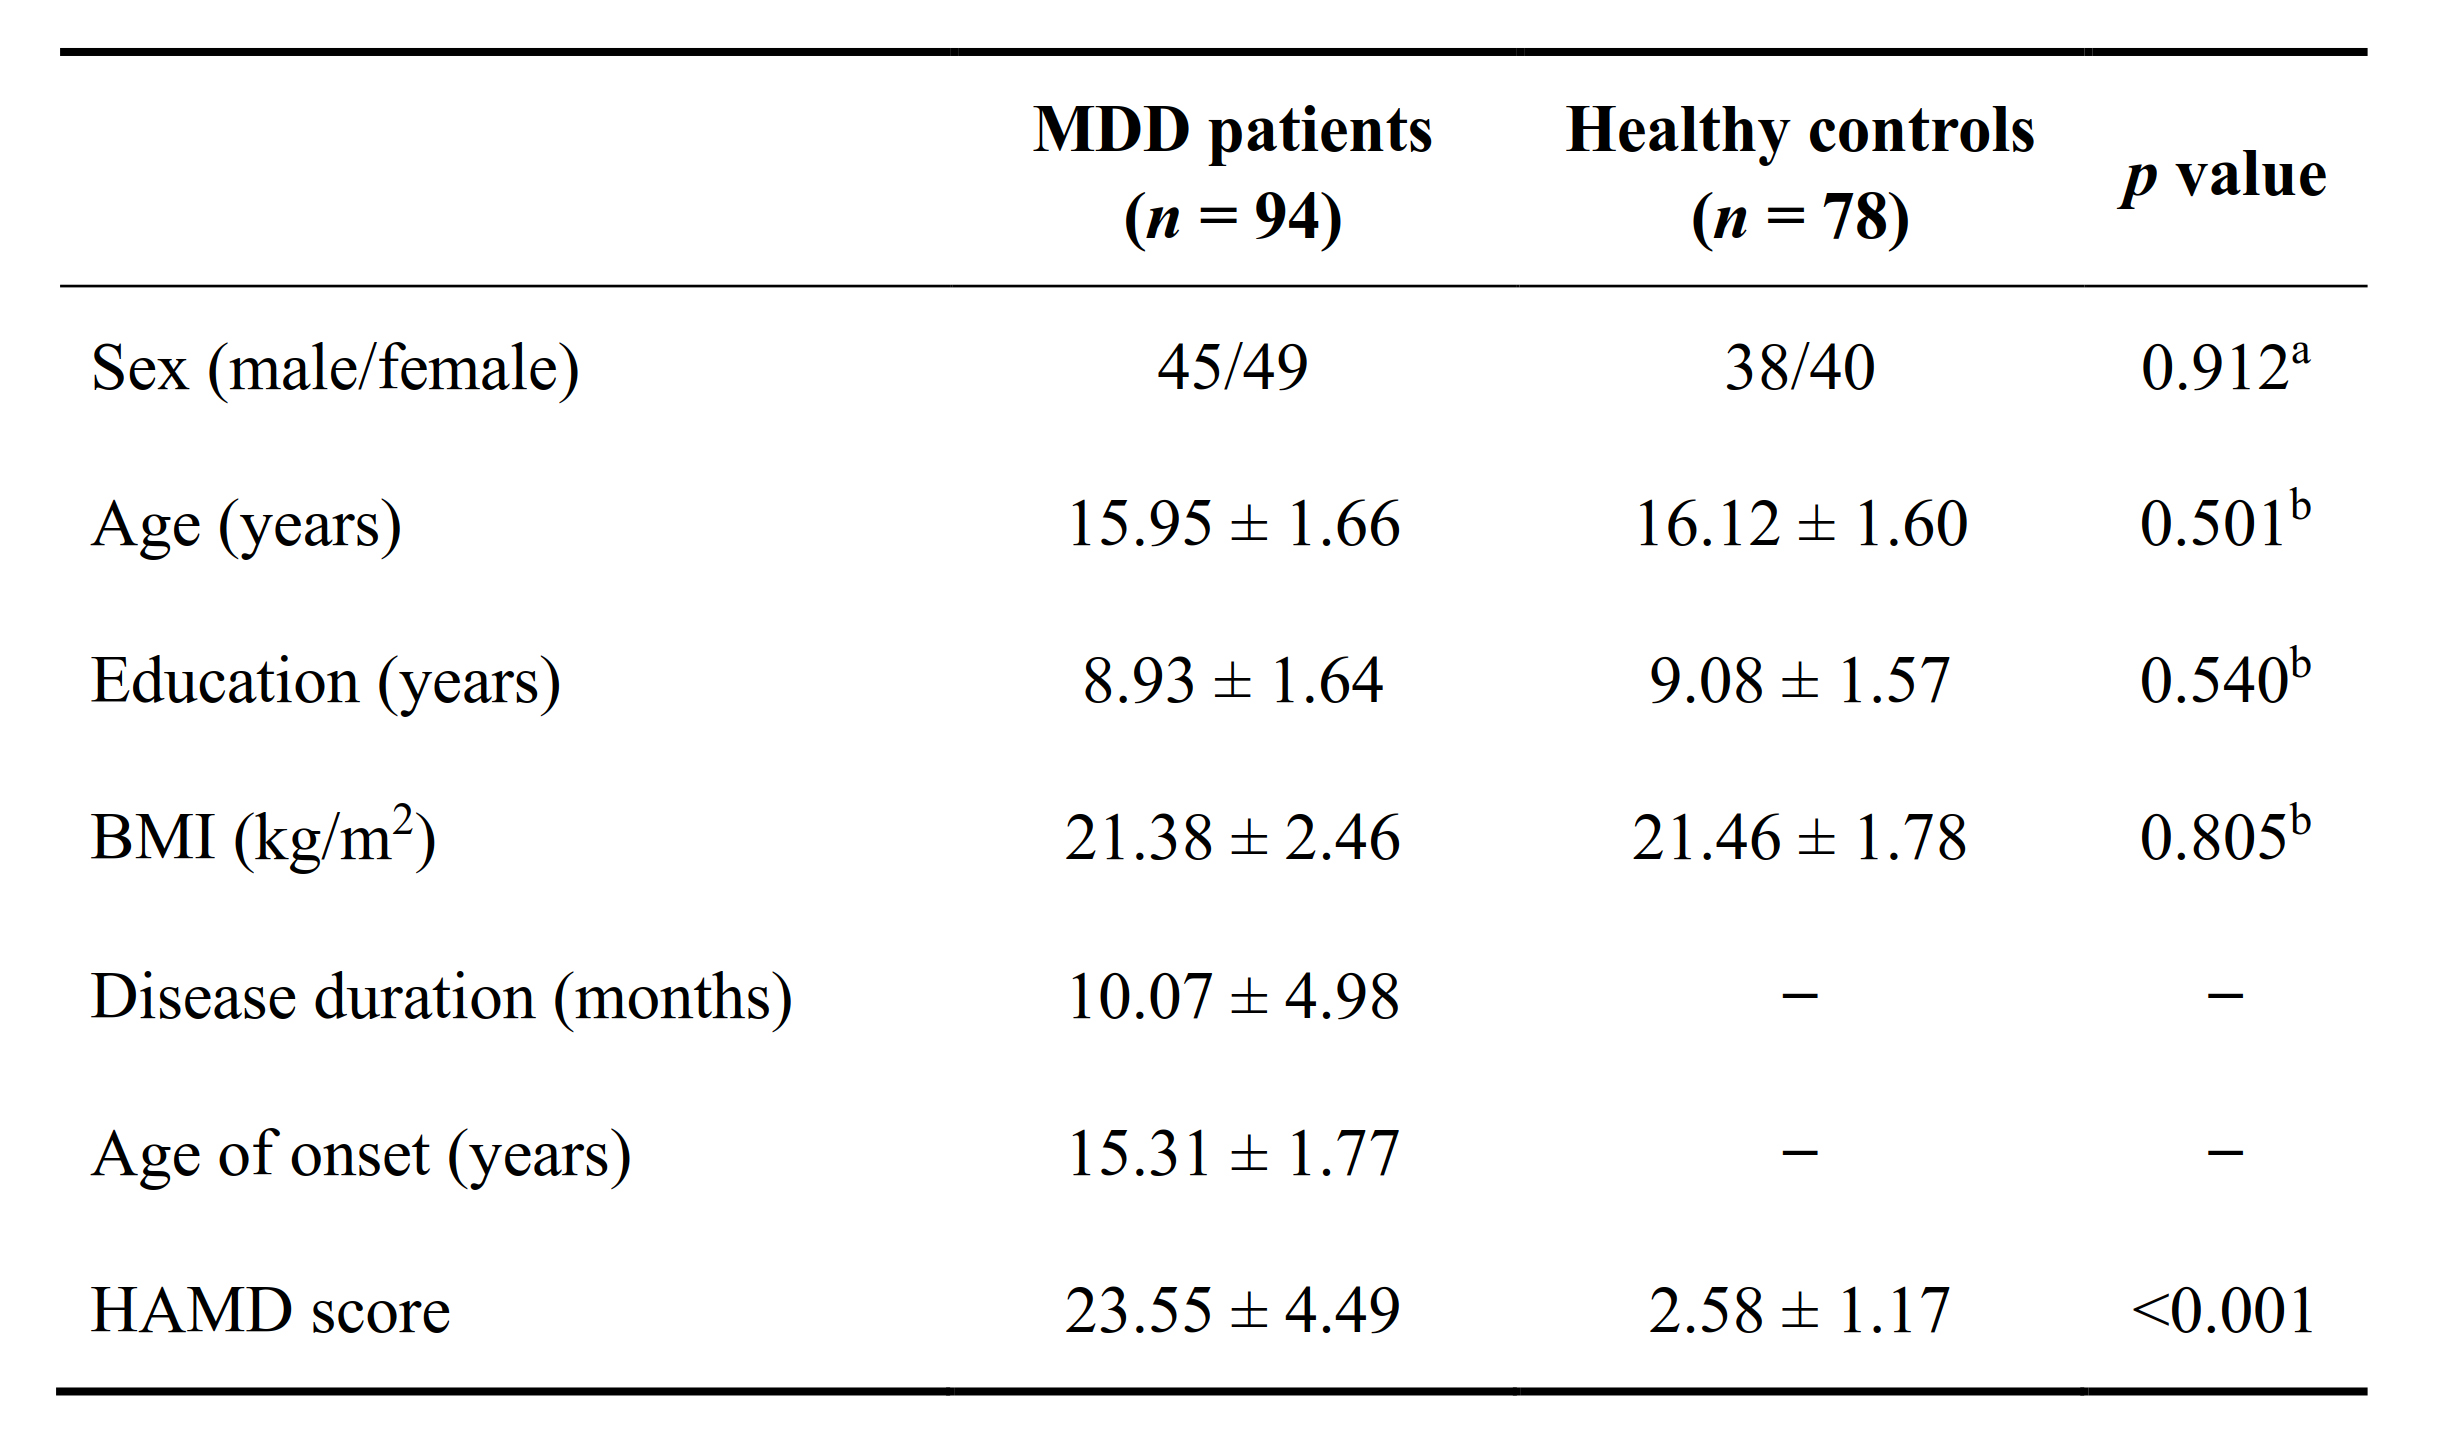
Fig. 1. Demographic and clinical characteristics of the participants. All quantitative data are expressed as mean ± standard deviation; numbers for sex data. aThe p value was calculated by using chi-square test. bThe p value was calculated by using independent two-samples t test. MDD, major depressive disorder; BMI, body mass index; HAMD, Hamilton Depression Rating Scale