3332
Impact of early suppression of mutant Huntingtin in LacQ140 mouse model of Huntington’s disease on resting-state dynamics
Tamara Vasilkovska1,2, Mohit H. Adhikari1,2, Joëlle van Rijswijk1,2, Eline Van Doninck1,2, Johan Van Audekerke1,2, Dorian Pustina3, Roger Cachope3, Haiying Tang3, Deanna M. Marchionini3, Ignacio Munoz-Sanjuan3, Annemie Van der Linden1,2, and Marleen Verhoye1,2
1Bio-Imaging Lab, Deparment of Biomedical Sciences, University of Antwerp, Antwerp, Belgium, 2μNEURO Research Centre of Excellence, University of Antwerp, Antwerp, Belgium, 3CHDI Management/CHDI Foundation, Princeton, NJ, United States
1Bio-Imaging Lab, Deparment of Biomedical Sciences, University of Antwerp, Antwerp, Belgium, 2μNEURO Research Centre of Excellence, University of Antwerp, Antwerp, Belgium, 3CHDI Management/CHDI Foundation, Princeton, NJ, United States
Synopsis
Keywords: Brain Connectivity, Preclinical, Huntington's Disease, dynamic resting-state fMRI
Dynamic analyses of resting-state (RS) fMRI reveal transient constituents of RS networks such as the quasi-periodic patterns (QPPs), and co-activation patterns (CAPs) that were shown to be sensitive markers of neurodegenerative diseases in rodent models and humans. We investigated the effect of early suppression of mutant huntingtin (mHtt) expression in the LacQ140 mouse model of Huntington’s disease (HD) on QPP and CAP alterations at the manifest state. In both QPPs and CAPs, the observed genotypic changes in local activity were reduced in the mHtt suppressed group. Additionally, a cross-validated, three-class classification using CAP activations successfully predicted the mHtt suppressed groupIntroduction
Huntington’s disease (HD) is the most common neurodegenerative disease of monogenic origin. Marked by an abnormal expansion of the CAG repeat (>40) in the huntingtin gene, HD manifests with progressive motor and cognitive impairments1. Despite the known genetic background and disease trajectory, many therapeutical strategies remain unsuccessful. Resting-state (RS) fMRI studies in HD have revealed functional connectivity (FC) impairments in several brain networks that also occur before motor deficit diagnosis2. However, these studies neglect the intermittent brain-states constituting the RS networks such as quasi-periodic patterns (QPPs) and co-activation patterns (CAPs) which can discern meaningful variations in the brain network dynamics (Fig.1B). Robust alterations in these brain-states have been detected in several neurodegenerative diseases such as Parkinson’s3, Alzheimer’s disease4,5 as well as HD6,7, making them promising candidates for biomarkers to probe therapeutic strategies. In this cross-sectional study, we investigated the functional impact of early (from 2-months of age) lowering of mutant huntingtin (mHtt) expression in the heterozygous LacO/LacIR-regulatable LacQ140 HD mouse model at the manifest state (11 months). Early blocking of mHtt expression in this model results in a 40-50% reduction of systemic mHtt expression at the manifest state8. At first, we characterized the spatio-temporal alterations in QPPs and CAPs in the fully mHtt expressed version of this model – LacQ140 in comparison with wild type (WT) mice. We then hypothesized that these alterations would be rescued in the cohort of mice in which mHtt expression was lowered from 2-months of age.Methods
RSfMRI data were acquired using a 9.4T Biospec MRI scanner with a mouse-head 2x2 array cryo-coil in three groups of 11-month-old mice: WT (10 males, 7 females), LacQ140 (9 males, 8 females) in which mHtt expression was allowed by adding the lactose analog isopropyl ß-D-1-thiogalactopyranoside (IPTG), LacQ140_2M (9 males, 8 females) in which mHtt expression was lowered from 2 months onward by withdrawing the IPTG. Mice were anesthetized using a mixture of medetomidine (0.075mg/kg s.c. bolus; 0.15 mg/kg/h s.c. infusion) and 0.5% isoflurane. 10-minute RSfMRI scans were acquired 40min post-bolus using a T2*-weighted single shot EPI sequence (TR/TE 500/15ms, 12 horizontal slices of 0.4mm, matrix [90 70], resolution (300 x 300 x 400) µm3, 1200 repetitions (Fig.1), preceded by acquisition of 3D RARE images (TE/TR 51.2/1800 ms, matrix [256 192 128], resolution (78 x 104 x 78) µm3) to create a study specific 3D template. Subject images were debiased, realigned, co-registered, normalized, smoothed, filtered (0.01-0.2 Hz), and global signal regressed. For each group, 200 short (3s) QPPs were extracted and clustered. Representative (highest occurring) QPPs in each cluster were spatially matched between groups. Z-scored BOLD signals of significantly activated (p<0.05, one-sample T-test, FDR corrected) voxels of matched representative QPPs were compared between each pair of groups using a two-sample T-test (p<0.05, FDR). QPP occurrences were compared using one-way ANOVA (p<0.05, FDR). CAP analysis was performed on concatenated pre-processed images from all subjects. All timeframes were clustered in a 2-20 clusters range of similar spatial distributions of voxel wise z-scored BOLD signals, averaged across cluster members to define CAPs. One-way ANOVA was used to statistically compare median durations (p<0.05, FDR), occurrence fractions (p<0.05, FDR), and mean voxel-wise spatial activations (p<0.05, Bonferroni) of CAPs between the three groups. Finally, we investigated the prediction power of CAPs’ spatial features to classify WT, LacQ140 and LacQ140_2M mice using multinomial logistic regression classifier and confusion matrices.Results
Two anti-correlated QPPs and CAPs, constituting anti-correlated lateral cortical network (LCN) and the default mode-like network (DMLN) were robustly identified in the LacQ140 and LacQ140_2M groups (Fig. 2, 3, 4). LCN QPP showed higher activation in the frontal association cortex in WT and the LacQ140_2M groups as compared to the LacQ140 group (Fig. 2). The LacQ140_2M showed additionally a higher activation in the somatosensory cortex compared to the LacQ140. In the DMLN QPP, a higher deactivation in the caudate putamen and higher activation in the olfactory bulb was present in both WT and LacQ140_2M compared to the LacQ140 group (Fig. 3). In the LCN CAP, activation in the somatosensory cortex and caudate putamen was the highest in LacQ140_2M group, followed by WT and LacQ140 groups. In the DMLN CAP, the activation in DMLN regions was the highest in LacQ140 mice, followed by LacQ140_2M and WT groups (Fig. 4). Temporal properties of CAPs and QPPs showed no group effect. Three-class Classification accuracy was significantly higher than the chance-level for all partitions of the image-series (Fig. 5 left). Confusion matrix showed, especially after the 10 CAPs partition, LacQ140_2M was predicted most accurately; and misclassified LacQ140_2M subjects were more likely to be predicted as WT subjects rather than LacQ140 and vice-versa.Discussion and Conclusion
Our findings demonstrate that, both QPPs and CAPs are significantly altered in the LacQ140 HD mouse model at the manifest state and early mHtt-lowering results in a therapeutic-like, rescue effect. Similarity between LacQ140_2M and WT groups was confirmed in the confusion matrix of cross-validated classification performed using CAPs’ spatial properties. Further, activation differences in the somatosensory cortex and caudate putamen in both QPPs and CAPs indicate an overcompensatory effect of the early mHtt suppression motivating a future, longitudinal investigation of the impact of this early intervention.Acknowledgements
No acknowledgement found.References
- Tabrizi SJ, Schobel S, Gantman EC, Mansbach A, Borowsky B, Konstantinova P, Mestre TA, Panagoulias J, Ross CA, Zauderer M, Mullin AP, Romero K, Sivakumaran S, Turner EC, Long JD, Sampaio C; Huntington's Disease Regulatory Science Consortium (HD-RSC). A biological classification of Huntington's disease: the Integrated Staging System. Lancet Neurol. 2022 Jul;21(7):632-644.
- Pini L, Jacquemot C, Cagnin A, Meneghello F, Semenza C, Mantini D, Vallesi A. Aberrant brain network connectivity in presymptomatic and manifest Huntington's disease: A systematic review. Hum Brain Mapp. 2020 Jan;41(1):256-269
- Zhuang X, Walsh RR, Sreenivasan K, Yang Z, Mishra V, Cordes D. Incorporating spatial constraint in co-activation pattern analysis to explore the dynamics of resting-state networks: An application to Parkinson's disease. Neuroimage. 2018 May 15;172:64-84.
- Adhikari MH, Belloy ME, Van der Linden A, Keliris GA, Verhoye M. Resting-State Co-activation Patterns as Promising Candidates for Prediction of Alzheimer's Disease in Aged Mice. Front Neural Circuits. 2021 Jan 22;14:612529.
- Belloy ME, Shah D, Abbas A, Kashyap A, Roßner S, Van der Linden A, Keilholz SD, Keliris GA, Verhoye M. Quasi-Periodic Patterns of Neural Activity improve Classification of Alzheimer's Disease in Mice. Sci Rep. 2018 Jul 3;8(1):10024.
- Vasilkovska T., Callewaert B., Salajeghe S., Pustina D., Liu L., Skinbjerg M., et al. (2021). Altered Patterns of Neural Activity and Functional Connectivity Revealed by Dynamic rsfMRI in the Q175 Mouse Model of Huntington's Disease. Int. Soc. Magn. Reson. Med. Online Abstracts. Abstract Nr 1245. Available online at: https://archive.ismrm.org/2020/1245.html
- Adhikari M., Vasilkovska T., Pustina D., Liu L., Cachope R., Tang H., et al. (2021) Resting-state co-activation patterns (CAPs) accurately predict pre- and manifest- stage Huntington’s disease in mice. Int. Soc. Magn. Reson. Med. Online Abstracts. Abstract Nr 2938. Available online at: https://archive.ismrm.org/2021/2938.html
- Marchionini DM, Liu JP, Ambesi-Impiombato A, Kerker K, Cirillo K, Bansal M et al. Benefits of global mutant huntingtin lowering diminish over time in a Huntington's disease mouse model. JCI Insight. 2022 Oct 24;7(20):e161769
Figures
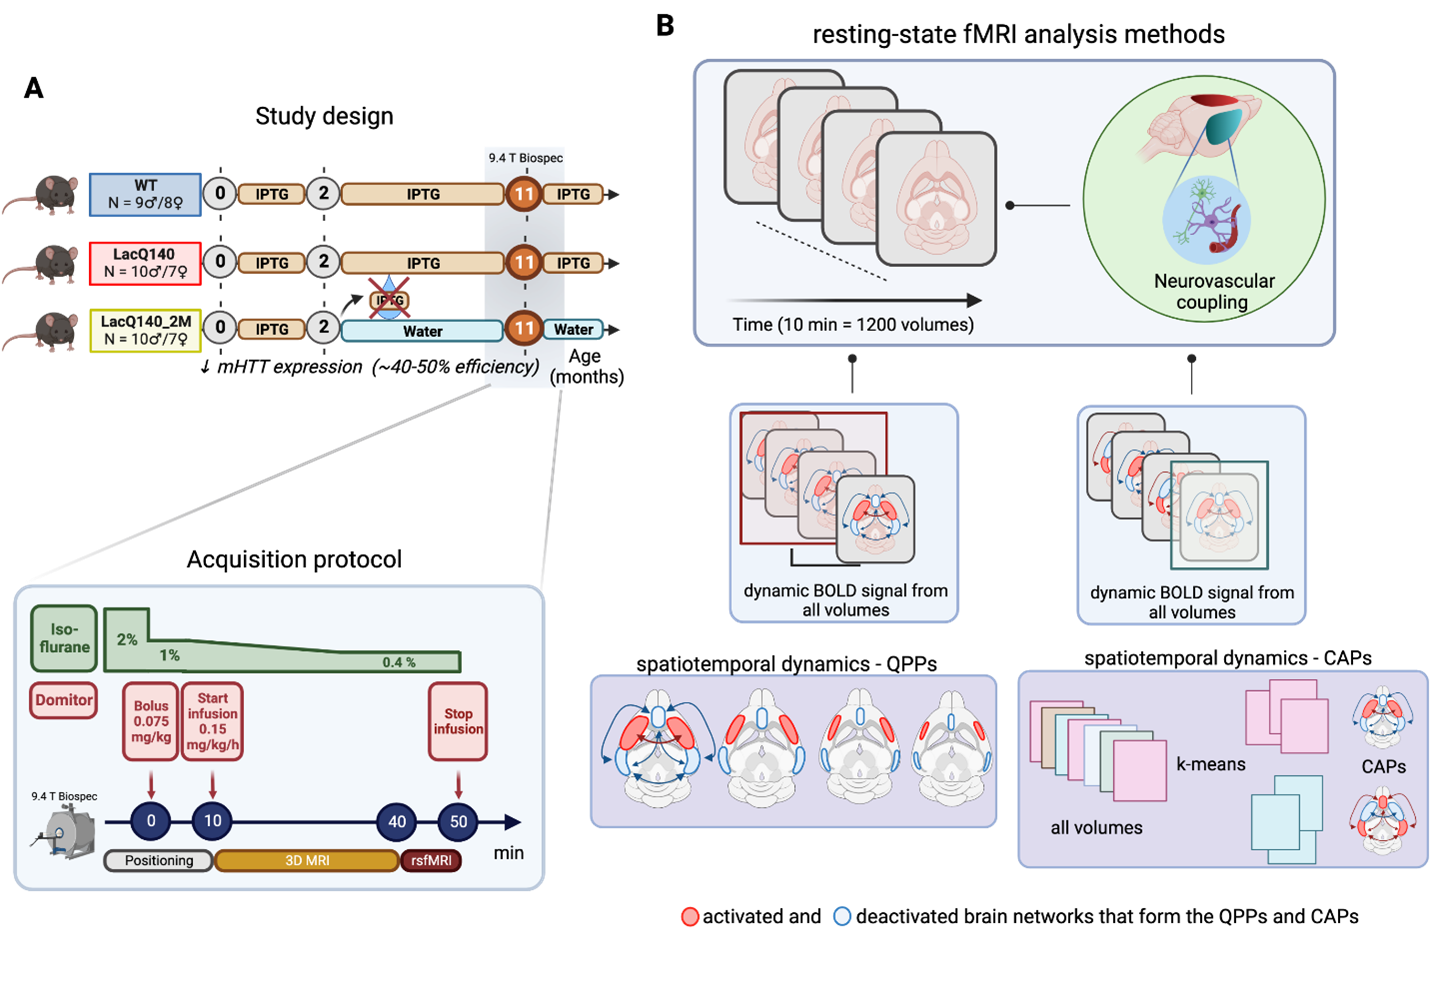
Figure 1. (A) Study design and
acquisition protocol (B) resting-state fMRI data and subsequent analysis method
applied in this study, window specific QPPs and frame-wise method CAPs.
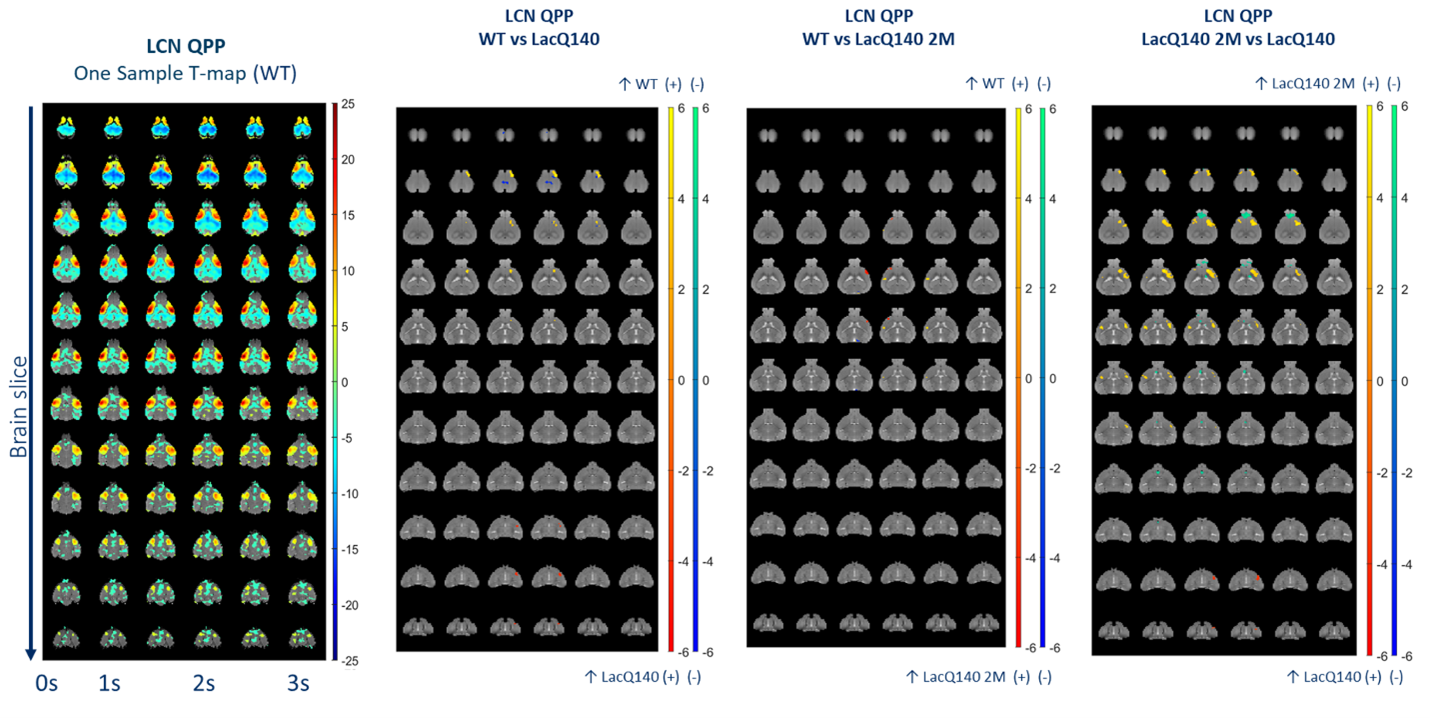
Figure
2. Representative
LCN QPP (One-sample T-map of (red) / (blue) higher/lower BOLD activity
relative to the global mean BOLD signal)
and significant spatial activation differences for LCN QPP (two-sample
T-test, p<0.05, FDR corrected); (yellow) / (green) higher positive/negative BOLD
activity in first group and (red) / (blue) higher positive/negative BOLD
activity in the second group
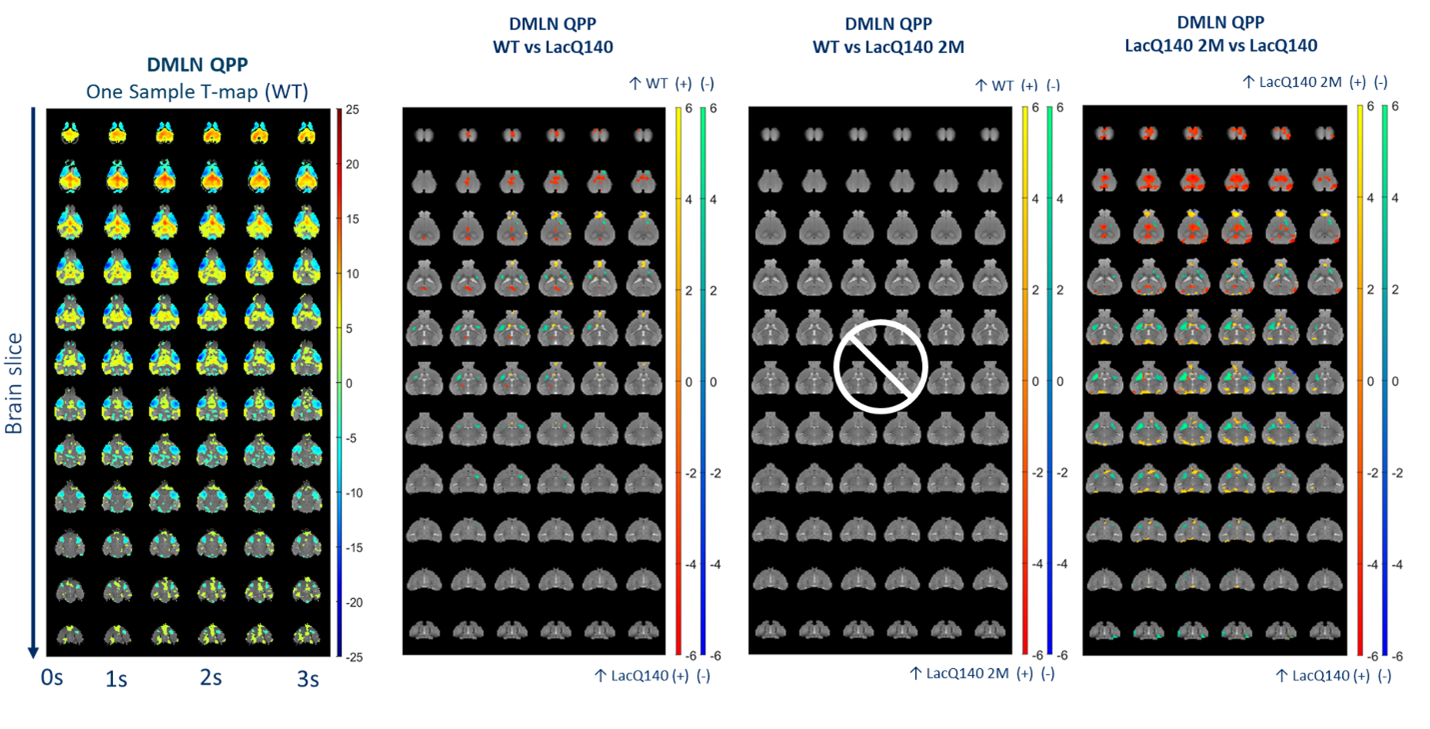
Figure
3. Representative
DMLN QPP (One-sample T-map of (red) / (blue) higher/lower
BOLD activity relative to the global mean BOLD signal) and significant spatial activation differences
for DMLN QPP (two-sample T-test, p<0.05, FDR corrected); (yellow) / (green) higher
positive/negative BOLD activity in first group and (red) / (blue) higher positive/negative BOLD
activity in the second group
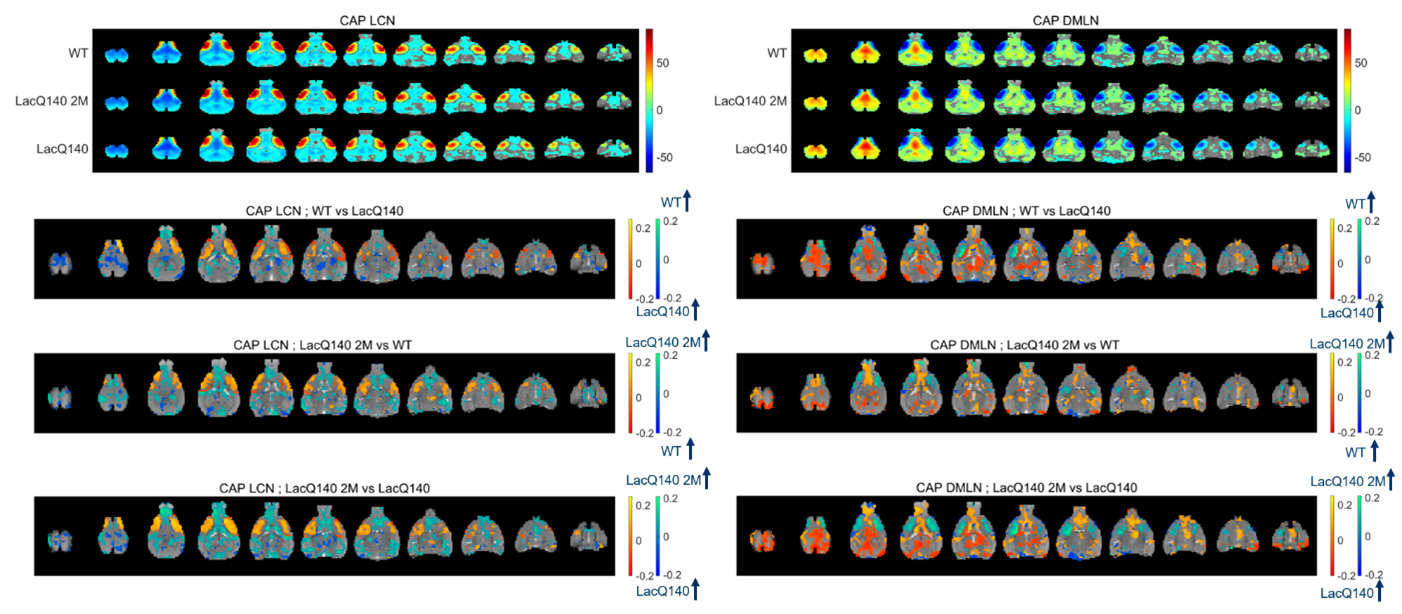
Figure 4. Top panels: one-sample T-test
statistic maps for the LCN and the DMLN CAPs for the WT, LacQ140 2M, and LacQ140
groups. Bottom panels: two-sample T-test statistic maps for voxels that
showed first a significant group effect (p < 0.05, one-way ANOVA, Bonferroni
corrected) and a significant (p < 0.05, FDR corrected) inter-group
difference in their activation. The red-yellow and blue-green colour bars
indicate the T-statistic for voxels that are co-activated and co-deactivated,
respectively, in the first group.
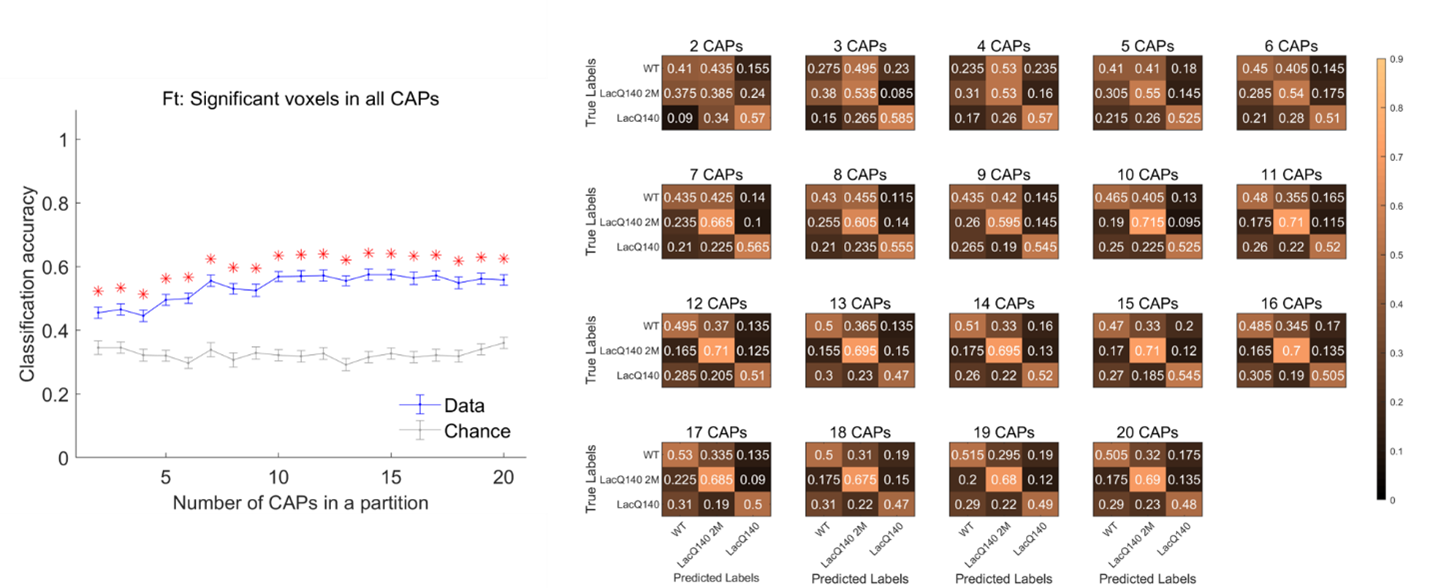
Figure
5. Three-class (WT vs
LacQ140 vs LacQ140_2M) classification accuracy (blue, mean +/- SEM, left panel)
and confusion matrix (right panel) using the spatial (voxel-level activations, left
panel) properties of each CAP within a partition as a function of partitions,
with different numbers of clusters, of the combined image series from all three
groups. Red asterix indicates significantly higher mean accuracy than the
chance level, after correcting for multiple comparisons. After the 10-CAP
partition, the LacQ140_2M class is predicted most accurately.
DOI: https://doi.org/10.58530/2023/3332