3329
Interrogating the effect of thawing on Fe speciation in human tissue using XANES
Dean Tran1, Phillip DiGiacomo1, Marios Georgiadis1, Nicholas Edwards2, Sharon Bone2, Donald Born3, Samuel Webb2, and Michael Zeineh1
1Department of Radiology, Stanford University, Stanford, CA, United States, 2Stanford Synchrotron Radiation Lightsource, SLAC National Accelerator Laboratory, Menlo Park, CA, United States, 3Department of Pathology, Stanford University, Stanford, CA, United States
1Department of Radiology, Stanford University, Stanford, CA, United States, 2Stanford Synchrotron Radiation Lightsource, SLAC National Accelerator Laboratory, Menlo Park, CA, United States, 3Department of Pathology, Stanford University, Stanford, CA, United States
Synopsis
Keywords: Alzheimer's Disease, Alzheimer's Disease, X-ray microscopy
Recent studies suggest that iron and neuroinflammation are key components of AD pathology. Specifically, ferrous Fe2+ can cause oxidative stress, a possible a mechanistic link to disease progression. Correlative ex vivo MRI can detect iron-containing microglia in AD hippocampi, but whether this iron is ferrous is unknown. Synchrotron X-ray absorption near edge spectroscopy (XANES) can quantify iron oxidation state in frozen human brain samples. However, tissue thawing during the long scans might affect the oxidation state. Here, we implement the necessary hardware to interrogate that question and present preliminary evidence that, as specimens thaw, less redox-active ferrous iron is measured.Introduction
Alzheimer’s disease (AD) has primarily been characterized by the accumulation of β-amyloid (Aβ) in plaques and phosphorylated tau in neurofibrillary tangles, although there is evidence that these markers are not solely responsible for neurodegeneration. Notably, there exists an abundance of evidence supporting the presence of iron accumulation in AD, as reviewed in Tran et al. 20221, among others. For example, MRI has been used alongside coregistered histology to show iron-containing activated microglia within the hippocampus in advanced AD but not in age-matched controls2. However, the specific role that iron plays in the mechanisms of AD neurodegeneration is presently unknown.One hypothesis is that the conversion of ferric (Fe3+) to ferrous (Fe2+) iron in the AD brain leads to production of free radicals via the Fenton reaction, which, in turn, causes oxidative damage to neurons3,4. For this reason, an outstanding question to understand the role of iron in AD pathology is to determine the relative oxidation state of iron in health and disease.
To interrogate this question, we have aimed to perform synchrotron X-ray fluorescence imaging (XFI) to map iron deposition5,6 and X-ray absorption near edge spectroscopy (XANES) to quantify oxidation state of specific iron deposits in human brain tissue7,8 (from AD subjects and age-matched healthy control) in collaboration with colleagues at the SLAC National Accelerator Laboratory (SLAC). X-ray microscopy is uniquely suited to identify iron in the same scale as specimen MRI and characterize the oxidation state with absorption spectroscopy. To minimize effects of formalin fixation and capture iron in its most biologically relevant state, we generally use unfixed, frozen specimens for these experiments, while performing MRI on the contralateral formalin-fixed hippocampus, to enable correlation of X-ray based measures of iron to quantitative MRI and facilitate clinical translation (Figure 1). However, during the hours-long imaging, slides quickly thaw, and the effect of thawing on iron speciation in situ is unknown.
Recently, we have built and implemented a frozen chamber for the SLAC beam-line. The current work aimed to acquire high-resolution mapping and quantification of iron oxidation state in human brain tissue in a maintained frozen state, and to assess whether thawing affects XANES measurement of iron’s oxidation state in the same tissue.
Methods
Frozen hippocampi were acquired from AD and control subjects from the Stanford Neuropathology Core affiliated with the Stanford Alzheimer’s Disease Research Center. Samples were frozen-sectioned at 30 μm slice-thickness. Two hippocampi were scanned for these experiments.XFI and XANES were performed at using a cryo-chamber at beamline 2-3, which has a beam size of 3μm. XFI was obtained at up to 5μm in-plane resolution to guide selection of 6 individual iron-rich deposits for each specimen, while kept in the cryo-chamber at -20o C. XANES spectra were acquired on each deposit while frozen at -20o C (four averages per deposit), and subsequently reacquired on the exact same deposits at room temperature after allowing tissue to thaw, allowing us to directly compare the effects of thawing on XANES spectra. Additional adjacent deposits were scanned at room temperature to control for potential effects of the X-ray beam itself.
Visualization and averaging of individual spectra acquired for each specimen was performed using MicroTool Kit. These averaged spectra were then energy calibrated using the spectra from a standard iron foil. An in-house MATLAB script performed background subtraction and normalization by linearly fitting the pre-edge (up to 7105 eV) and the post-edge (beyond 7200 eV) to normalize the background to roughly zero in the pre-edge and generate a unit-step edge with a roughly constant post-edge of one. To obtain an estimate of the relative proportion of different iron species within individual deposits, reference X-ray absorption spectra from standards of ferrihydrite (Fe3+) and FeSO4 (Fe2+), each of which had undergone the same background removal process, were used to fit the measured iron L2,3-edge X-ray absorption spectra from each deposit, using a non-linear least-squares fitting procedure.
Results
We found that, on average, thawed iron deposits in both scanned specimens exhibited a slight rightward shift in the normalized XANES spectra compared to the same deposits scanned while frozen (Figure 2), suggesting a decrease in measured Fe2+ and an increase in Fe3+ caused by thawing. Fitting the X-ray spectra to standards estimated the Fe3+/Fe2+ composition, which confirmed a quantitative increase in Fe3+ composition, accompanied by decreases of Fe2+, across specimens and deposits (Figure 3).Discussion and Conclusion
We have implemented a novel cryochamber hardware setup to interrogate the effects of freezing and thawing on XANES-measured oxidation state of iron in human brain tissue. Our preliminary results suggest a possible change in iron speciation, with an increase in Fe3+ following thawing. This could be due to the increase of oxygen reactivity upon thawing, driving iron oxidation. This result suggests that measurements under a thawed state will alter iron oxidation and underestimate the amount of Fe2+, which can also affect MRI measurements9. Our ongoing work will collect more data from additional specimens, using this method to investigate differences in iron oxidation state in biological brain specimens.Acknowledgements
No acknowledgement found.References
- Tran, D., DiGiacomo, P., Born, D., Georgiadis, M., and Zeineh, M.. (2022). Iron and Alzheimer’s Disease: From Pathology to Imaging. Frontiers in Human Neuroscience. 10:838692. doi: 10.3389/fnhum.2022.838692
- Zeineh, M. M., Chen, Y., Kitzler, H. H., Hammond, R., Vogel, H., and Rutt, B. K. (2015). Activated iron-containing microglia in the human hippocampus identified by magnetic resonance imaging in alzheimer disease. Neurobiol. Aging 36, 2483–2500. doi: 10.1016/j.neurobiolaging.2015.05.022
- Huang, X., Atwood, C. S., Hartshorn, M. A., Multhaup, G., Goldstein, L. E., Scarpa, R. C., et al. (1999). The Aβ peptide of Alzheimer’s disease directly produces hydrogen peroxide through metal ion reduction. Biochemistry 38, 7609–7616. doi: 10.1021/bi990438f
- Everett, J., Céspedes, E., Shelford, L., Exley, C., Collingwood, J. F., Dobson, J., et al. (2014). Ferrous iron formation following the co-aggregation of ferric iron and the Alzheimer’s disease peptide β-Amyloid (1-42). J. R. Soc. Interface 11:20140165. doi: 10.1098/rsif.2014.0165
- Hopp, K., FGh Popescu, B., McCrea, R. P. E., Harder, S. L., Robinson, C. A., Haacke, M. E., et al. (2010). Brain iron detected by SWI high pass filtered phase calibrated with synchrotron X-ray fluorescence. J. Magn. Reson. Imaging 31, 1346–1354. doi: 10.1002/jmri.22201
- Zheng, W., Haacke, E. M., Webb, S. M., and Nichol, H. (2012). Imaging of stroke: a comparison between X-ray fluorescence and magnetic resonance imaging methods. Magn. Reson. Imaging 30, 1416–1423. doi: 10.1016/j.mri.2012.04.011
- Collingwood, J. F., Mikhaylova, A., Davidson, M., Batich, C., Streit, W. J., Terry, J., et al. (2005). In situ characterization and mapping of iron compounds in Alzheimer’s disease tissue. J. Alzheimers Dis. 7, 267–272. doi: 10.3233/jad-2005-7401
- Álvarez-Marimon, E., Castillo-Michel, H., Reyes-Herrera, J., Seira, J., Aso, E., Carmona, M., et al. (2021). Synchrotron X-Ray fluorescence and FTIR signatures for amyloid fibrillary and nonfibrillary plaques. ACS Chem. Neurosci. 12, 1961–1971. doi: 10.1021/acschemneuro.1c00048
- Birkl, C., Birkl-Toeglhofer, A., Kames, C., Goessler, W., Haybaeck, J., Fazekas, F., Ropele, S., and Rauscher, A. (2020). The influence of iron oxidation state on quantitative MRI parameters in post mortem human brain. NeuroImage. 220:117080. doi: 10.1016/j.neuroimage.2020.117080
Figures
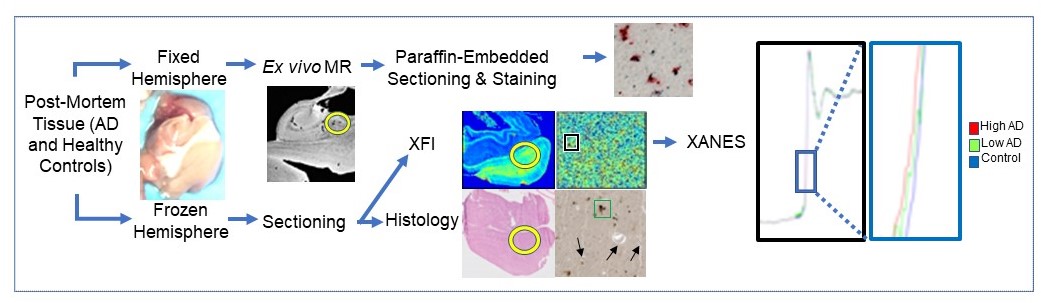
Figure 1.
Flowchart of current experimental paradigm, leveraging post-mortem tissue from
healthy controls and subjects with AD. MRI is performed on formalin-fixed
tissue, prior to paraffin-embedded sectioning and extensive histological
analysis. The contralateral hemisphere is frozen-sectioned prior to X-ray
microscopy as described here.
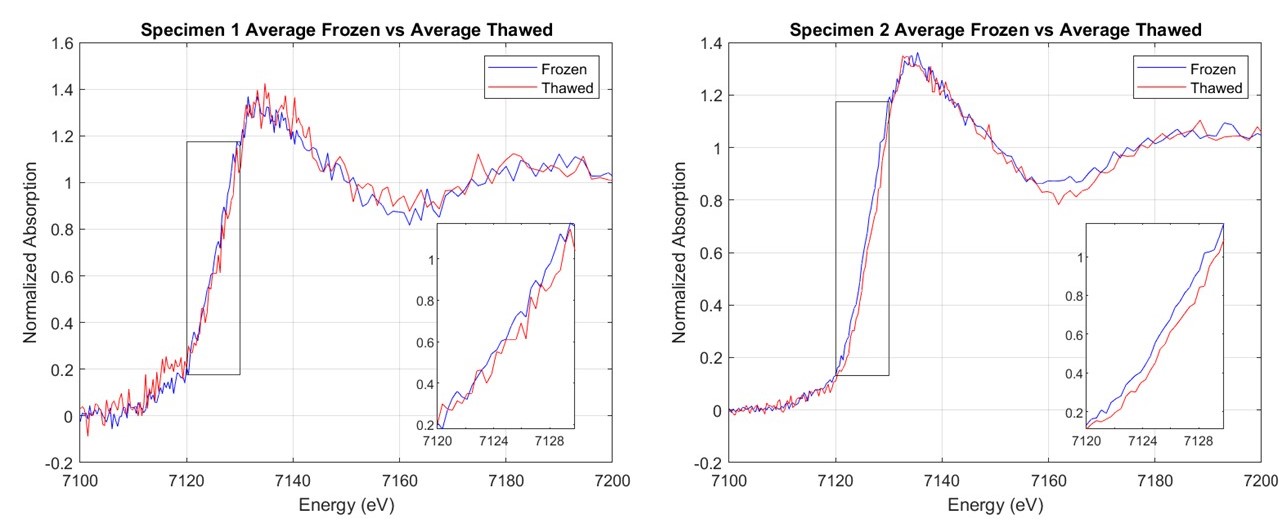
Figure 2. Frozen vs. thawed normalized XANES spectra of each specimen averaged
across all deposits.
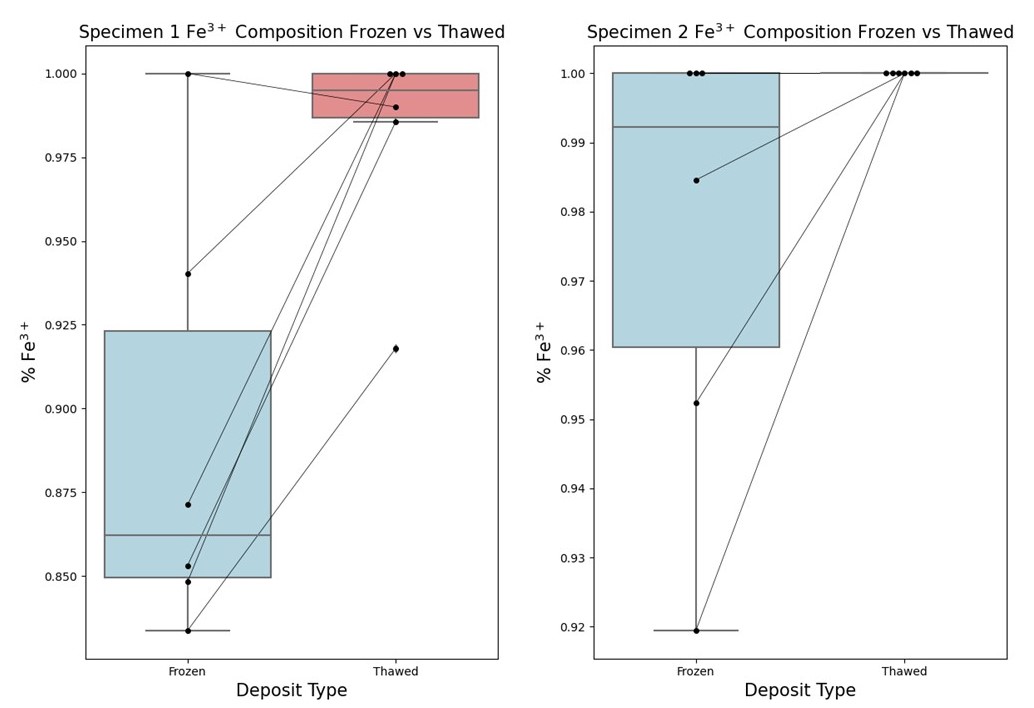
Figure 3.
Boxplots representing the calculated Fe3+ composition for each
specimen. Each point represents a single deposit.
DOI: https://doi.org/10.58530/2023/3329