3328
Brain NAA Reduction is Associated with Glucose Hypometabolism in Functional Networks of Alzheimer’s Disease: A Hybrid 3D-MRSI/FDG-PET Study1School of Biomedical Engineering, Shanghai Jiao Tong University, Shanghai, China, 2Department of Nuclear Medicine, Ruijin Hospital, Shanghai Jiao Tong University School of Medicine, Shanghai, China, 3Beckman Institute for Advanced Science and Technology, University of Illinois at Urbana-Champaign, Urbana, IL, United States, 4Department of Electrical and Computer Engineering, University of Illinois at Urbana-Champaign, Urbana, IL, United States, 5National Center for Supercomputing Applications, University of Illinois at Urbana-Champaign, Urbana, IL, United States, 6Department of Neurology and Institute of Neurology, Ruijin Hospital, Shanghai Jiao Tong University of Medicine, Shanghai, China
Synopsis
Keywords: Alzheimer's Disease, Alzheimer's Disease
Functional network failure has been implicated in the pathophysiology of Alzheimer’s disease (AD). FDG-PET is a well-established tool to map the glucose hypometabolism during AD progression. MRSI indexes the neuronal loss/astrogliosis noninvasively, but has been limited to single-voxel/slice techniques. Using a high-resolution 3D MRSI technique, we evaluated the neurometabolic changes in brain networks and compared them with glucose hypometabolism. Decreases in NAA and increases in mI were found in all networks. NAA reduction followed similar patterns to the hypometabolism over cognitive decline. Combined 3D MRSI and atrophy biomarkers showed comparable performance to FDG-PET in predicting cognitive decline in AD patients.Introduction
Cascading functional network failure has been implicated in the pathophysiology of Alzheimer’s disease (AD)1. Previous studies demonstrated that accumulation of amyloid-β preferentially started in the default mode network (DMN) and subsequently affected the other association networks, including the frontoparietal-control network (FPCN), dorsal attention network (DAN), and ventral attention network (VAN)2-4. These functional networks play significant roles in human cognitive functions5,6. Understanding the pathological changes underlying them in relation to the cognitive impairment in AD patients is of significance. FDG-PET is a well-established tool to map the glucose hypometabolism for early detection of disease progression in AD7,8, but with limited clinical access. MRSI is a potentially powerful tool for non-invasive measurement of neurometabolic changes, which directly indexes the neuronal loss/astrogliosis9 and provides important pathological biomarkers in AD. However, most studies were conducted using single-voxel/slice techniques and could not well capture the network-level distributions of neurometabolic changes. In this study, utilizing a recently developed high-resolution 3D MRSI technique known as SPICE (SPectroscopic Imaging by exploiting spatiospectral CorrElation)10,11, we evaluated the neurometabolic changes across DMN, FPCN, DAN, and VAN, in comparison with the simultaneously measured glucose metabolism using a hybrid PET/MR scanner. The relationship between the neuronal loss and glucose hypometabolism in these networks as well as their predictability in cognitive decline of AD patients were also investigated.Methods
Eighty-nine AD patients and 78 cognitive normal (CN) subjects participated in this study (Table 1). Cognitive performance was assessed by global clinical dementia rating (CDR)12 and Mini-Mental State Exam (MMSE) 13. 18F-FDG PET and MR images were acquired on a hybrid PET/MR system (Siemens Healthcare, Erlangen, Germany) in Ruijin Hospital, Shanghai, China. The MR scan protocols included 3D 1H-MRSI using the SPICE sequence (TR/TE = 160/1.6 ms, 2.0 × 3.0 × 3.0 mm3, FOV = 240 × 240 × 96 mm3), structural MR images using the 3D MPRAGE sequence (TR/TE = 1900/2.44 ms, FOV = 256 × 256 mm2, 0.5 × 0.5 × 1.0 mm3, number of slices = 192). The PET data were obtained at 40-60 min post a bolus injection of the 18F-FDG (mean dose of 207.8 MBq) (matrix size = 344 × 344 × 127, 2.1 × 2.1 × 2.0 mm3). Neurometabolites maps were obtained using the standard processing pipeline of SPICE10,11,14-16. The 18F-FDG PET standardized uptake value ratio (SUVR) values were calculated using the mean uptake of cerebellar gray matter as the reference.The DMN, DAN, VAN, and FPCN were defined by a standardized functional brain atlas17. All the networks were registered to the native space for further analysis. Mean SUVR, N-acetylaspartate (NAA), myoinositol (mI), creatine (Cr), and gray matter volume (GMV) were obtained for each network. For the group comparison between AD and CN subjects, ANCOVA analyses were used with age, sex, and education as covariates. The changes between SUVR, mI/Cr, NAA/Cr, and GMV over the MMSE score of AD patients were fitted using a sigmoidal 4-parameter logistic curve model. Using the multivariate linear regression model, we evaluated the performance of cognitive prediction for AD patients using multimodal imaging biomarkers.
Results and Discussion
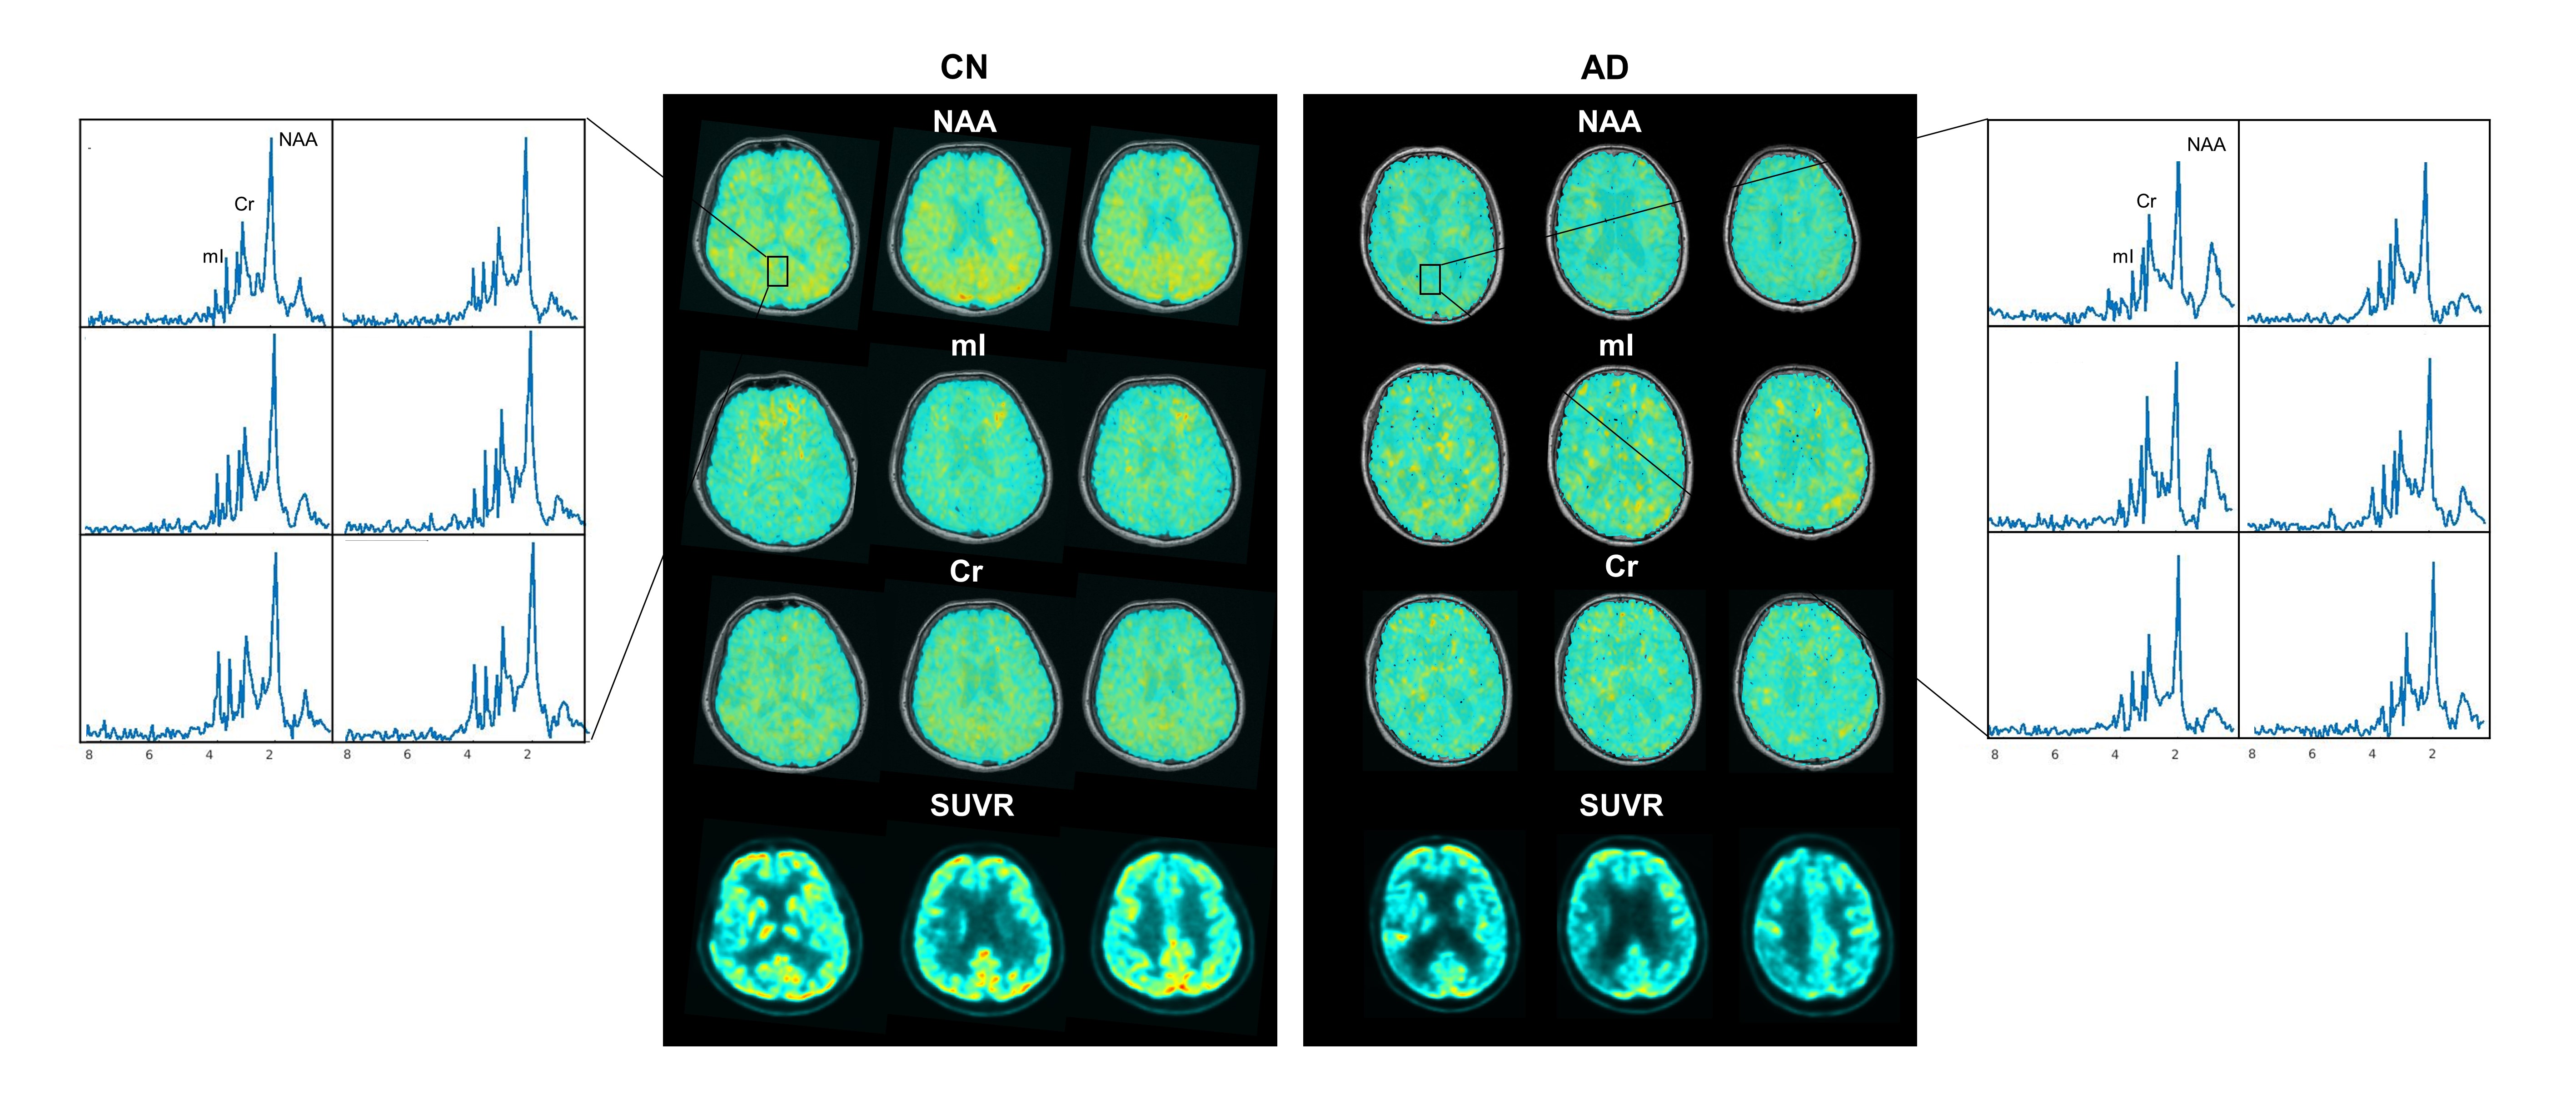
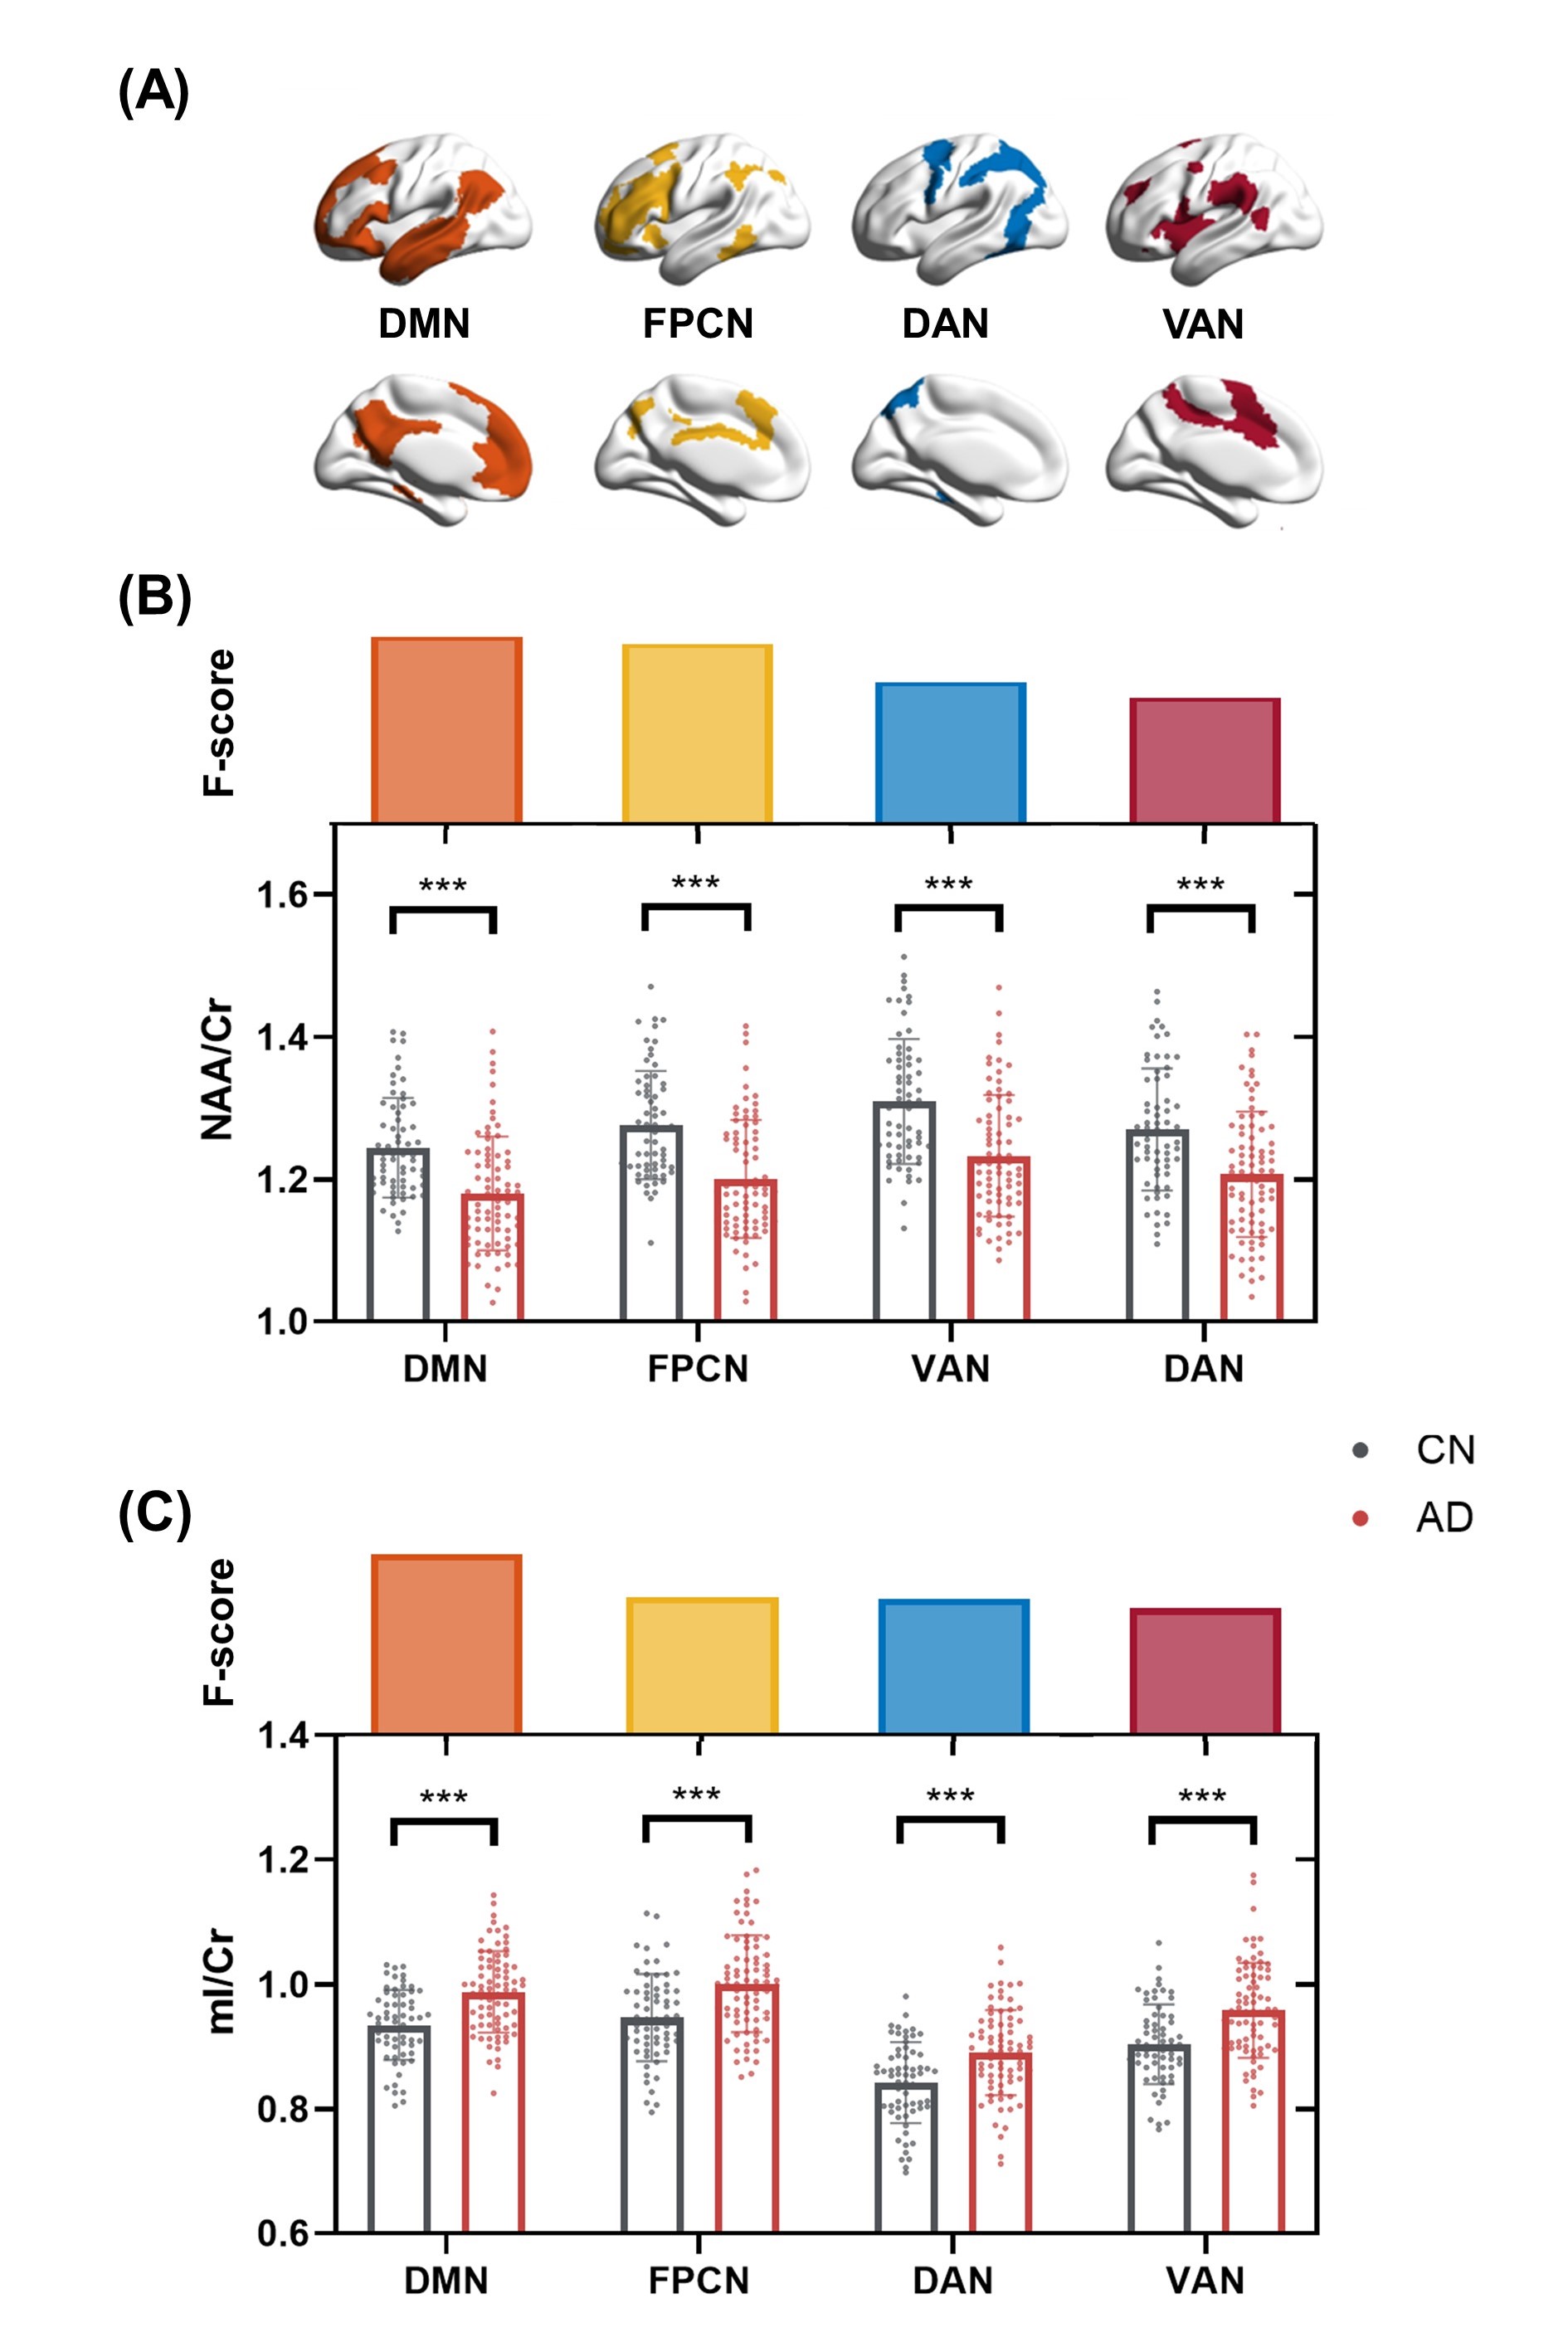
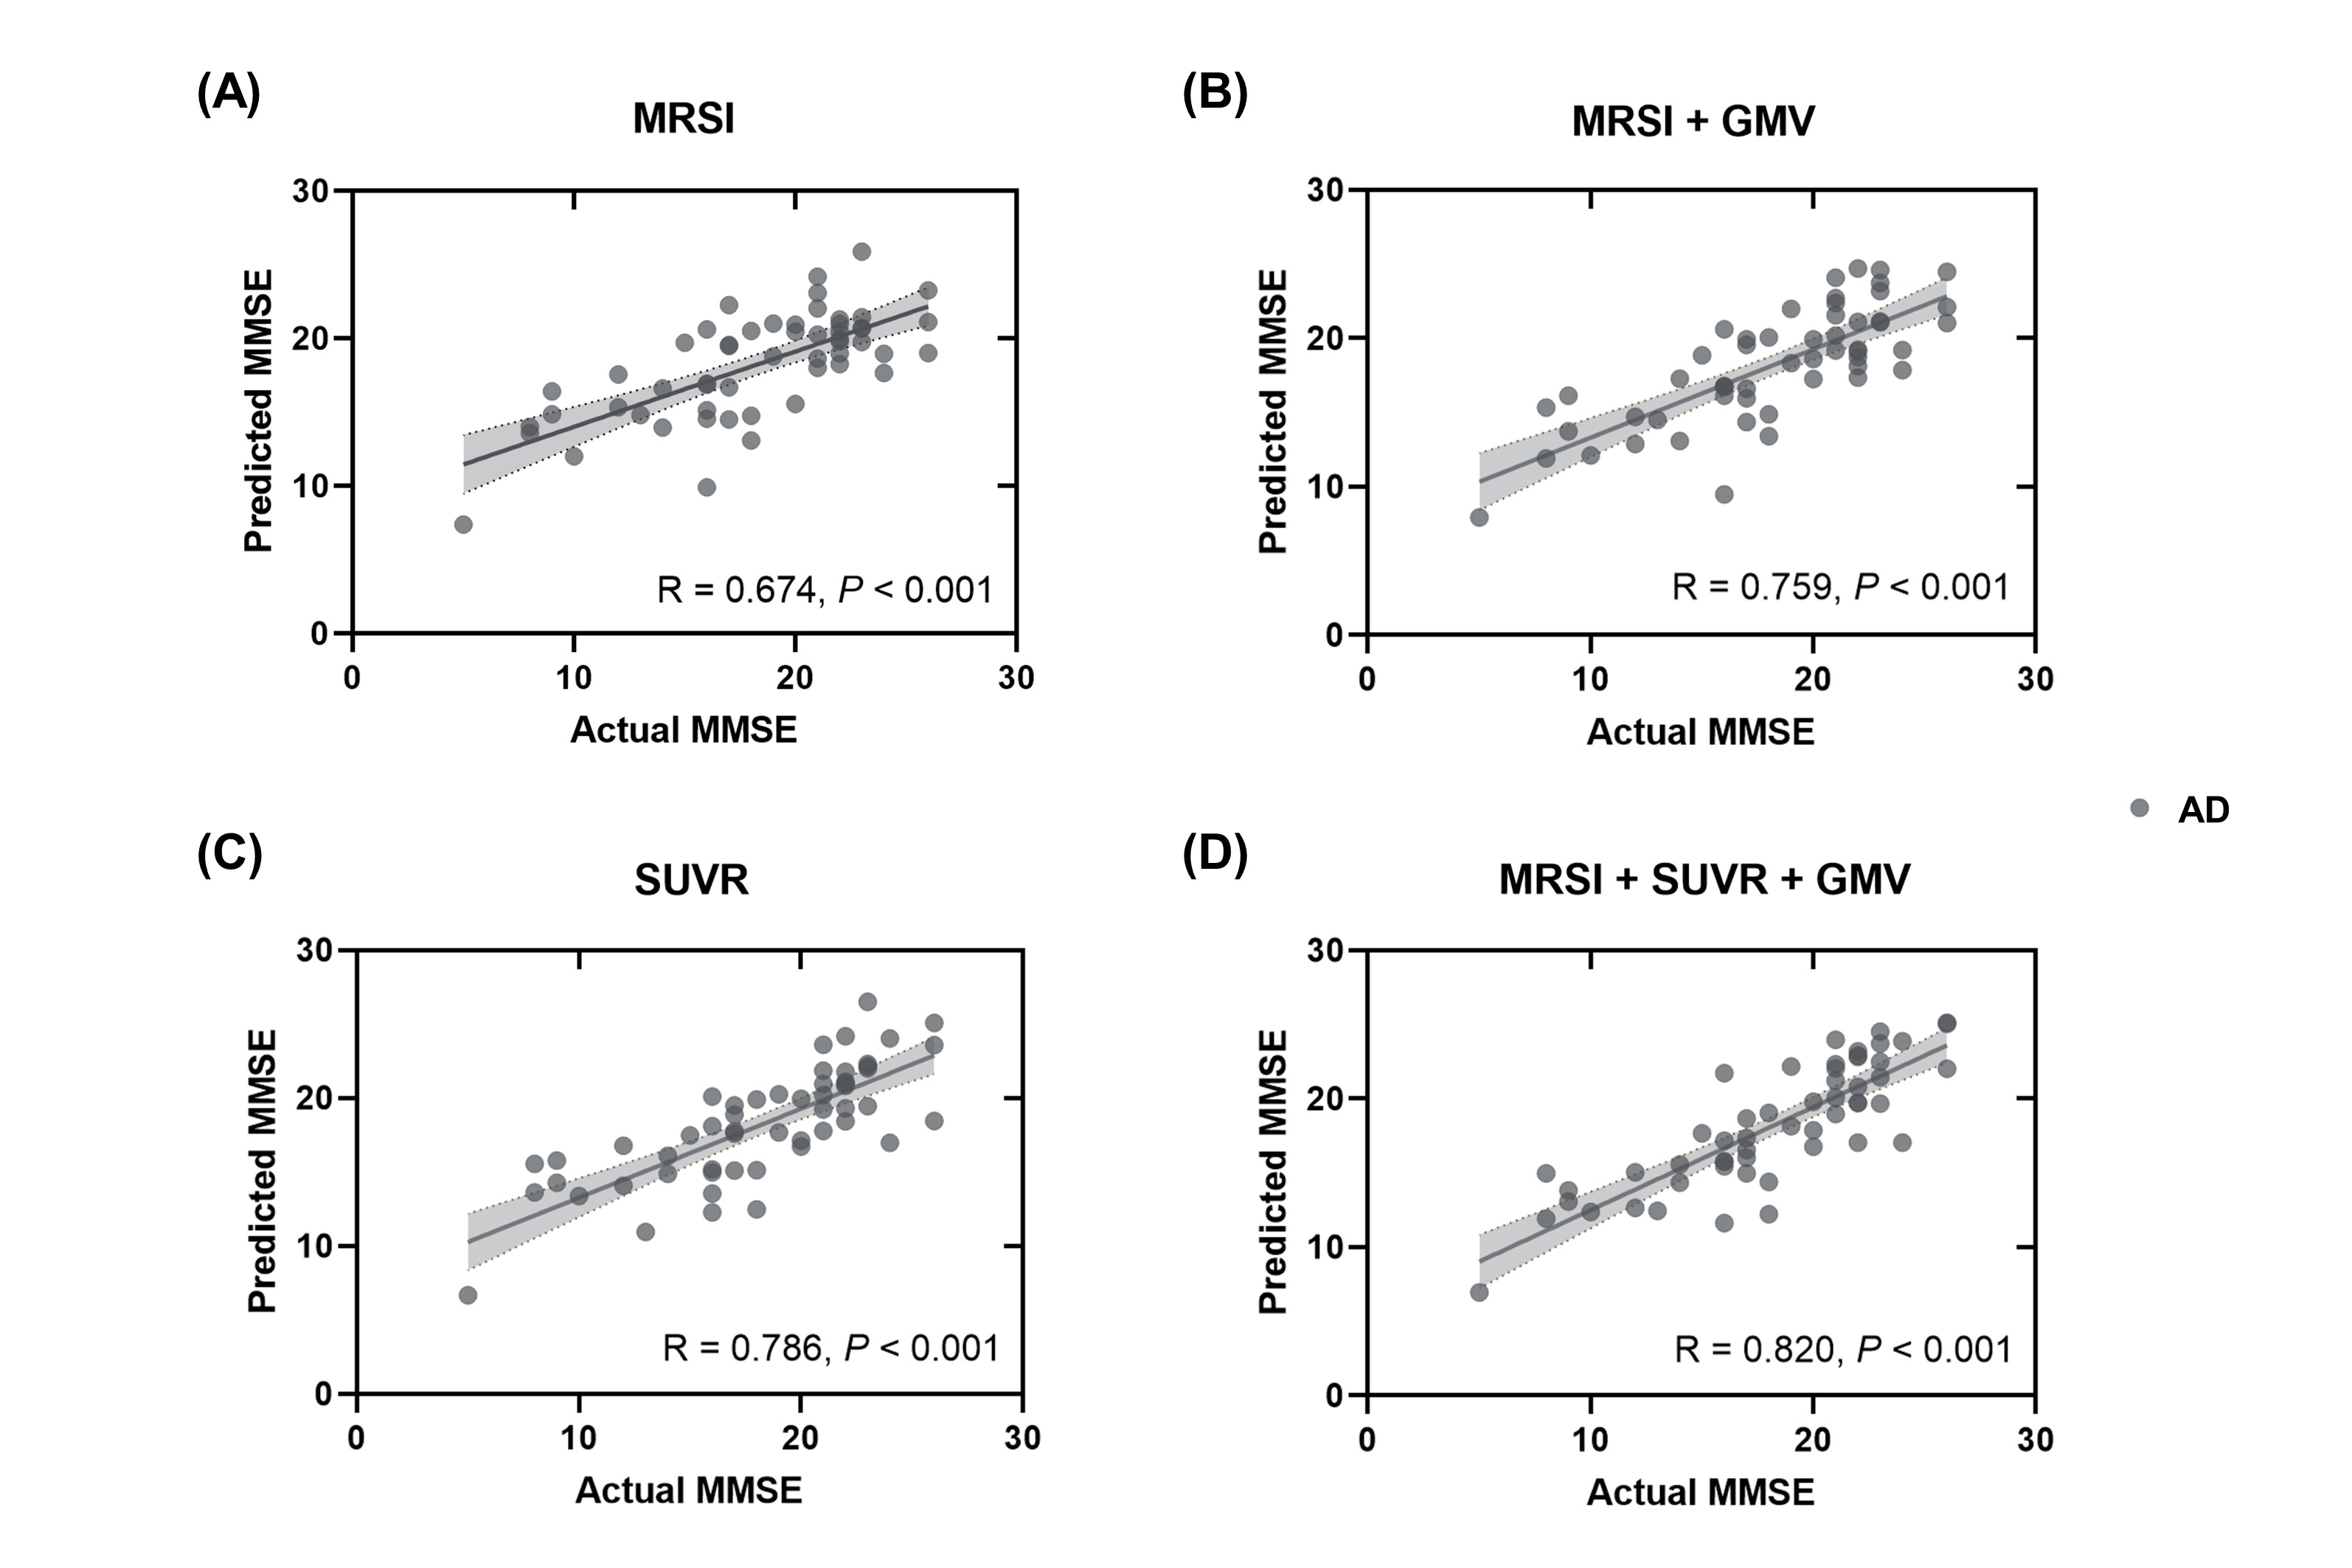
As shown in Table 1, the AD and CN groups were matched in age and sex. Figure 1 displays representative 3D NAA, mI, and 18F-FDG PET maps obtained in representative CN and AD subjects. Figure 2 shows group differences in the neurometabolites in the investigated brain networks. In AD patients, decreased NAA/Cr and increased mI/Cr were detected in all networks. The alterations were most prominent in the DMN, in line with the literature18,19. Figure 3 displays the changes of GMV, mean SUVR, and neurometabolites over cognitive decline within each network. As can be seen, the NAA/Cr and SUVR followed very similar patterns of variation with cognitive decline. Figure 4 shows the coupled relationship between NAA/Cr and SUVR across all networks for all subjects, with no correlations found between GMV and SUVR. These findings suggested that the aberrant energy metabolism (indicated by glucose hypometabolism) was correlated with neuronal loss (indicated by reduced NAA/Cr). Finally, combining MRSI and MRI atrophy biomarkers achieved comparable performance (R = 0.759) to 18F-FDG PET (R = 0.786) in predicting cognitive impairment, which could be further improved if combining all (R = 0.820), as shown in Figure 5.Conclusion
This study investigated the neurometabolic changes of the brain networks and their potential in predicting cognitive decline using high-resolution 3D MRSI, in comparison with 18F-FDG PET. Our results showed that the decrease in NAA followed very similar patterns to the glucose hypometabolism over cognitive decline in association networks of AD patients. Combined 3D MRSI and atrophy biomarkers showed comparable performance to FDG-PET in predicting cognitive decline in AD patients. This study may lay a foundation for further investigation of neurometabolic changes in brain networks using 3D MRSI for disease progression detection and for prediction of cognitive impairment in AD.Acknowledgements
This work is supported by Shanghai Pilot Program for Basic Research, Shanghai Jiao Tong University (21TQ1400203); the National Natural Science Foundation of China (81871083); and Key Program of Multidisciplinary Cross Research Foundation of Shanghai Jiao Tong University (YG2021ZD28, YG2022QN035, YG2021QN40).References
1. Jones DT, Knopman DS, Gunter JL, et al. Cascading network failure across the Alzheimer’s disease spectrum. Brain. 2016;139(2):547–62.
2. Palmqvist S, Schöll M, Strandberg O, et al. Earliest accumulation of β-amyloid occurs within the default-mode network and concurrently affects brain connectivity. Nat Commun. 2017;8(1):1214.
3. Agosta F, Pievani M, Geroldi C, et al. Resting state fMRI in Alzheimer’s disease: Beyond the default mode network. Neurobiol Aging. 2012;33(8):1564–78.
4. Brier MR, Thomas JB, Snyder AZ, et al. Loss of intranetwork and internetwork resting state functional connections with Alzheimer’s disease progression. Journal of Neuroscience. 2012;32(26):8890–9.
5. Sheline YI, Raichle ME. Resting state functional connectivity in preclinical Alzheimer’s disease. Biological Psychiatry. 2013;74(5):340–7.
6. Bullmore E, Sporns O. The economy of brain network organization. Nat Rev Neurosci. 2012;13(5):336–49.
7. Teipel S, Drzezga A, Grothe MJ, et al. Multimodal imaging in Alzheimer’s disease: Validity and usefulness for early detection. The Lancet Neurology. 2015;14(10):1037–53.
8. Grothe MJ, Teipel SJ. Spatial patterns of atrophy, hypometabolism, and amyloid deposition in Alzheimer’s disease correspond to dissociable functional brain networks. Human Brain Mapping. 2016;37(1):35–53.
9. Murray ME, Przybelski SA, Lesnick TG, et al. Early Alzheimer’s disease neuropathology detected by proton MR spectroscopy. J Neurosci. 2014;34(49):16247–55.
10. Lam F, Liang Z-P. A subspace approach to high-resolution spectroscopic imaging. Magn Reson Med. 2014;71(4):1349–57.
11. Ma C, Lam F, Johnson CL, et al. Removal of nuisance signals from limited and sparse 1H MRSI data using a union-of-subspaces model. Magn Reson Med. 2016;75(2):488–97.
12. Morris JC. The Clinical Dementia Rating (CDR): Current version and scoring rules. Neurology. 1993;43(11):2412–4.
13. Folstein MF, Folstein SE, McHugh PR. “Mini-mental state”. A practical method for grading the cognitive state of patients for the clinician. J Psychiatr Res. 1975;12(3):189–98.
14. Lam F, Ma C, Clifford B, et al. High-resolution 1H-MRSI of the brain using SPICE: Data acquisition and image reconstruction. Magn Reson Med. 2016;76(4):1059–70.
15. Li Y, Lam F, Clifford B, et al. A subspace approach to spectral quantification for MR spectroscopic imaging. IEEE Trans Biomed Eng. 2017;64(10):2486–9.
16. Lam F, Li Y, Guo R, et al. Ultrafast magnetic resonance spectroscopic imaging using SPICE with learned subspaces. Magn Reson Med. 2020;83(2), 377–90.
17. Thomas Yeo BT, Krienen FM, Sepulcre J, et al. The organization of the human cerebral cortex estimated by intrinsic functional connectivity. J Neurophysiol. 2011;106(3):1125–65.
18. Kantarci K, Jack CR, Xu YC, et al. Regional metabolic patterns in mild cognitive impairment and Alzheimer’s disease: A 1H MRS study. Neurology. 2000;55(2):210–7.
19. Griffith HR, den Hollander JA, Okonkwo OC, et al. Brain metabolism differs in Alzheimer’s disease and Parkinson’s disease dementia. Alzheimers Dement. 2008;4(6):421–7.
Figures