3326
3D-MRSI using co-polarized HP [1-13C]pyruvate and [1-13C]dehydroascorbate to study a mouse model of Alzheimer's disease1Radiology, Memoral Sloan Kettering Cancer Center, New York, NY, United States, 2Chemical Biology Program, Memoral Sloan Kettering Cancer Center, New York, NY, United States
Synopsis
Keywords: Alzheimer's Disease, Alzheimer's Disease, animal model, 13C HP MRI
Alzheimer’s disease (AD) is devastating and progressive disease. The non-invasive detection of early onset AD along with the mechanisms that drive its progression are still limited. Recent work has implicated metabolic reprogramming as an earlier AD potential indicator. Therefore, we investigated an AD mouse model at the early stage of development with the goal to evaluate whether co-hyperpolarized [1-13C]pyruvate and [1-13C]dehydroascorbate (DHA) along with 3D MRSI might provide insights into the brain metabolism of FAD mice at the onset of the disease. The metabolism of these translatable biomarkers would then give insight on our understanding of AD diagnosis and treatment.Introduction
Alzheimer’s disease (AD) is a devastating disease. The non-invasive detection of the early onset of the disease along with the mechanisms that drive its progression are currently limited. Metabolic reprogramming has been recently suggested1,2 as an earlier AD potential indicator.Therefore, we utilized an AD mouse model (5xFAD)3 at the early stage of development with the goal to evaluate whether co-hyperpolarized [1-13C]pyruvate and [1-13C]dehydroascorbate (DHA) along with 3D Magnetic Resonance Spectroscopic Imaging (MRSI)4-7 might provide insights into the brain metabolism of 5XFAD mice at the onset of the disease. The metabolism of these potentially translatable biomarkers might then change our understanding of AD diagnosis and treatment.
Methods
Six females 5xFAD and six C57Bl/6J wild-type mice, aged 4-months were used. Following tail vein cannulation, each mouse was injected over 10s with 200μL of co-hyperpolarized 40mM [1-13C]DHA and 100mM [1-13C]Pyruvate. Both substrates were co-hyperpolarized for two hours (150µL of a 40:60 v/v mixture of monomeric [1-13C]DHA and [1-13C]PA containing 15mM AH111501 trityl radical) through the SpinLab polarizer and dissolved in 13ml D2O. The sample was subsequently collected in a flask containing an equimolar amount of sodium acetate to neutralize the pyruvic acid. MR-experiments were performed using a 3T Bruker MR system equipped with a quadrature double-tuned 1H/13C volume coil. The MRI protocol included a T2-weighted fast-spin-echo sequence for anatomical reference and a multi-slice 13C 2D-Echo-Planar-Spectroscopic-Imaging (EPSI) sequence (TR/TE = 900/3.5ms, 32x32 mm2 of field-of-view, 6 slices of 3.5mm thickness), which is run 25s after injection, simultaneously with the effect of the substrate in the brain. Both sequences were repeated for the reference scan (6M 13C-urea phantom). Spectroscopic data were analyzed using a custom Matlab script and metabolic maps calculated through SIVIC8. Differences between gray (Thalamus, THA) and white matter (Corpus Callosum, CC) of 5xFAD and control mice were evaluated through a region-of-interest (ROI)-based analysis. Statistical analysis was performed using GraphPadPrism. Following MRI, animals were sacrificed, excised brains snap-frozen in isopentane and sections (10um-thick) stained with H&E, thioflavin or prepared for MALDI imaging.Results
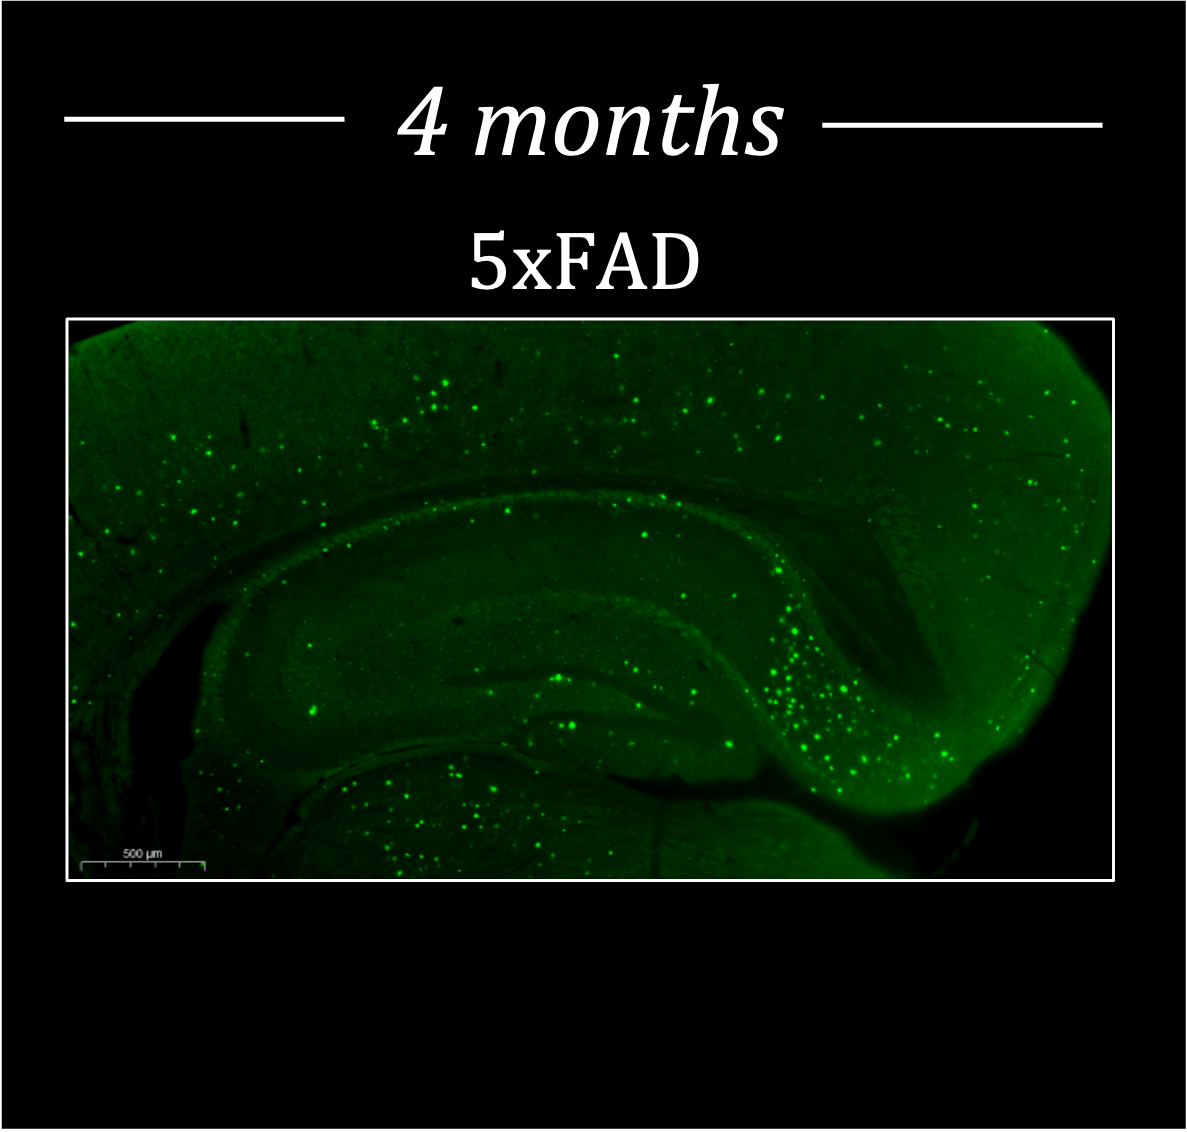
It is noteworthy that before 9 months most methods can not detect AD non-invasively in the 5xFAD model and the model results in behavioral changes at 12 months. Figure 1 shows representative data reconstructed in coronal (A), axial (B) and sagittal (C) views of a mouse brain (upper panel) with the corresponding 13C spectra acquired in each voxel of the brain (lower panel). A representative spectrum from a voxel of the overlayed grid on the brain showing the main metabolites is reported in Figure 1D. After the probe injection, both pyruvate and DHA are rapidly metabolized and the lactate and vitamin C products predominantly generated. The overlay of representative metabolite maps (Figure 2), pyruvate (2A, upper panel) and lactate (2A, lower panel), and DHA (2B, upper panel) and Vitamin C (2B, lower panel), on the anatomical proton image demonstrates the differential lactate and vitamin C generation, respectively. Figure 3 shows the comparison between the hyperpolarized pyruvate, lactate, DHA and vitamin C levels, determined in the two brain regions of 4-month-old 5xFAD (Figure 3A-B) and age-matched wild-type mice (Figure 3B-C, 3E-F). Compared with wild-type mice, pyruvate and lactate levels were significantly higher in 5xFAD than control mice (n=6, P<0.001; A, B) in both brain regions while DHA level was lower in the CC region (n=6, P <0.01; D). No differences were found between 5xFAD and control mice in the Lactate/Pyruvate ratios (C) while Vitamin C/DHA ratio was higher in in the CC region (n=6, P <0.01; F) for FAD mice. Moreover, pyruvate levels were found higher in the THA than CC region for both FAD and control mice (n=6, P<0.05: A), while Lactate and DHA levels were found significantly higher in the THA than CC regions respectively in in the control (n=6, P<0.05: B) and 5xFAD mice (n=6, P<0.05: B). Histological section of a 4-month-old 5XFAD mouse showing amyloid pathology is reported in Figure 4.Discussion and Conclusion
Our findings show the feasibility of this novel methodology to reveal differences in the compartmentalized metabolism of both diseased and healthy animals. We observed significant differences in pyruvate, lactate and DHA in the thalamus and corpus callosum of 5xFAD and control mice at 4 months, suggesting the potential of this methodology to investigate the onset of the AD disease. In addition, this work suggests differential redox compartmentalization in the two investigated regions of both FAD and control mice due to the NAD-dependent mediated metabolism for hyperpolarized lactate and NADPH for vitamin C.Acknowledgements
No acknowledgement found.References
1. Batra R, Arnold M, Wörheide MA et al. The landscape of metabolic brain alterations in Alzheimer’s disease. Alzheimers Dement. 2022; doi: 10.1002/alz.12714.2.
2. Baik SH, Kang S, Lee W et al. A Breakdown in Metabolic Reprogramming Causes Microglia Dysfunction in Alzheimer's Disease. Cell Metabolism. 2019; 30(3): 493-507.3.
3. Oakey H et al 2006 J Neurosci 26(40): 10129- 10140 4.
4. Keshari KR, Kurhanewicz J, Bok R et al. (2011). Hyperpolarized 13C dehydroascorbate as an endogenous redox sensor for in vivo metabolic imaging. PNAS. 2011; 150(46): 18606-18611.
5. Bohndiek SE, Kettunen MI, Hu D et al. Hyperpolarized [1-13C]-ascorbic and dehydroascorbic acid: vitamin C as a probe for imaging redox status in vivo. JACS. 2011; 133(30): 11795-11801. 6.
6. Timm KN, Hu D, Williams M et al. Assessing oxidative stress in tumors by measuring the rate of hyperpolarized [1-13]dehydroascorbic acid reduction using 13C magnetic resonance spectroscopy. Journal of Biological Chemistry. 2017; 292(5): 1737-1748. 7
7. Qin H, Carroll VN, Sriram R et al. Imaging glutathione depletion in the rat brain using ascorbate-derived hyperpolarized MR and PET probes. Scientific Reports. 2018; 8: 7928.
8. Crane JC, Olson MP, Nelson S. SIVIC: Open-Source, Standards-Based Software for DICOM MR Spectroscopy Workflows. Int J. Biomed Imaging, 2013: 169526.
Figures
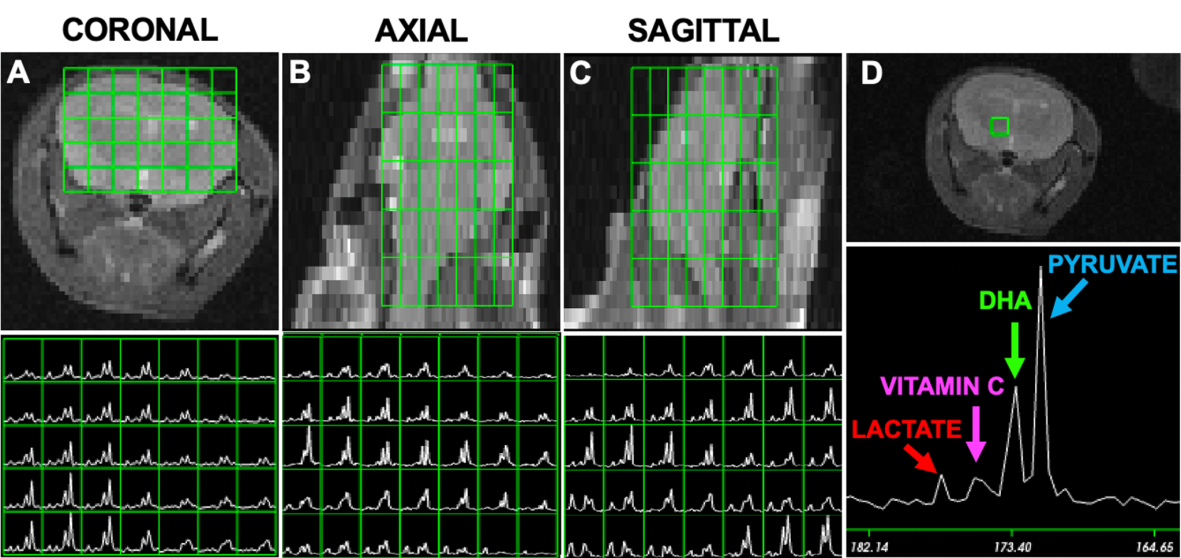
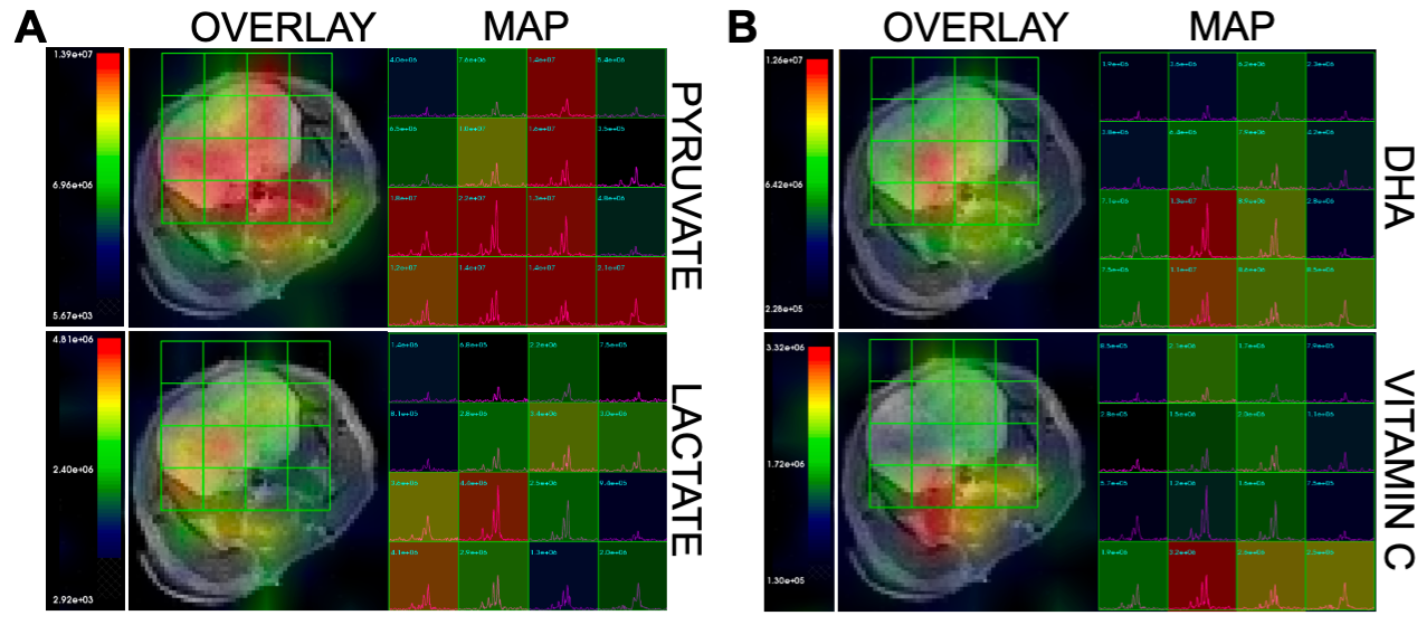
Figure 3: Graphs showing the comparison between 13C HP metabolite levels measured in the thalamus (THA) and corpus callosum (CC) reagins of 4-month-old 5xFAD mice and their aged matched control. each metabolite in the two brain regions of each mouse. A, B, D, E: Graphs showing the comparison levels of each metabolite in the two brain regions of 5xFAD and wild-type mice. C, F: Graphs showing the comparison between product / substrate ratios in both mouse brain regions of each mouse.