3324
Hippocampal subfield volume in relation to cerebrospinal fluid Amyloidß and cognitive assessments in early Alzheimer’s disease: a 7T MRI study1University of Nottingham, Nottingham, United Kingdom, 2Physics, University of Abuja, Abuja, Nigeria, 3Nottingham University Hospital, Nottingham, United Kingdom
Synopsis
Keywords: Alzheimer's Disease, Alzheimer's Disease, High-Field MRI, Quantitative Susceptibility Mapping, Segematation
Providing a non-invasive biomarker for the diagnosis of AD has been challenging. In this study 25 participants (12 AD and 13 healthy controls) were scanned on a 7T MRI scanner. Cognitive assessments and analysis of the CSF for Amyloidb1-42 performed by trained Clinicians. The volume of the hippocampal subregion shows a linear relationship CSF- Amyloidb1-42 for all the subfield of the hippocampus, but this trend was only significant for the ERC with p=0.023. The association of the volume of ERC and CSF-amyloid-beta(1-42) suggests the potential for using high field-high resolution MRI as a biomarker for an early identification of AD.BODY
AD is a protein-conformational disease that is accompanied by a progressive neurodegeneration, the presence of neurofibrillary tangles and the accumulation of amyloid plagues.1. Amyloidβ, tau-pathology and neurodegeneration (ATN categories) have been use to classify AD into stages. 2,3,4. Amyloidβ and tau-pathology measurement in the cerebrospinal fluid (CSF) via lumbar puncture or Amyloid-PET provide the highest sensitivity and specificity for the diagnosis of AD. However these are invasive or expensive. The hippocampus plays a crucial role in memory, and it atrophy correlates with the severity and progression of AD. 7T MRI can provide high contrast and spatial resolution images for studying changes in the volume and magnetic susceptibility of the hippocampal subfields. We aimed to determine whether this may provide an alternative marker of AD.METHODS
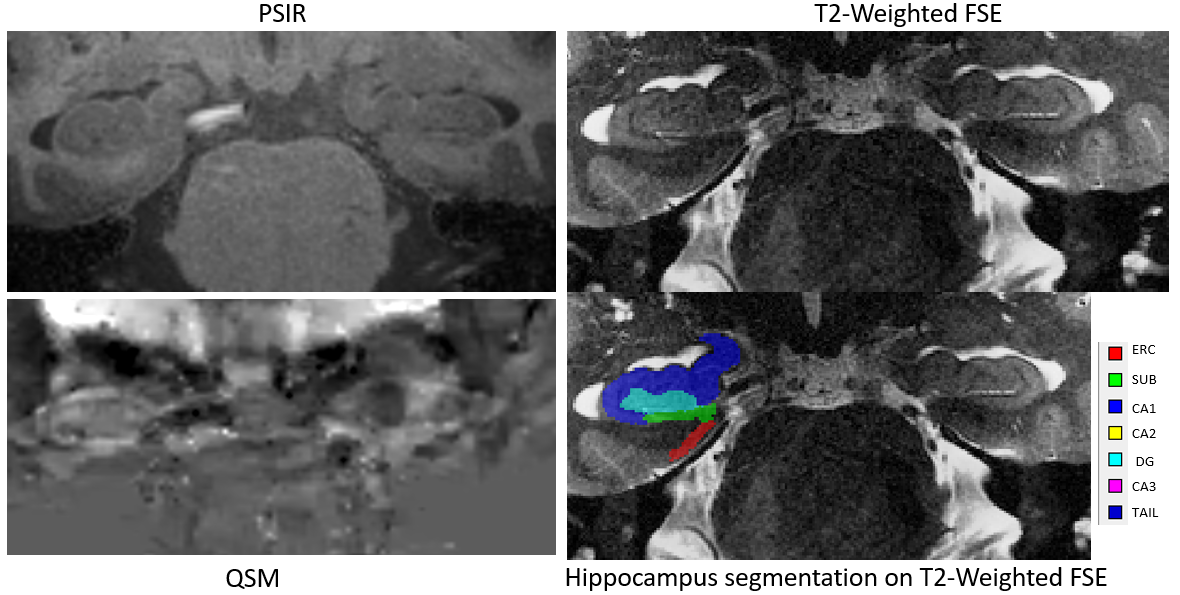
25 participants (12 AD patients who fulfilled ATN Criteria versus 13 age and sex-matched healthy controls) aged 40 and 74 years at the time of the MRI. The protocol for the analysis of the CSF for the Amyloid beta1-42 (reference range: 627 – 1322 pg/ml), have been previously published 5 and the measures were used for the ATN classification of Alzheimer’s disease. Time from CSF Amyloidb1-42 to MRI ranged between 2 - 12 months. Cognitive assessments included Montreal Cognitive Assessment MoCA), performed by trained Clinical Psychologists. Imaging was carried out on a Philips Achieva 7T scanner using a Nova Medical (Wilmington MA, USA) single-channel transmit, 32-channel receive (1Tx32Rx) head coil. The sequences are: single-echo gradient echo (TE/TR=20/31ms; FA=15o, 0.7x0.7x0.7 mm3 resolution), PSIR (TE/TR=3.1/6.9ms; FA=6o, isotropic 0.55 mm resolution) and T2-weighted FSE (TE/TR=119/59001ms, FA=90o, 0.38x0.39x1.50 mm3 resolution) sequences. Susceptibility maps of the brain were created from the GE data using the multi-scale Dipole inversion (MSDI) available in the QSMbox v2.0 for single-echo, coil-combined data 6. Hippocampal segmentation was performed the ASHS software7 applied to the PSIR and T2-weighted images simultaneously8, to delineate ROIs over the Cornu ammonis (CA) areas ( CA1, CA2 and CA3), hippocampal tail (TAIL), dentate gyrus (DG), subiculum (SUB) and entorhinal cortex (ERC) (Fig 1). The CA2 and CA3 regions were too small to produce reliable susceptibility values and were at risk of inaccurate labelling, so CA1-3 values were combined into a single CA ROI for further analysis.
RESULTS
Figure 1 shows example PSIR and T2-weighted images, along with corresponding QSM data with the hippocampus segmentation from ASHS overlaid. Scans from two patients with AD had to be excluded from the analysis due to motion artefacts.
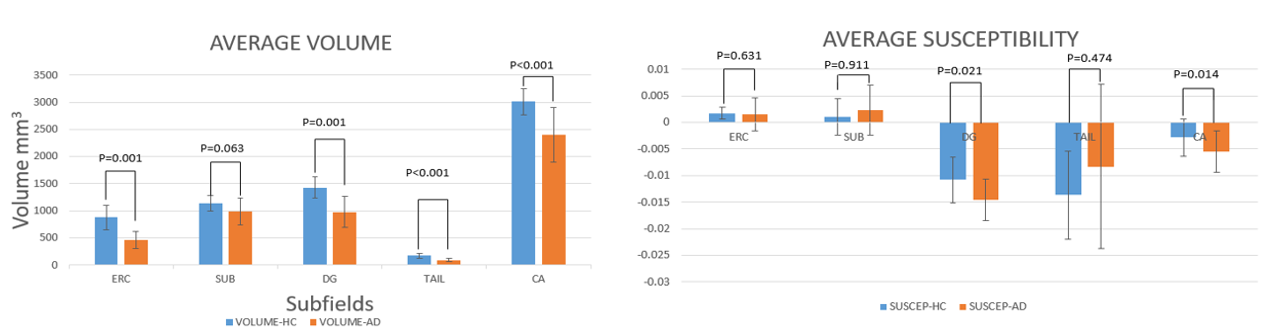
Figure 2 shows the average volumes and susceptibility for all hippocampal subregions for AD patients and HC. The most notable differences in volume for were found in the ERC, CA, TAIL and DG where the volume change between HC and AD was above 450 mm3 in ERC, DG and CA with p-value << 0.01 in the CA, TAIL and < 0.01 in the DG and ERC. For the susceptibility, a statistically significant was only observed in DG and CA with p < 0.05.
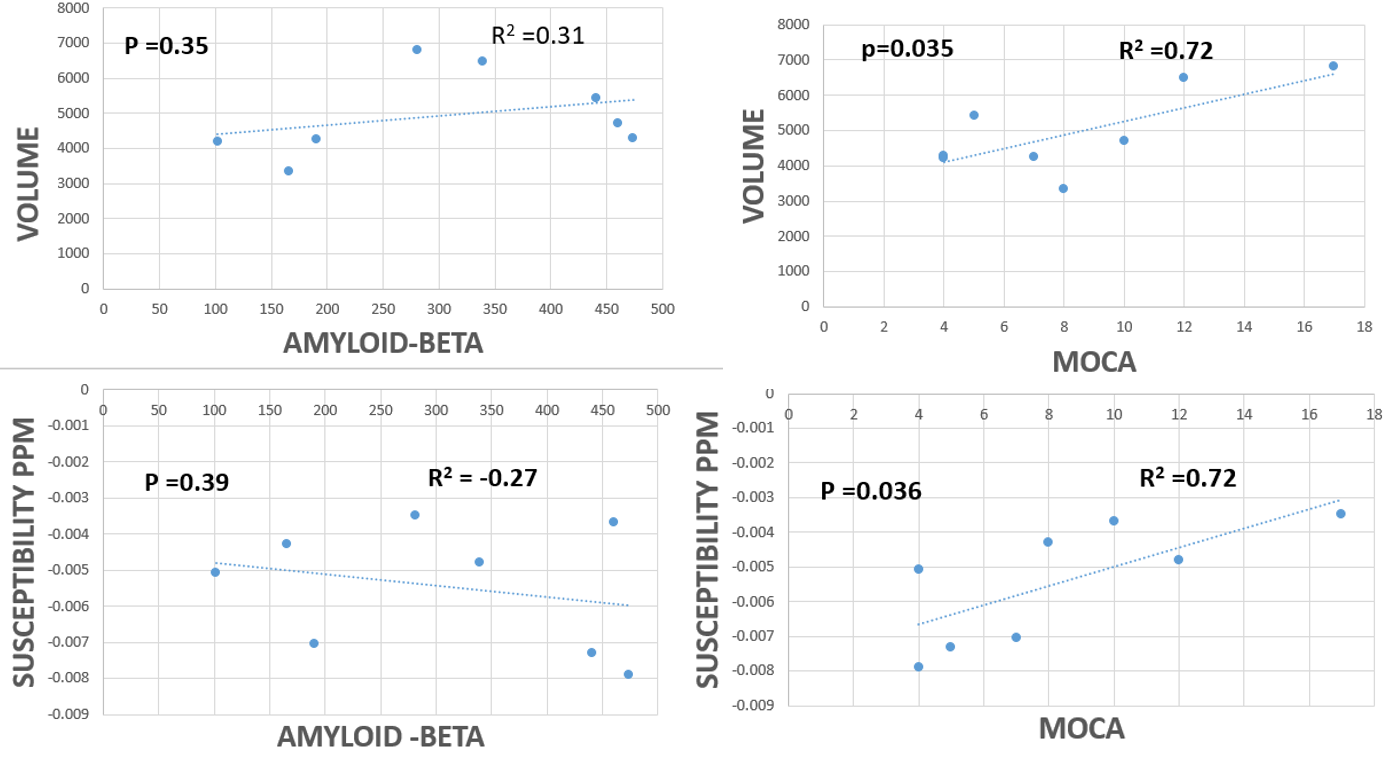
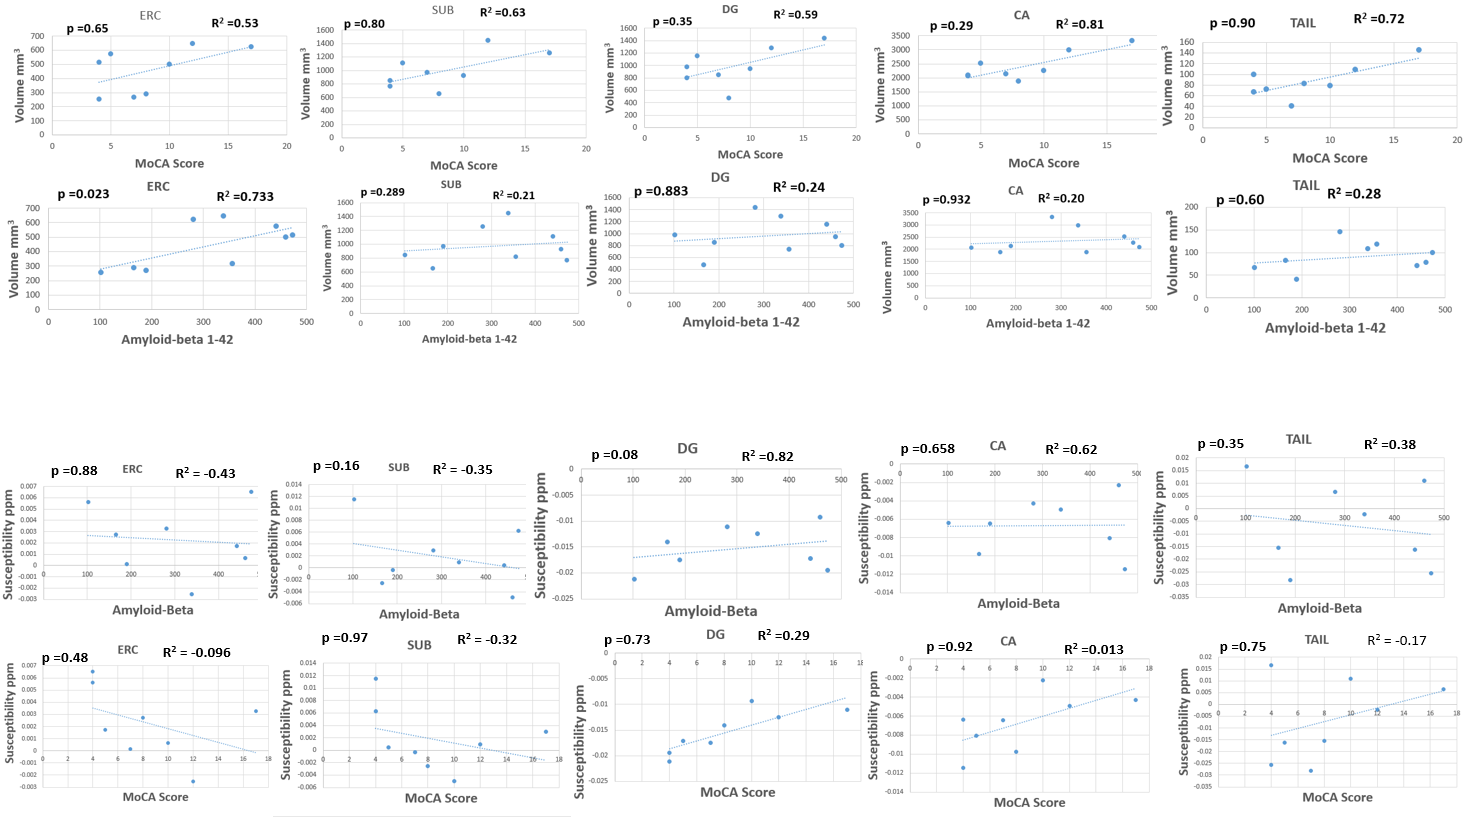
Figure 3 shows scatter plots of the volume and susceptibility of the whole hippocampus plotted against MOCA score and CSF-amyloid-beta(1-42) . Figure 4 shows similar graphs plotted for each hippocampal subfield. It was found that that volume decreased with decreasing MOCA score and decreasing value of CSF-amyloid-beta(1-42) (levels <627 pg/ml used as a diagnostic cut off for the diagnosis of AD9) as expected. All regions (for the volume) showed an R2 ≥ 0.2 but the ERC (R2= 0.657) was the only region in which the trend reached significance in p=0.023. There was also a linear relationship between the measured susceptibility and MOCA score and indeed CSF-amyloid-beta(1-42). There was also a strong correlation between susceptibility of the whole hippocampus and the MOCA score with R2 =0.72 and p=0.036, but the CSF-amyloid-beta(1-42) did not trend in the direction expected and the behaviour was not consistent between subfields with none attaining a significant p-value.
DISCUSSION
The volumes of the hippocampal subfields measured in this study are similar to those reported previously by Yushkevich et al 10. The volumes of all hippocampal subfields were found to be significantly decreased in AD compared to HC except for the SUB field where the change did not show statistical significance. Figure 3 and 4 shows that the volume of the hippocampal subregion tends to be associated with cognitive scores and the value of the CSF-amyloid-beta(1-42) for all the subfields of the hippocampus, but this trend was only significant for the ERC with p=0.023. The sample size is small and there are many comparisons have been made, so this study needs to be repeated in a larger cohort. In this study we found the largest decrease in volume and the largest association between volume and CSF-amyloid-beta(1-42). to be in the Entorhinal Cortex (ERC) which is the region responsible for memory, navigation and perception of time 1112. In 1993 Braak 13 found evidence that early AD pathology may start in the ERC before migrating to the hippocampus.
CONCLUSION
The association of the volume of ERC and CSF-amyloid-beta(1-42) suggests the potential for using high field-high resolution MRI as a biomarker for an early identification of AD, though a larger sample size is needed to verify these results.
Acknowledgements
Funding and disclosure: The study is funded by the Medical Research Council (UK) through a personal award to AAH (grant MR/T005580/1); ClinicalTrials.gov Identifier: NCT04992975References
1. Tiwari S, Venkata A, Kaushik A, Adriana Y, Nair M. Alzheimer ’ s Disease Diagnostics And Therapeutics Market. Int J Nanomedicine . 2019;Jul 2019(14):5541-5554.
2. Kurt A J. Towards a Biological Definition of Alzheimer Disease. Int J Neurol Neurother. 2018;7(1):535-562. doi:10.23937/2378-3001/1410095
3. Grøntvedt GR, Lauridsen C, Berge G, et al. The Amyloid, Tau, and Neurodegeneration (A/T/N) Classification Applied to a Clinical Research Cohort with Long-Term Follow-Up. J Alzheimer’s Dis. 2020;74(3):829-837. doi:10.3233/JAD-191227
4. Jack CR, Bennett DA, Blennow K, et al. NIA-AA Research Framework: Toward a biological definition of Alzheimer’s disease. Alzheimer’s Dement. 2018;14(4):535-562. doi:10.1016/j.jalz.2018.02.018 5. Hosseini A et al. Clinical Utility of Cerebrospinal Fluid Aβ42 and Tau Measures in Diagnosing Mild Cognitive Impairment in Early Onset Dementia. J Alzheimer’s Dis. 2022;87(2):771-778.
6. Acosta-Cabronero J, Milovic C, Mattern H, Tejos C, Speck O, Callaghan MF. A robust multi-scale approach to quantitative susceptibility mapping. Neuroimage. 2018;183:7-24. doi:10.1016/j.neuroimage.2018.07.065
7. Yushkevich PA, Pluta JB, Wang H, et al. Automated volumetry and regional thickness analysis of hippocampal subfields and medial temporal cortical structures in mild cognitive impairment. Hum Brain Mapp. 2015;36(1):258-287. doi:10.1002/hbm.22627
8. Wisse LEM, Kuijf HJ, Honingh AM, et al. Automated hippocampal subfield segmentation at 7T MRI. Am J Neuroradiol. 2016;37(6):1050-1057. doi:10.3174/ajnr.A4659
9. Niels Andreasen MCHPD. Cerebrospinal Fluid  -Amyloid (1-42) in Alzheimer Disease. 2015;56(June 1999):673-680.
10. Yushkevich PA, Pluta JB, Wang H, et al. Automated volumetry and regional thickness analysis of hippocampal subfields and medial temporal cortical structures in mild cognitive impairment. Hum Brain Mapp. 2015;36(1):258-287. doi:10.1002/hbm.22627
11. Tsao A, Sugar J, Lu L, et al. Integrating time from experience in the lateral entorhinal cortex. Nature. 2018;561(7721):57-62. doi:10.1038/s41586-018-0459-6
12. Du AT, Schuv N, Amend D, et al. Magnetic resonance imaging of the entorhinal cortex and hippocampus in mild cognitive impairment and Alzheimer’s disease. J Neurol Neurosurg Psychiatry. 2001;71:441-447. doi:10.1136/jnnp.71.4.441
13. Braak H, Braak E. Staging of Alzheimer-Related Cortical Destruction. Int Psychogeriatrics. 1997;9(S1):257-261. doi:10.1017/S1041610297004973
Figures