3323
Multivariate data-driven approach to dissect imaging-genetic associations in Alzheimer’s disease1Lou Ruvo Center for Brain Health, Cleveland Clinic, Las Vegas, NV, United States
Synopsis
Keywords: Alzheimer's Disease, Alzheimer's Disease, Imaging genetics
To better characterize the Alzheimer’s disease pathogenesis and boost the statistical power, we applied a multivariate data-driven approach (independent component analysis (ICA)) to decompose 70000+ single nucleotide variants (SNVs) from 239 AD-associated genes into multiple functionally relevant subsets. We demonstrated that several genetic clusters identified by ICA could be specially associated with AD clinical diagnosis, AD amyloid or tau pathology, and/or MRI-derived neurodegenerative markers. This type of multivariate data-driven approach could be helpful to further delineate diagnoses-associated or neuropathology-associated genetic variants in AD.Backgrounds
In the past 20 years, genome wide association studies (GWAS) and brain imaging analyses have identified various genetic risk variants and brain differences between Alzheimer’s disease (AD) and cognitively normal (CN) subjects from unprecedented large samples1–3. Besides diagnosed AD cases, the most recent GWAS also included ‘proxy’ AD cases to further boost the statistical power of the univariate GWAS4. However, given the heterogeneous and complex nature of AD, further delineations of neuropathology-associated and diagnosis-associated genetic variants and imaging biomarkers are needed to better characterize the AD pathogenesis. Multivariate data-driven approaches might be promising to better dissect the AD genetic architecture, boost the statistical power of genetic variants, and improve the understanding of AD pathophysiology5. In this study, we applied an independent component analysis (ICA) to genetic variants from AD-associated genes, and demonstrated that several genetic clusters identified by ICA could be specific to AD pathology and/or MRI-derived neurodegenerative markers.Methods
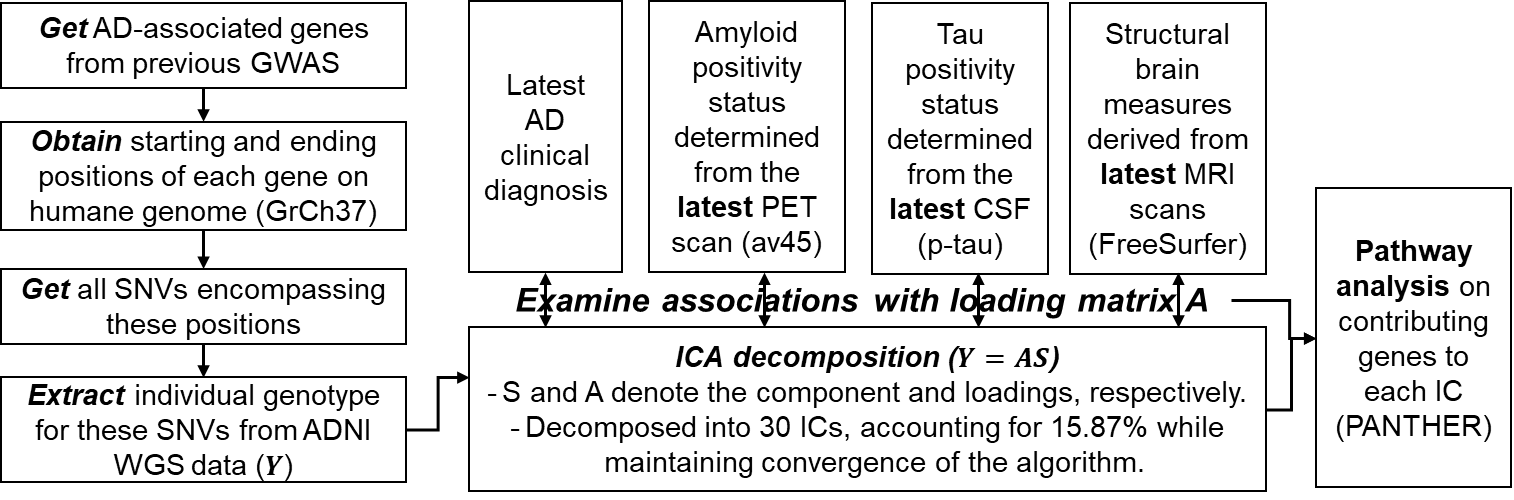
Fig. 1 shows the detailed analysis pipeline. Briefly, 808 subjects with whole-genome-sequencing data were selected from the AD Neuroimaging Initiative. Total 76078 single-nucleotide-variants (SNVs, Y: dimension 808x76078) from top 239 AD-associated genes in previous AD-GWAS1 were included in this analysis.Latest clinical diagnoses, AV45-PET images, CSF phosphorylated tau (p-tau) concentrations, and T1-weighted structural MRI (sMRI) scans were obtained for each subject to represent subjects’ most up-to-date disease status. More specifically, the composite standardized uptake value ratio (SUVR) from AV45-PET were normalized by the mean signal in the composite reference region and then used as a binary approach to determine individual’s amyloid status with the 0.826 cut-off6. Subjects’ tau positivity status were determined from CSF p-tau measure with 31pg/ml cut-off7. Each sMRI image was fed into the FreeSurfer 6.0 pipeline to compute features of regional thicknesses and volumes.
Discrete numbers were assigned to each categorical genotype, with 0, 1, 2 representing existences of 0, 1, or 2 copies of alternative alleles. ICA was then utilized to decompose SNVs into a linear combination of sources (S) and corresponding loading matrix (A). The details of ICA decomposition can be found in Calhoun et al8. We selected 30 independent components (ICs) in our analysis, as it explains 15.87% of variance in all SNVs (Y) while it guarantees the algorithm to converge. For interpretation, we further normalized each source (S), and identified the most contributing SNVs with |S|>2 for each IC. The genes associated with these contributing SNVs were further obtained for each IC, and entered into PANTHERS gene list analysis to identify involved pathways9. Furthermore, we examined the associations between each IC loadings (A) and subjects’ clinical diagnosis, AD pathology (amyloid and tau status), and MRI-derived structural brain measures using a generalized linear regression model.
Results and Discussion
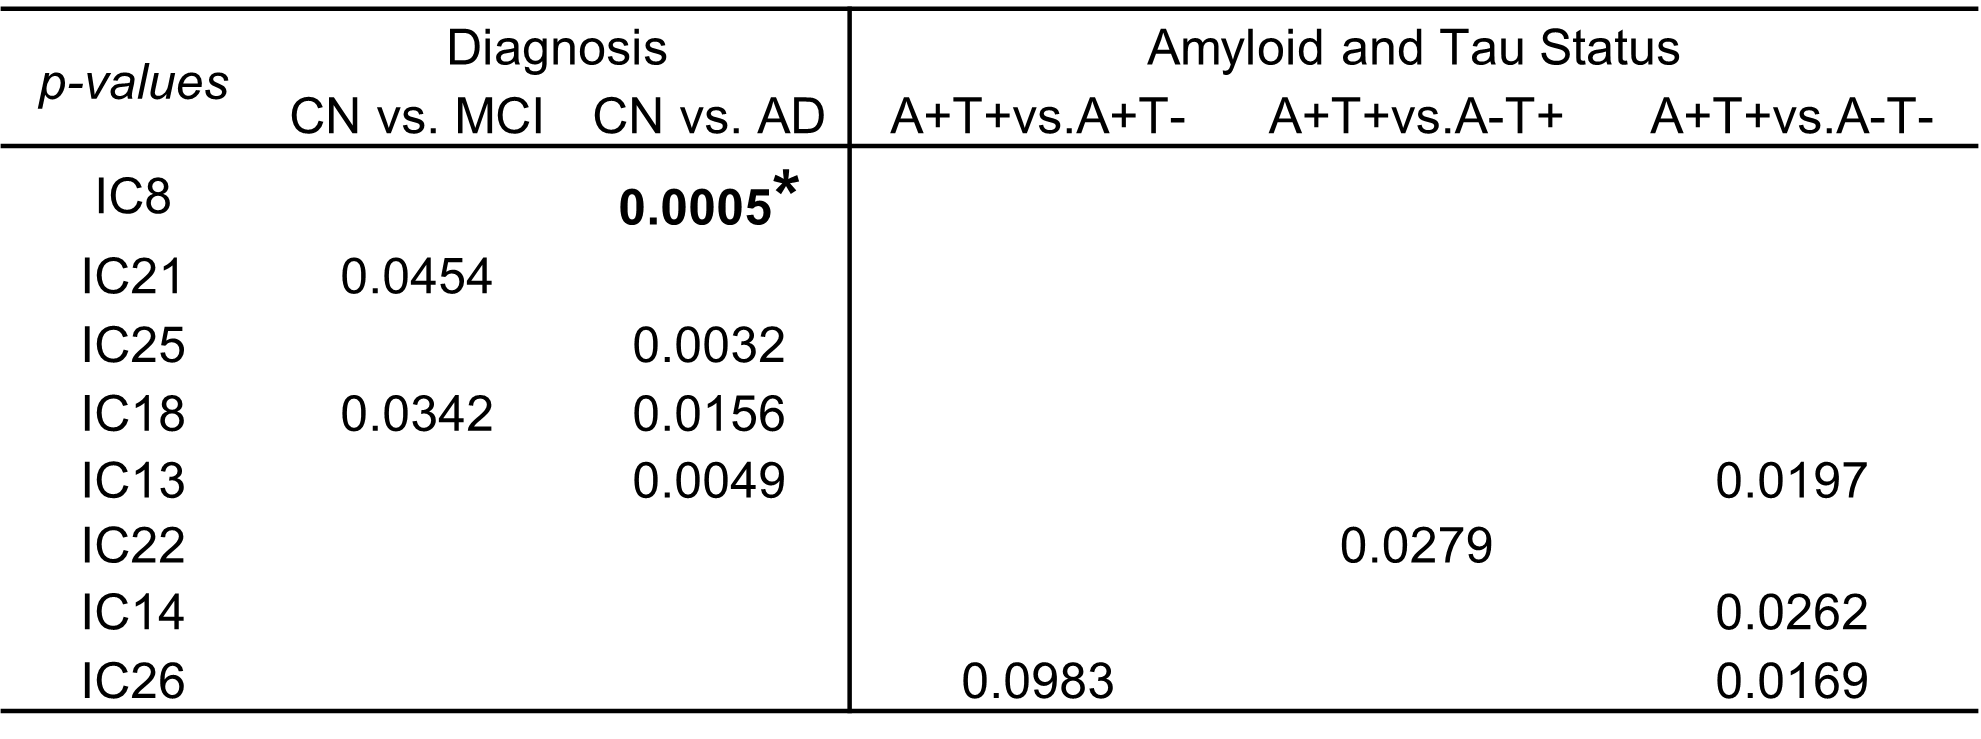
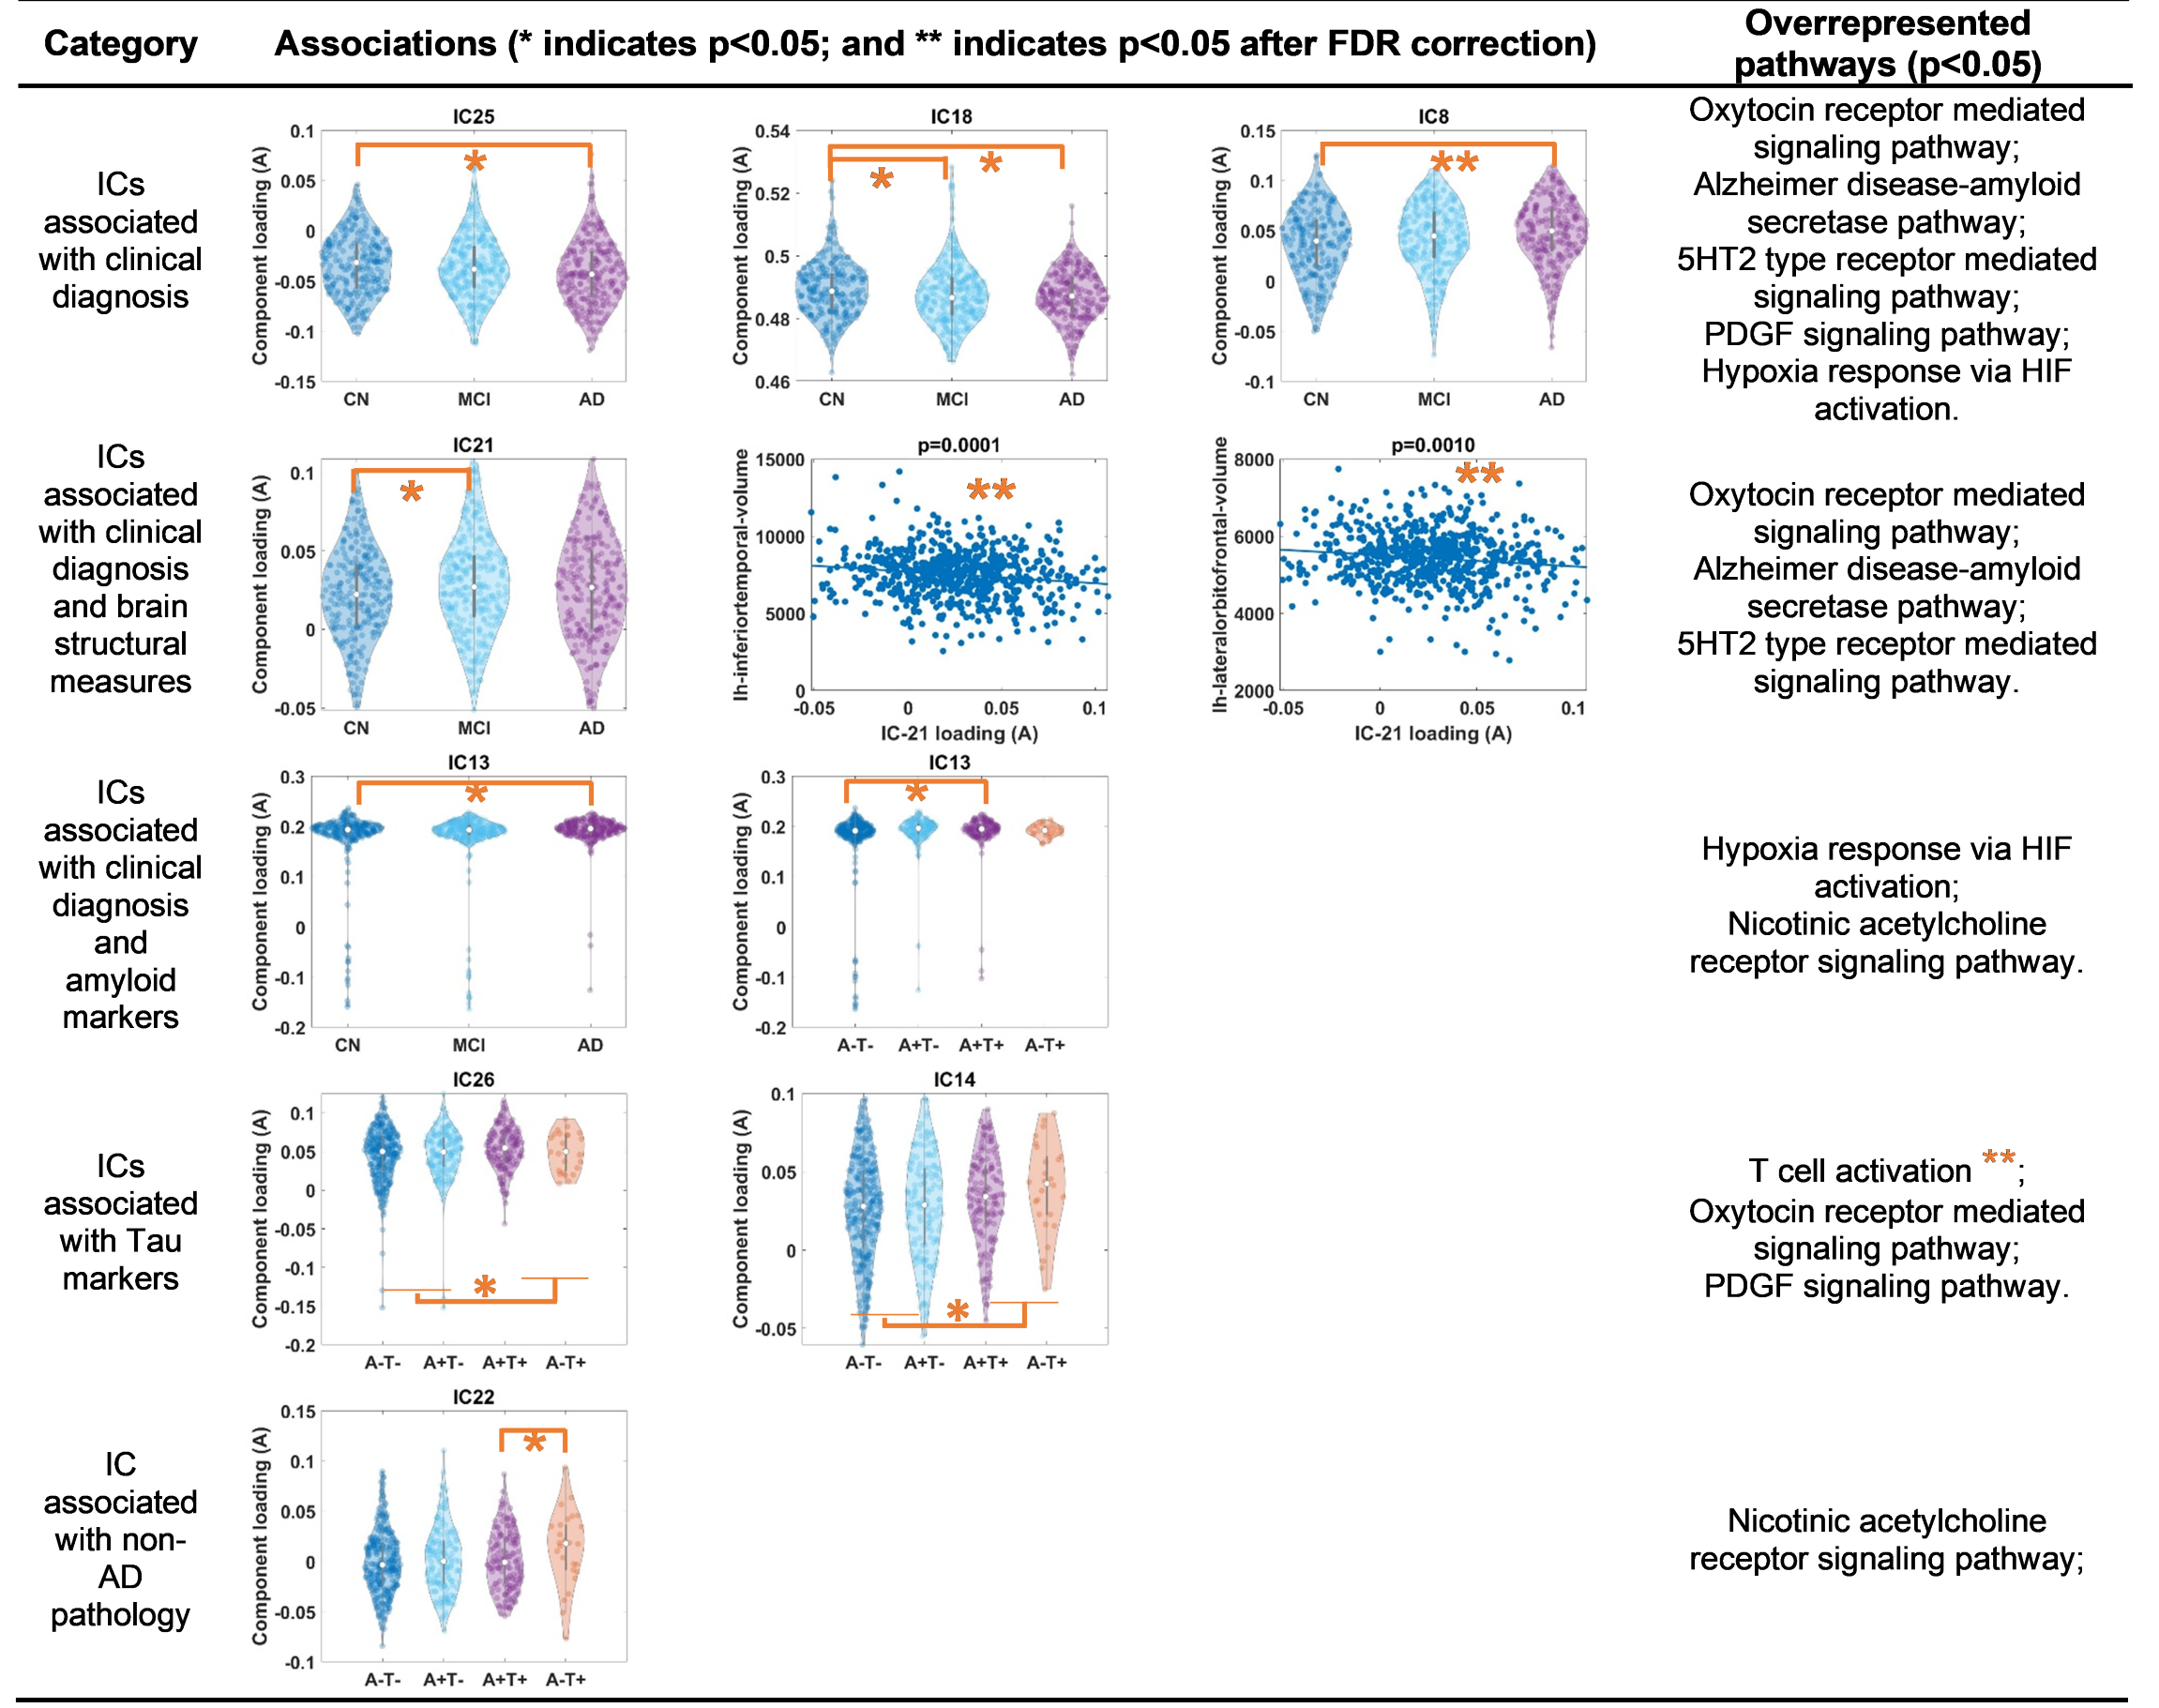
Table 1 lists the significant associations (p-values) between each IC loadings (A) and AD clinical diagnosis (columns 2-3), and AD pathological markers (column 4-6). More specifically, as shown in Table 1 and Fig. 2, loadings of IC8, IC13, IC18, IC21 and IC25 are significantly associated AD clinical diagnosis (praw<0.05). Loadings of IC21 are additionally significantly associated with MRI-derived brain structural measures. Out of 138 volume and thickness measures examined, 7 measures demonstrate significant negative associations with IC21 loadings (pFDR<0.05) and 2 representative regions are plotted in Fig. 2 (3rd row). The top genes contribute to these ICs are significantly overrepresented in Alzheimer’s disease-amyloid secretase pathway, 5HT2 type receptor mediated signaling pathway (involved in learning and memory10), and oxytocin receptor mediated signaling pathway (related to vascular dementia11).Meanwhile, loadings of IC13 are significantly higher in amyloid positive subjects as compared to amyloid negative subjects (4th row in Fig.2), and top genes contributing to IC13 are significantly overrepresented in pathways related to amyloid plaque formation, aggregation and toxicity involving hypoxia induced factor12 and Nicotinic Acetylcholine receptor signaling pathway13.
Furthermore, loadings of IC14 and IC26 are significantly higher in tau positive subjects, as compared to tau negative subjects (5th row in Fig. 2). Top genes contributing to these ICs are uniquely and significantly overrepresented in pathways related to adaptive immune system.
Conclusion
Using ICA, we dissect the detailed relationships between SNVs from top 239 AD-associated genes and AD clinical diagnosis, and MRI-/PET- derived AD imaging biomarkers. This type of multivariate data-driven approach holds promises to simultaneously identify multiple functionally relevant subsets of genetic variants that might not be captured by the case-control studies, which could be helpful to further delineate diagnoses-associated or neuropathology-associated genetic variants in AD.Acknowledgements
Research reported in this study was supported by NIH RF1AG071566 (NIA), P20GM109025 (NIGMS), P20-AG068053 (NVeADRC). Research reported in this study was additionally supported by private grants from the Peter and Angela Dal Pezzo funds, from Lynn and William Weidner, and from Stacie and Chuck Matthewson, and from the Keep Memory Alive Foundation.
Data collection and sharing for this project was funded by the Alzheimer's Disease Neuroimaging Initiative (ADNI) (National Institutes of Health Grant U01 AG024904) and DOD ADNI (Department of Defense award number W81XWH-12-2-0012). ADNI is funded by the National Institute on Aging, the National Institute of Biomedical Imaging and Bioengineering, and through generous contributions from the following: AbbVie, Alzheimer’s Association; Alzheimer’s Drug Discovery Foundation; Araclon Biotech; BioClinica, Inc.; Biogen; Bristol-Myers Squibb Company; CereSpir, Inc.; Cogstate; Eisai Inc.; Elan Pharmaceuticals, Inc.; Eli Lilly and Company; EuroImmun; F. Hoffmann-La Roche Ltd and its affiliated company Genentech, Inc.; Fujirebio; GE Healthcare; IXICO Ltd.; Janssen Alzheimer Immunotherapy Research & Development, LLC.; Johnson & Johnson Pharmaceutical Research & Development LLC.; Lumosity; Lundbeck; Merck & Co., Inc.; Meso Scale Diagnostics, LLC.; NeuroRx Research; Neurotrack Technologies; Novartis Pharmaceuticals Corporation; Pfizer Inc.; Piramal Imaging; Servier; Takeda Pharmaceutical Company; and Transition Therapeutics. The Canadian Institutes of Health Research is providing funds to support ADNI clinical sites in Canada. Private sector contributions are facilitated by the Foundation for the National Institutes of Health (www.fnih.org). The grantee organization is the Northern California Institute for Research and Education, and the study is coordinated by the Alzheimer’s Therapeutic Research Institute at the University of Southern California. ADNI data are disseminated by the Laboratory for Neuro Imaging at the University of Southern California.
References
1. Lambert JC, Ibrahim-Verbaas CA, Harold D, et al. Meta-analysis of 74,046 individuals identifies 11 new susceptibility loci for Alzheimer’s disease. Nat Genet. 2013;45:1452–1458.
2. Wightman DP, Jansen IE, Savage JE, et al. A genome-wide association study with 1,126,563 individuals identifies new risk loci for Alzheimer’s disease. Nat Genet. 2021;53:1276–1282.
3. Braskie MN, Thompson PM. A focus on structural brain imaging in the Alzheimer’s Disease Neuroimaging Initiative. Biol Psychiatry [online serial]. Elsevier; 2014;75:527–533. Accessed at: http://dx.doi.org/10.1016/j.biopsych.2013.11.020.
4. Bellenguez C, Küçükali F, Jansen IE, et al. New insights into the genetic etiology of Alzheimer’s disease and related dementias. Nat Genet. 2022;54:412–436.
5. Chen J, Calhoun VD, Pearlson GD, et al. Independent component analysis of SNPs reflects polygenic risk scores for schizophrenia. Schizophr Res. Elsevier B.V.; 2017;181:83–85.
6. Landau SM, Fero A, Baker SL, et al. Measurement of Longitudinal β-Amyloid Change with 18F-Florbetapir PET and Standardized Uptake Value Ratios. Journal of Nuclear Medicine [online serial]. Society of Nuclear Medicine; 2015;56:567–574. Accessed at: https://jnm.snmjournals.org/content/56/4/567. Accessed November 7, 2022.
7. Guo T, Korman D, la Joie R, et al. Normalization of CSF pTau measurement by Aβ40improves its performance as a biomarker of Alzheimer’s disease. Alzheimers Res Ther. BioMed Central; 2020;12.
8. Calhoun VD, Adali T, Pearlson GD, Pekar JJ. Spatial and temporal independent component analysis of functional MRI data containing a pair of task-related waveforms. Hum Brain Mapp [online serial]. 2001;13:43–53. Accessed at: http://doi.wiley.com/10.1002/hbm.1024. Accessed September 17, 2017.
9. Thomas PD, Ebert D, Muruganujan A, Mushayahama T, Albou LP, Mi H. PANTHER: Making genome-scale phylogenetics accessible to all. Protein Science John Wiley and Sons Inc; 2022. p. 8–22.
10. Zhang G, Stackman RW. The role of serotonin 5-HT2A receptors in memory and cognition. Front Pharmacol Frontiers Media S.A.; 2015.
11. McKay EC, Beck JS, Khoo SK, et al. Peri-infarct upregulation of the oxytocin receptor in vascular dementia. J Neuropathol Exp Neurol. Oxford University Press; 2019;78:436–452.
12. Hassan H, Chen R. Hypoxia in Alzheimer’s disease: Effects of hypoxia inducible factors. Neural Regen Res Wolters Kluwer Medknow Publications; 2021. p. 310–311.
13. Buckingham SD, Jones AK, Brown LA, Sattelle DB. Nicotinic Acetylcholine Receptor Signalling: Roles in Alzheimer’s Disease and Amyloid Neuroprotection. Pharmacol Rev [online serial]. American Society for Pharmacology and Experimental Therapeutics; 2009;61:39–61.
Figures