3322
A comprehensive set of gray matter labels for the MIITRA atlas: Interoperability with complementary atlases1Biomedical Engineering, Illinois Institute of Technology, Chicago, IL, United States, 2Rush Alzheimer’s Disease Center, Rush University Medical Center, Chicago, IL, United States
Synopsis
Keywords: Alzheimer's Disease, Aging, Aging, Atlas, Brain, Gray Matter
The Multichannel Illinois Institute of Technology & Rush university Aging (MIITRA) atlas constructed using high quality MRI data on a large (N=400), diverse, community cohort of non-demented older adults, contains high resolution (0.5mm) structural and diffusion imaging templates. The present work constructed and evaluated a comprehensive set of gyral-based, cytoarchitecture-based, and functional connectivity-based gray matter labels in MIITRA space in order to enhance the functionality of the MIITRA atlas and its interoperability with complementary atlases.INTRODUCTION
The Multichannel Illinois Institute of Technology & Rush university Aging (MIITRA)[1] atlas constructed using high quality MRI data on a large (N=400), diverse, community cohort of non-demented older adults, contains high resolution (0.5mm) structural and diffusion imaging templates. The purpose of this work was to build and evaluate a comprehensive set of gyral-based, cytoarchitecture-based, and functional connectivity-based gray matter labels in MIITRA space in order to enhance the functionality of the MIITRA atlas and its interoperability with complementary atlases.METHODS
Data and preprocessing:T1w images from the 400 older adults included in the construction of the MIITRA atlas (50% male; 64.9-98.9 years of age) were nonlinearly registered using ANTs[2] SyN to the MNI152 6th gen[3], MNI Colin[4], and the ICBM2009c[5] templates, and volumetric labels from Harvard-Oxford[6], Julich[7], AAL3[8], Buckner[9], CoBrALab[10], Hammersmith[11] and Princeton Visual[12] atlases were warped to the space of each participant. The same approach was followed for a separate group of 100 older adults participating in the same studies of aging as the persons included in MIITRA (age-range 65-95, male-female ratio 40:60) to serve as reference labels in the evaluation process.
Construction of gray matter labels:
The gray matter labels of the 400 individuals included in the development of the MIITRA atlas were transformed from raw space to exact physical locations in MIITRA space using the ANTs-derived forward transformations that were applied on individual T1w images to build the MIITRA T1w template[13]. A multi-atlas correction scheme[14] was used to correct for residual misregistration prior to the forward mapping. The label of each 0.5mm isotropic voxel in MIITRA space was then calculated using majority voting among all the labels that were mapped to that voxel. This technique was applied to every set of labels mentioned above, generating a comprehensive set of complementary gray matter labels in MIITRA space.
Evaluation:
T1w images from the 100 older adults of the evaluation group were nonlinearly normalized to the 0.5mm MIITRA T1w template and the inverse transformation was applied to the gray matter labels of the MIITRA atlas to transform them to each individual’s space. The T1w image of each individual was nonlinearly registered to every other individual and the resulting transformations were used to transform the labels from the 99 other older adults to each individual. Pair-wise Jaccard index for each label was calculated in every individual’s native space, within that individual’s gray matter mask. The same procedure was followed for the labels obtained directly from the respective source templates (i.e. MNI152, MNI Colin, and ICBM2009c).
RESULTS
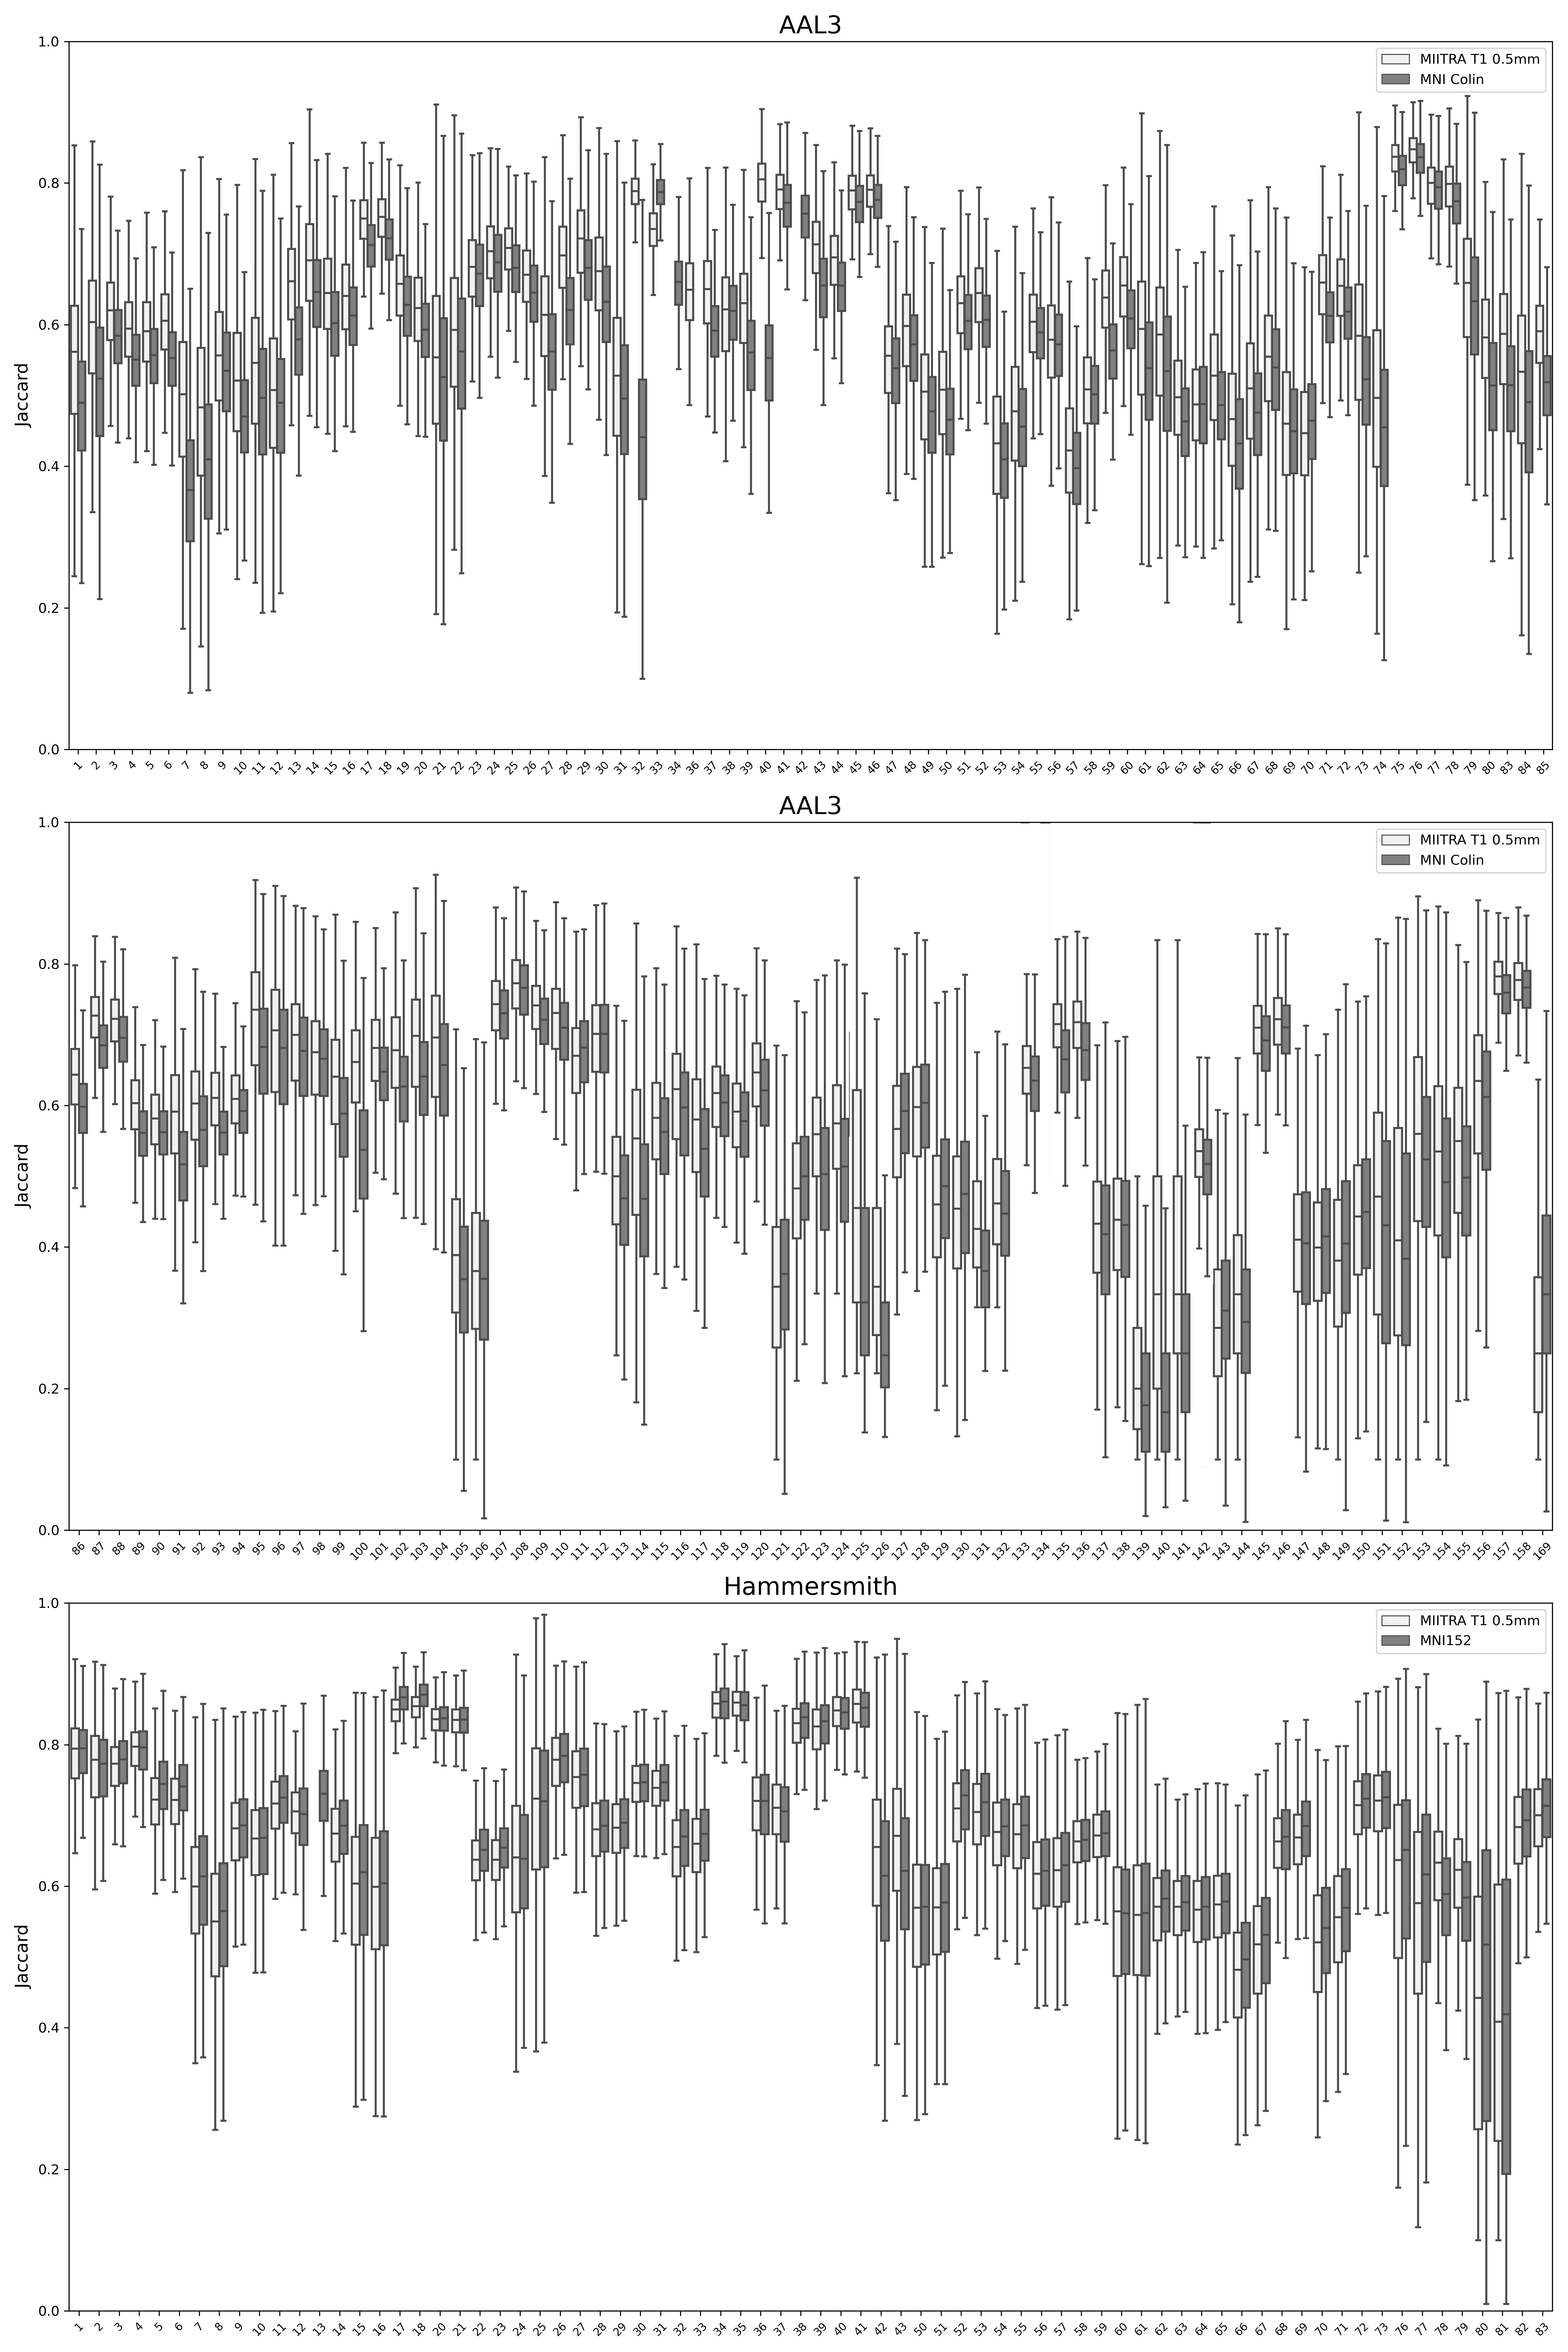
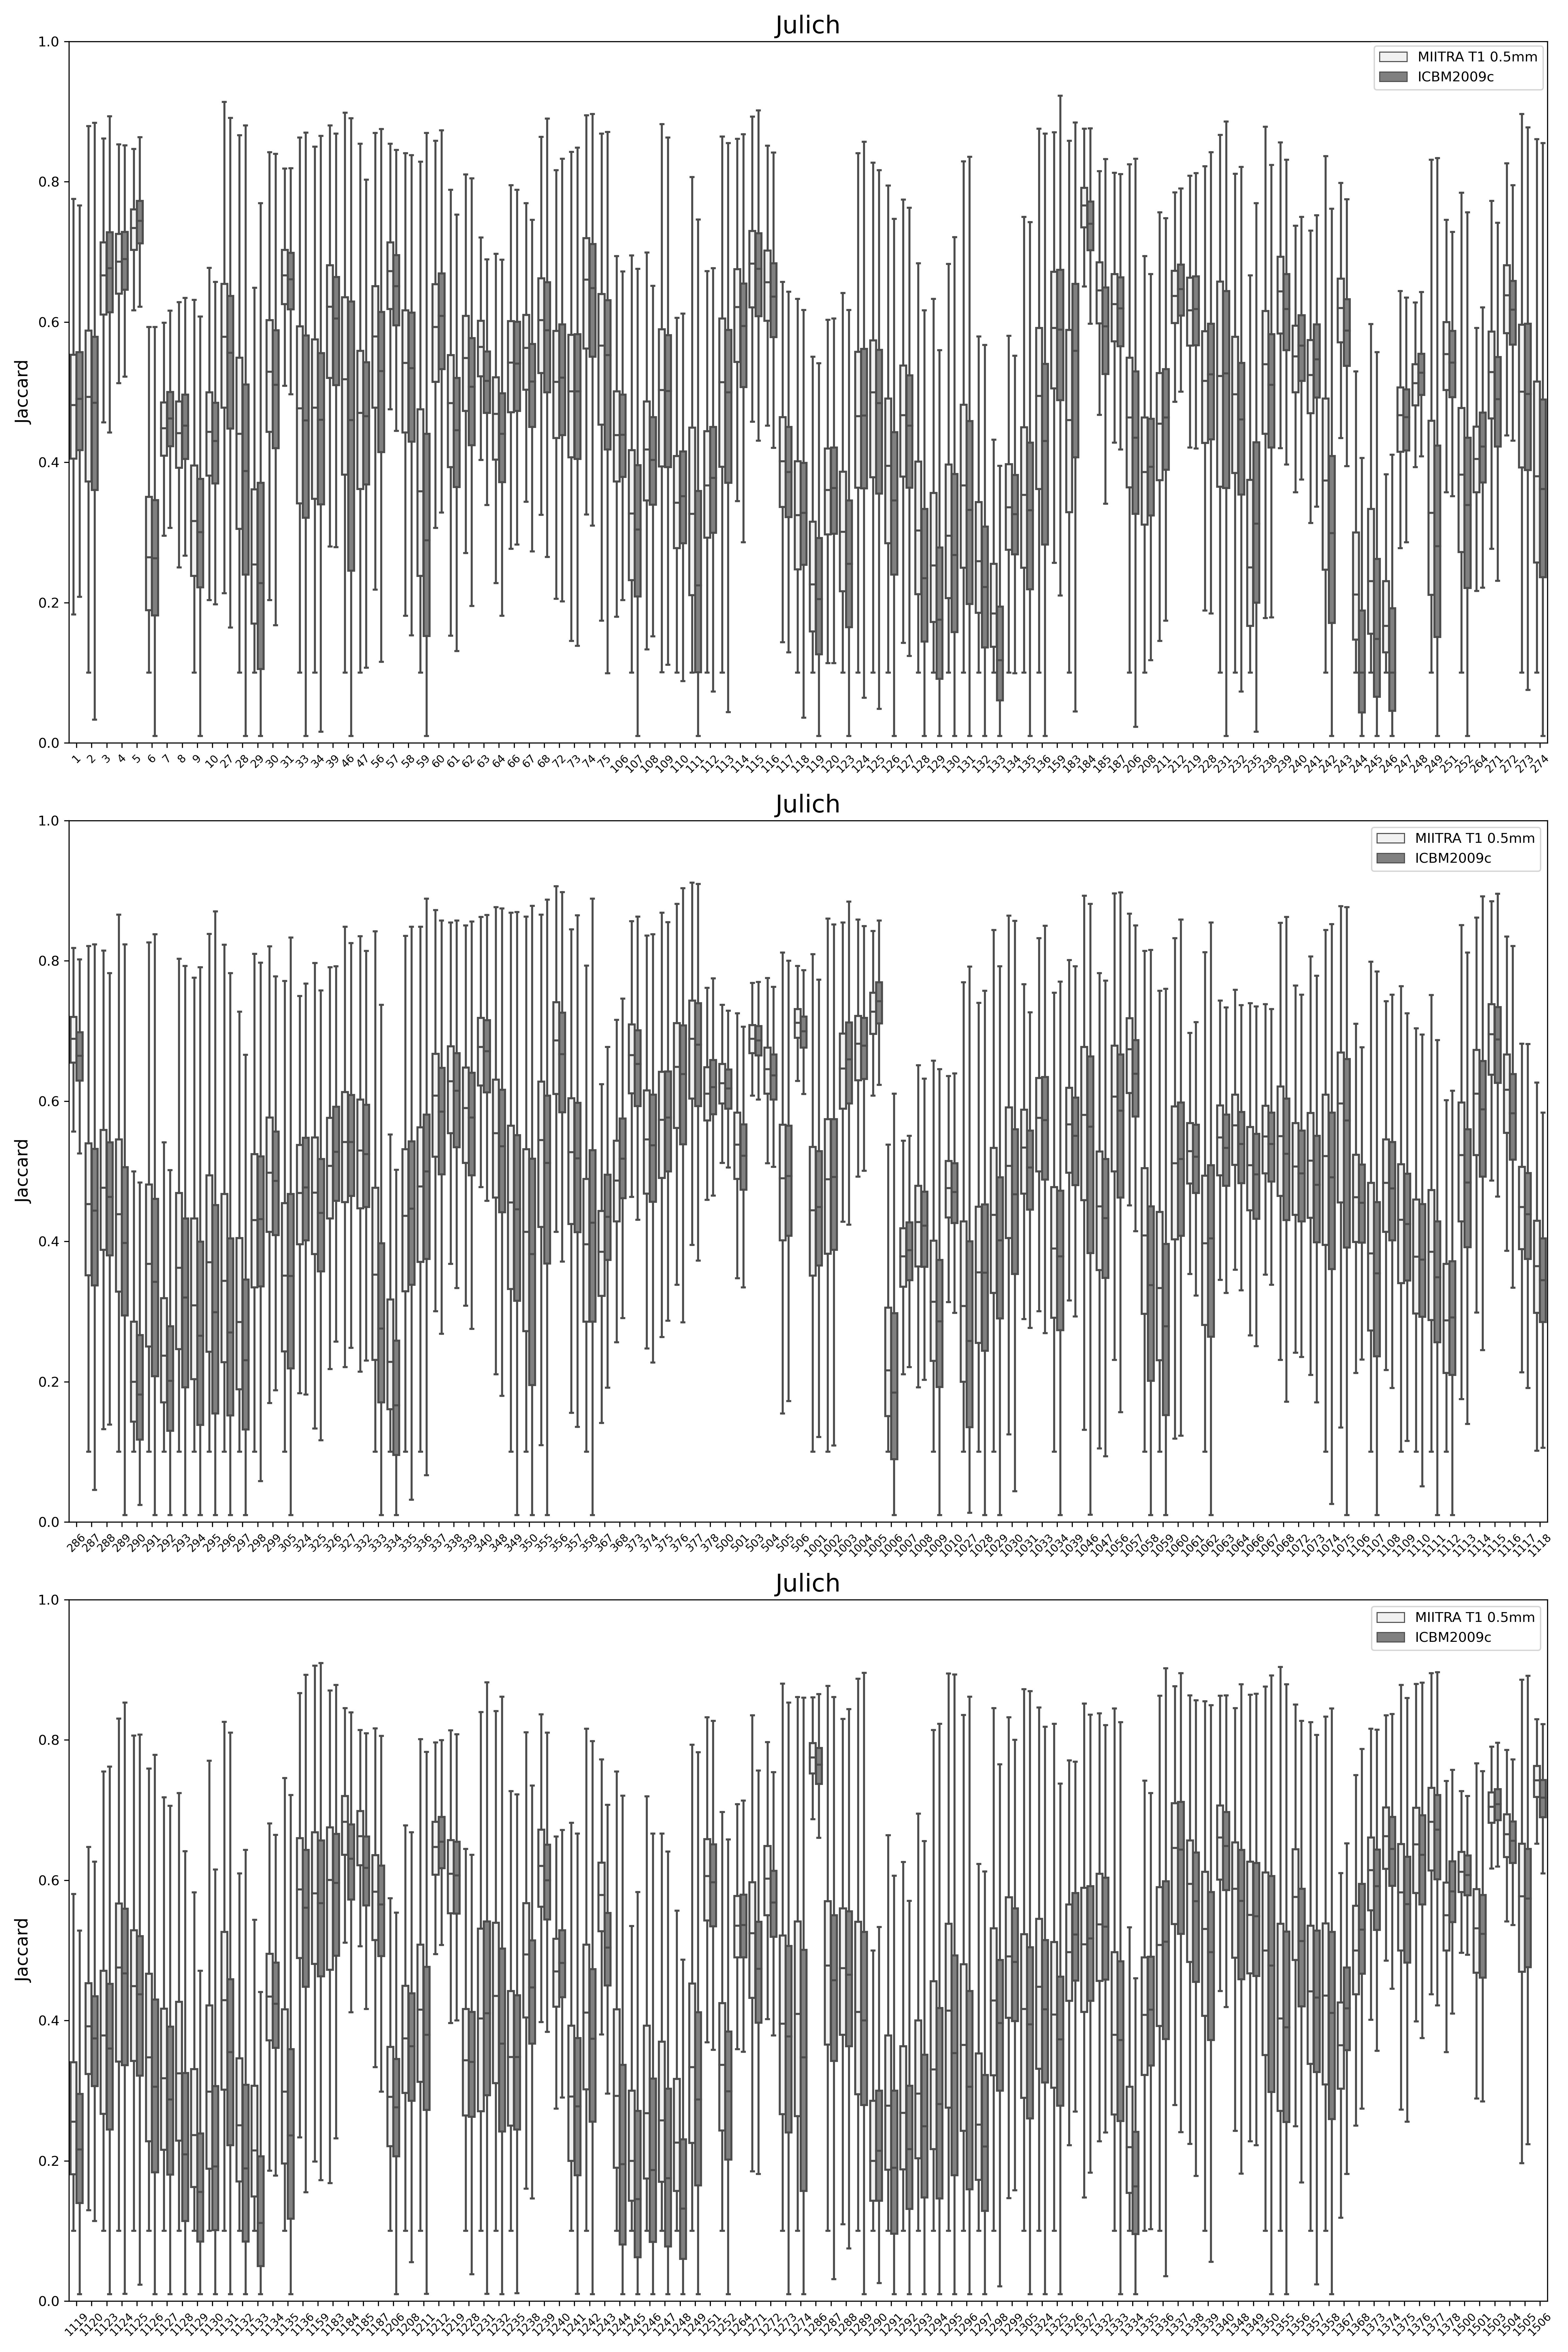
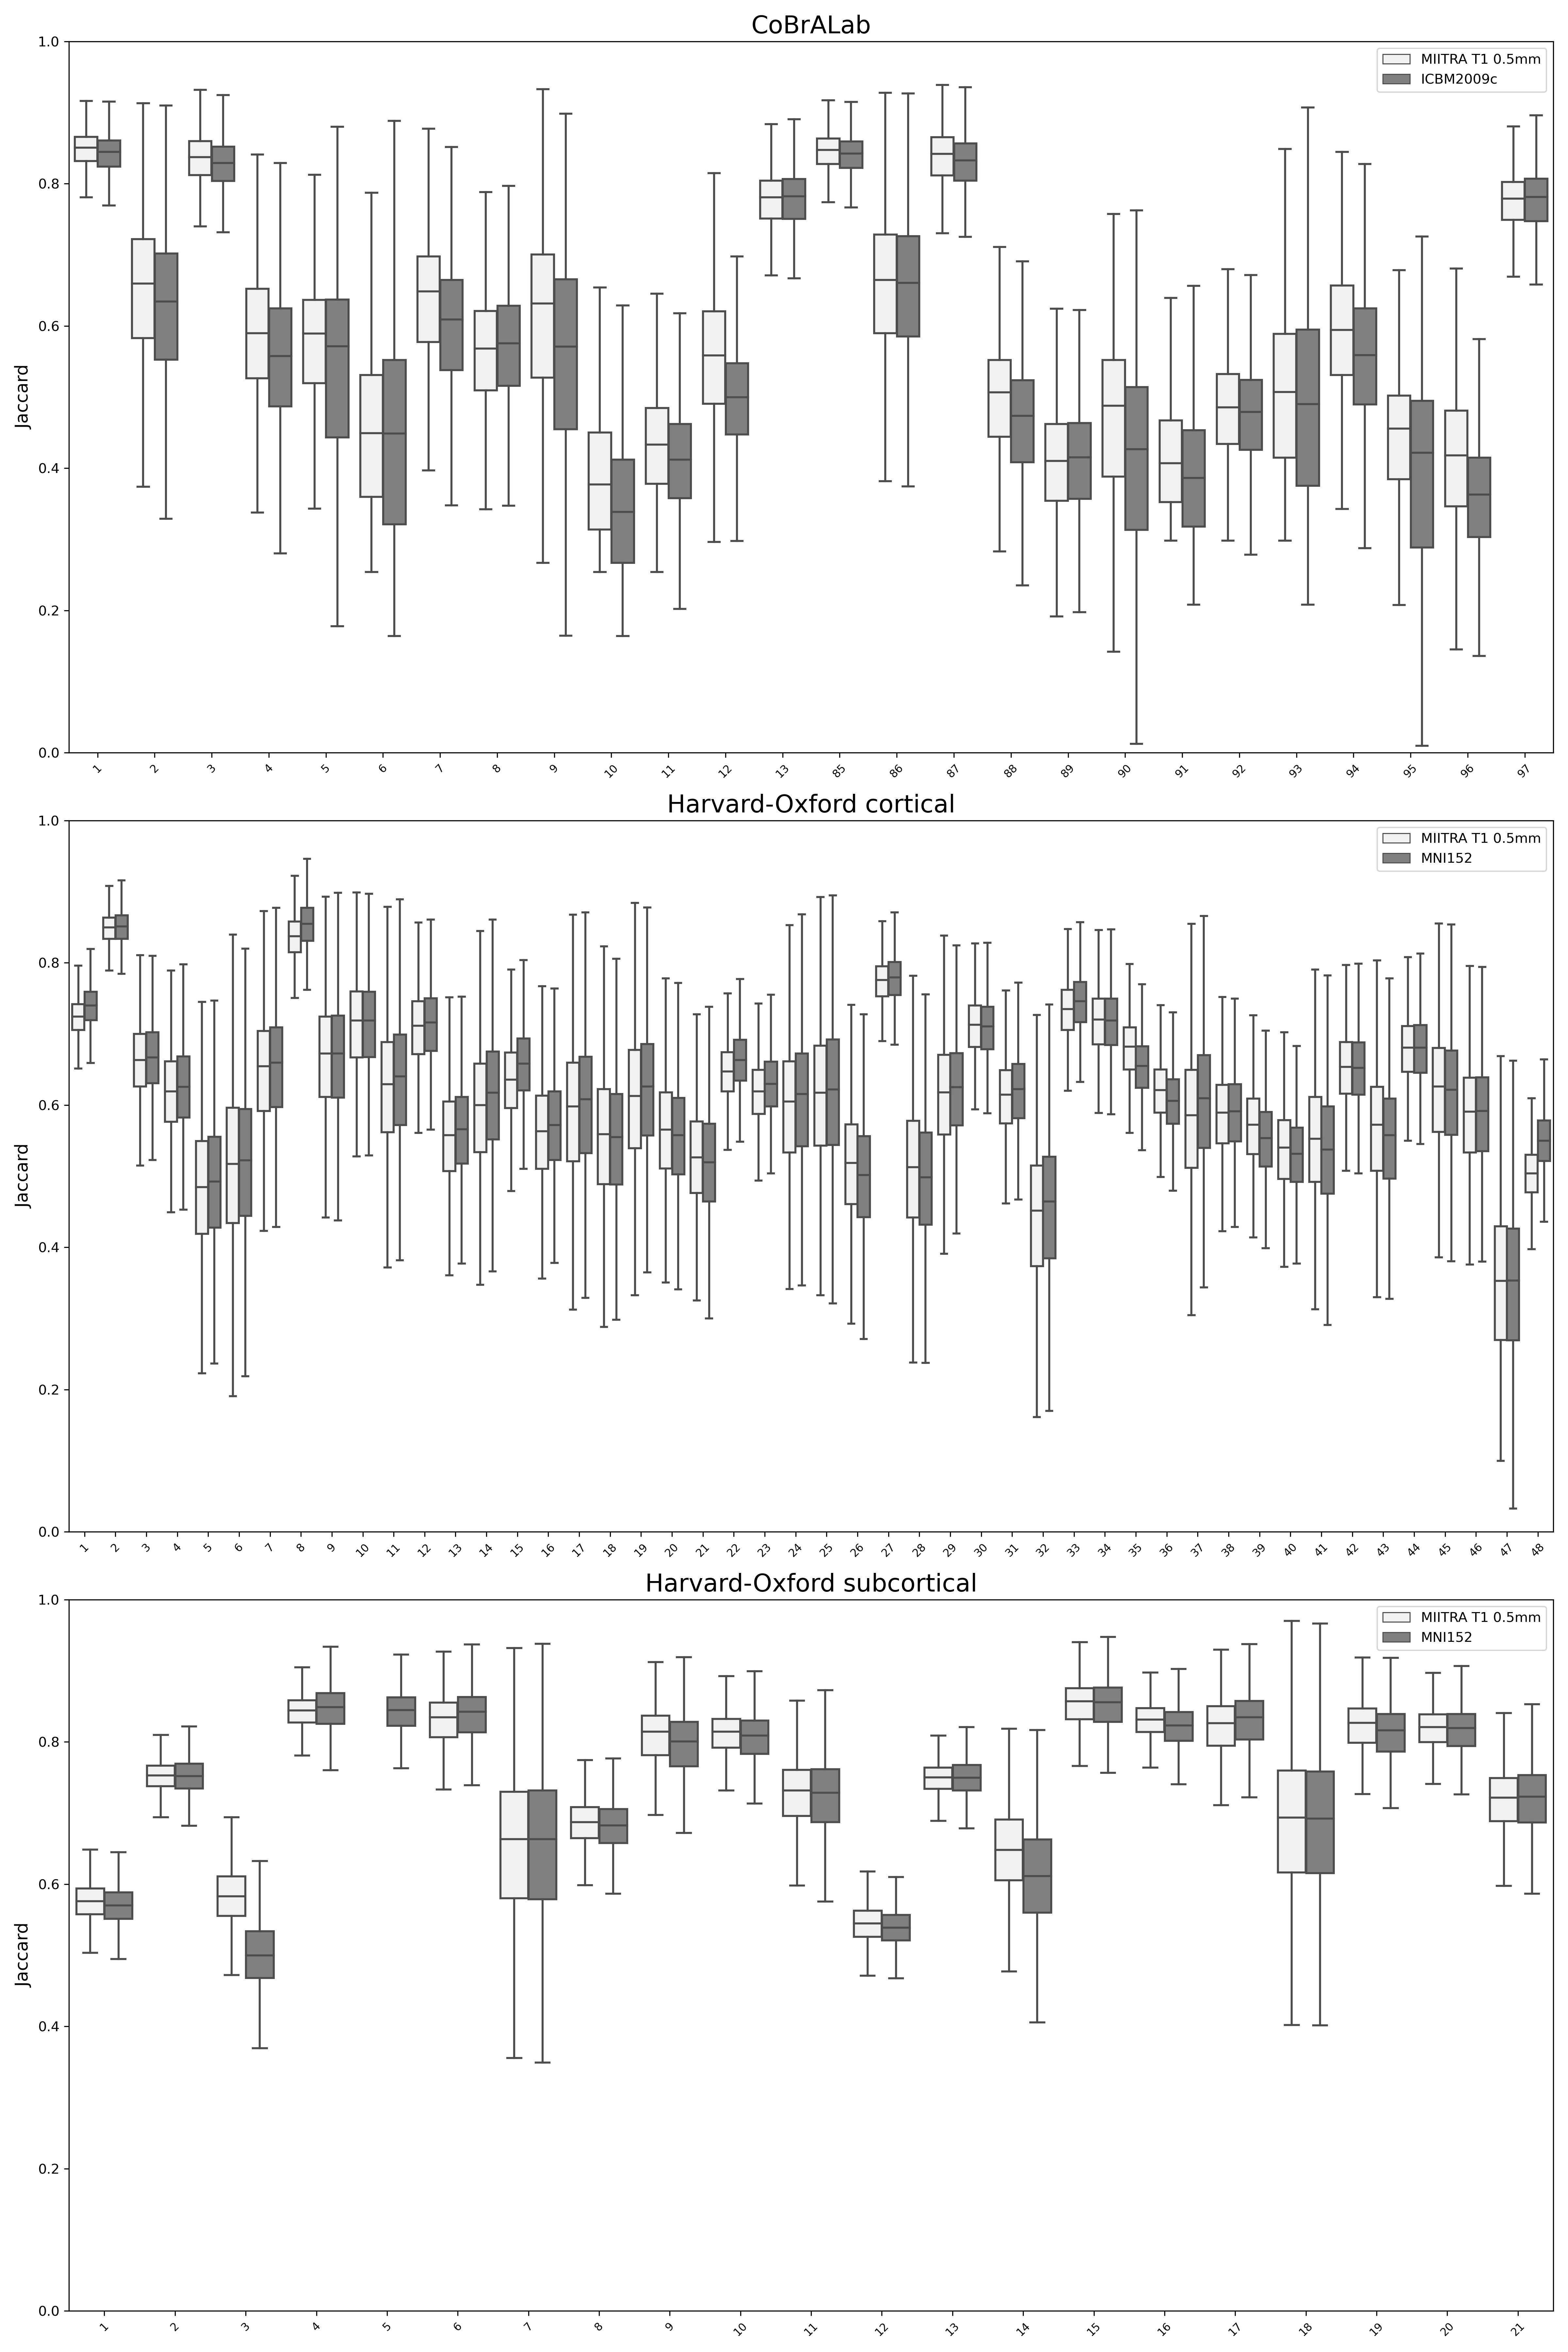
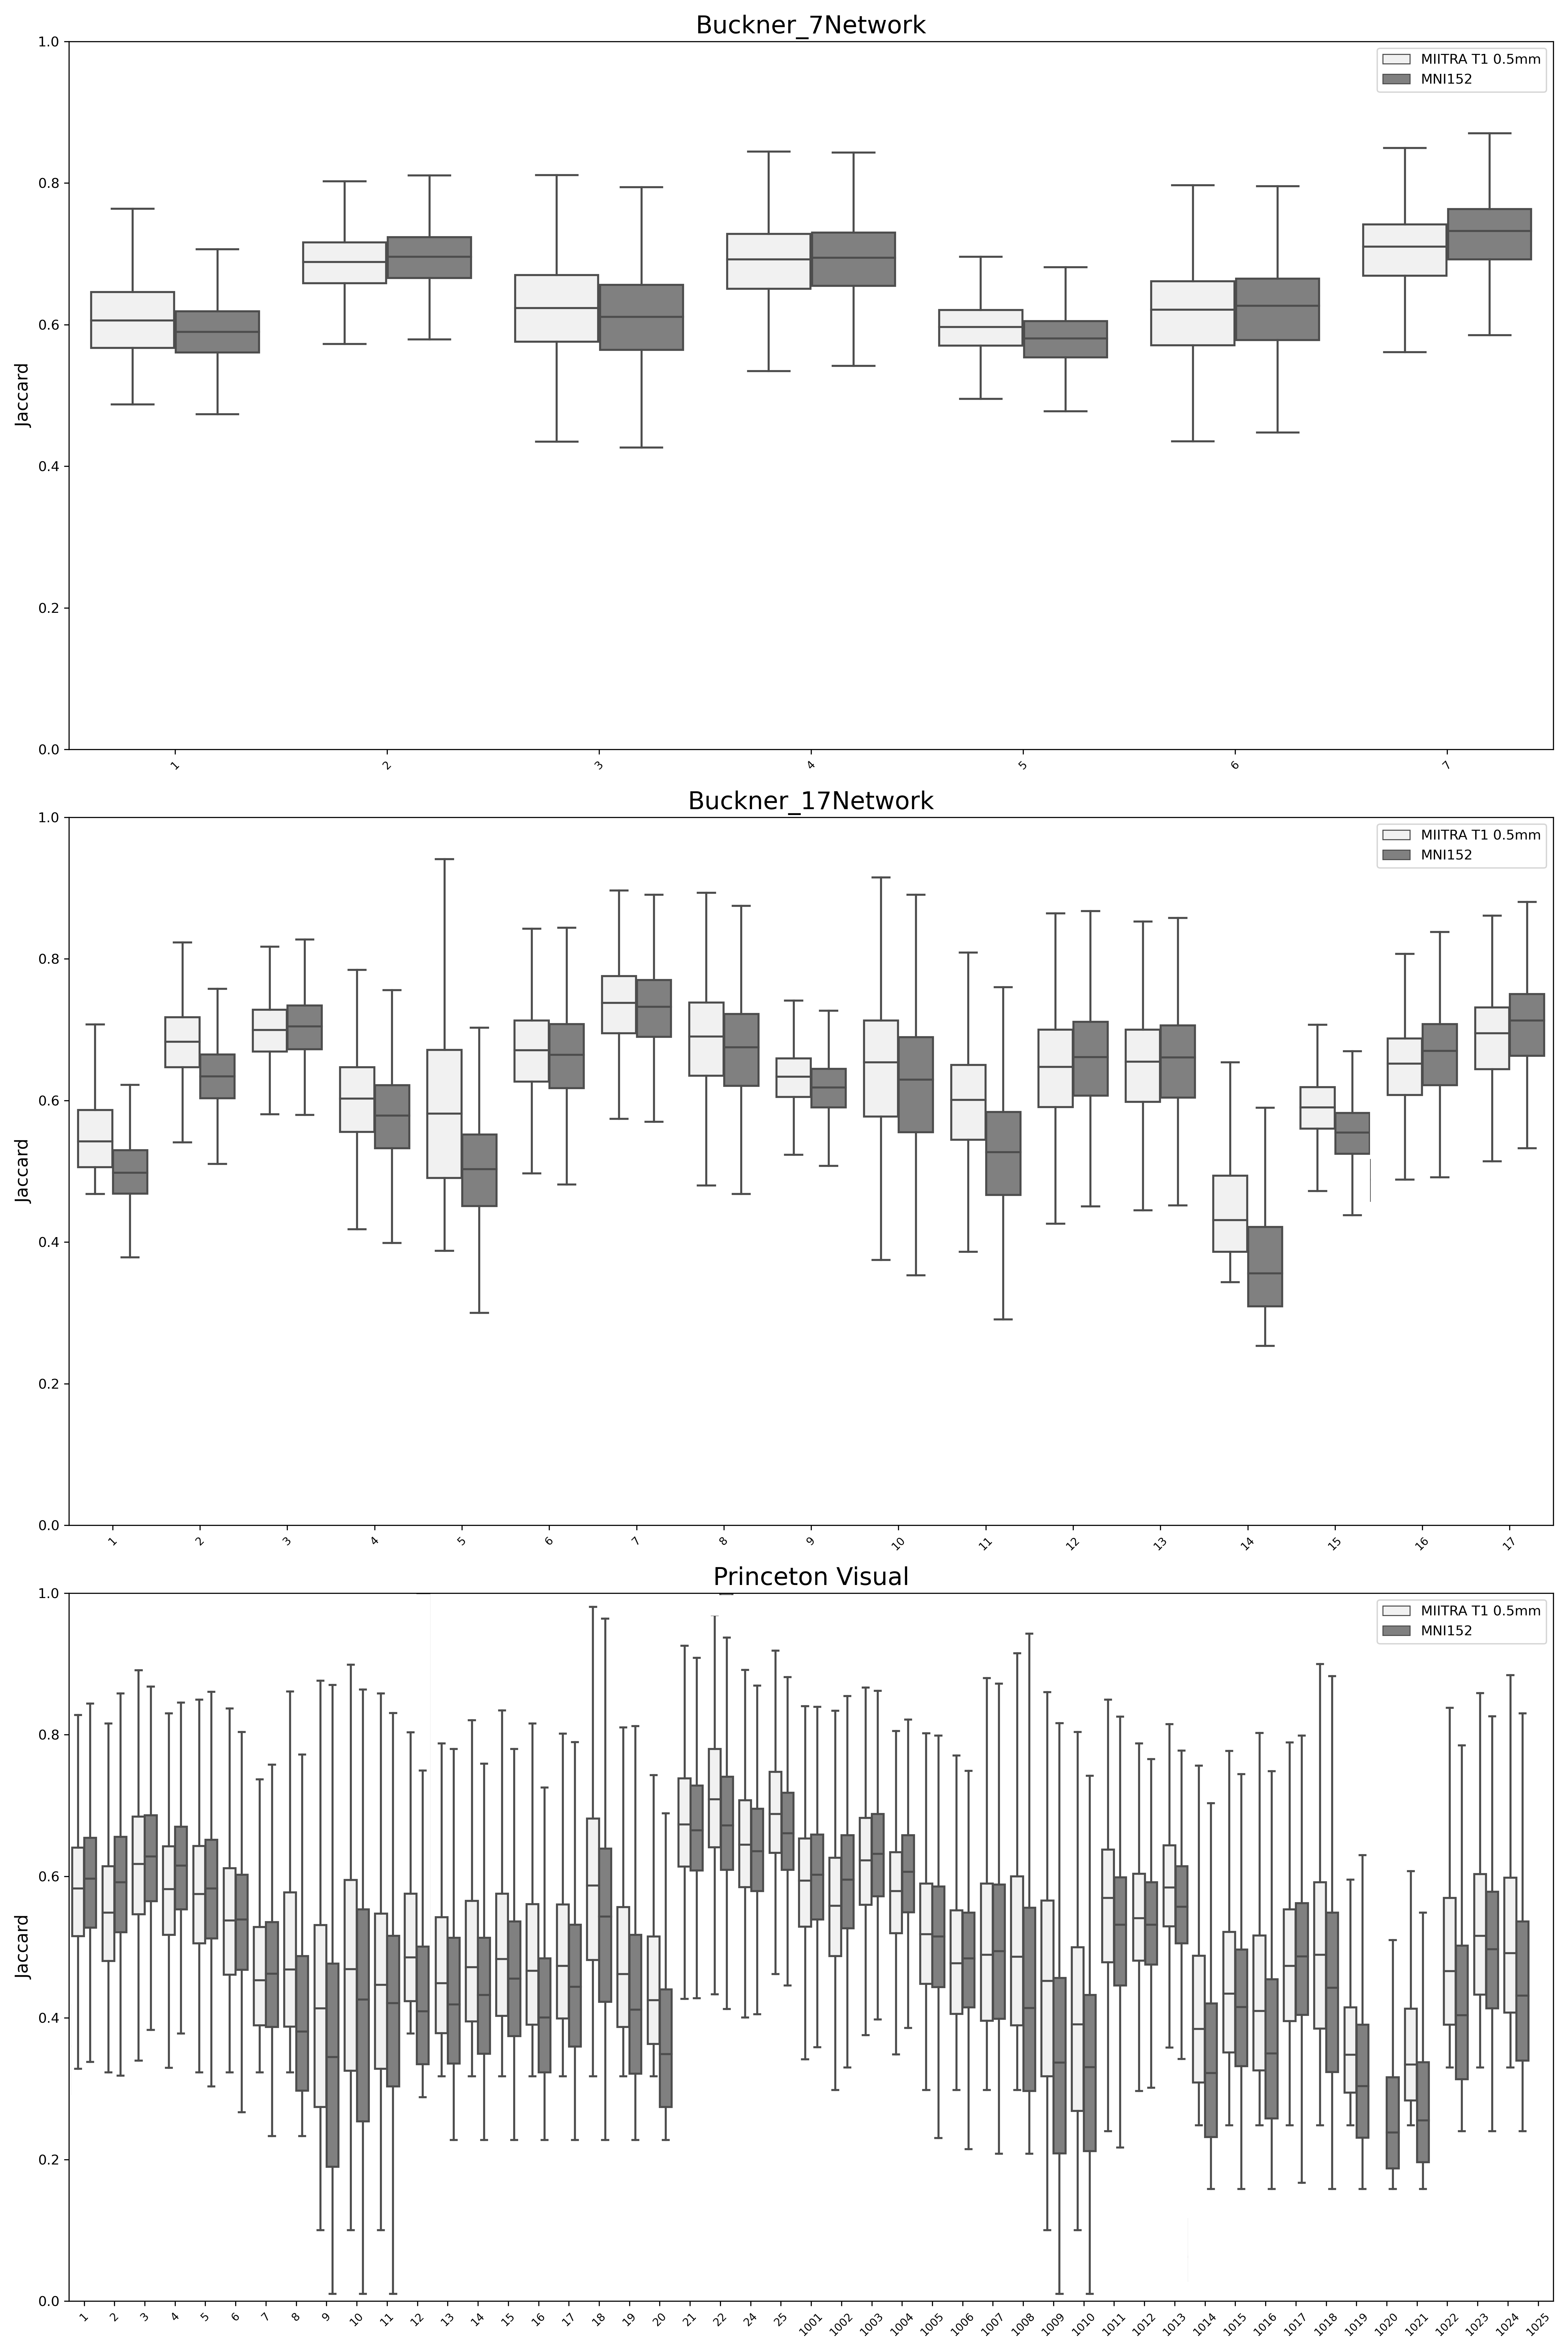
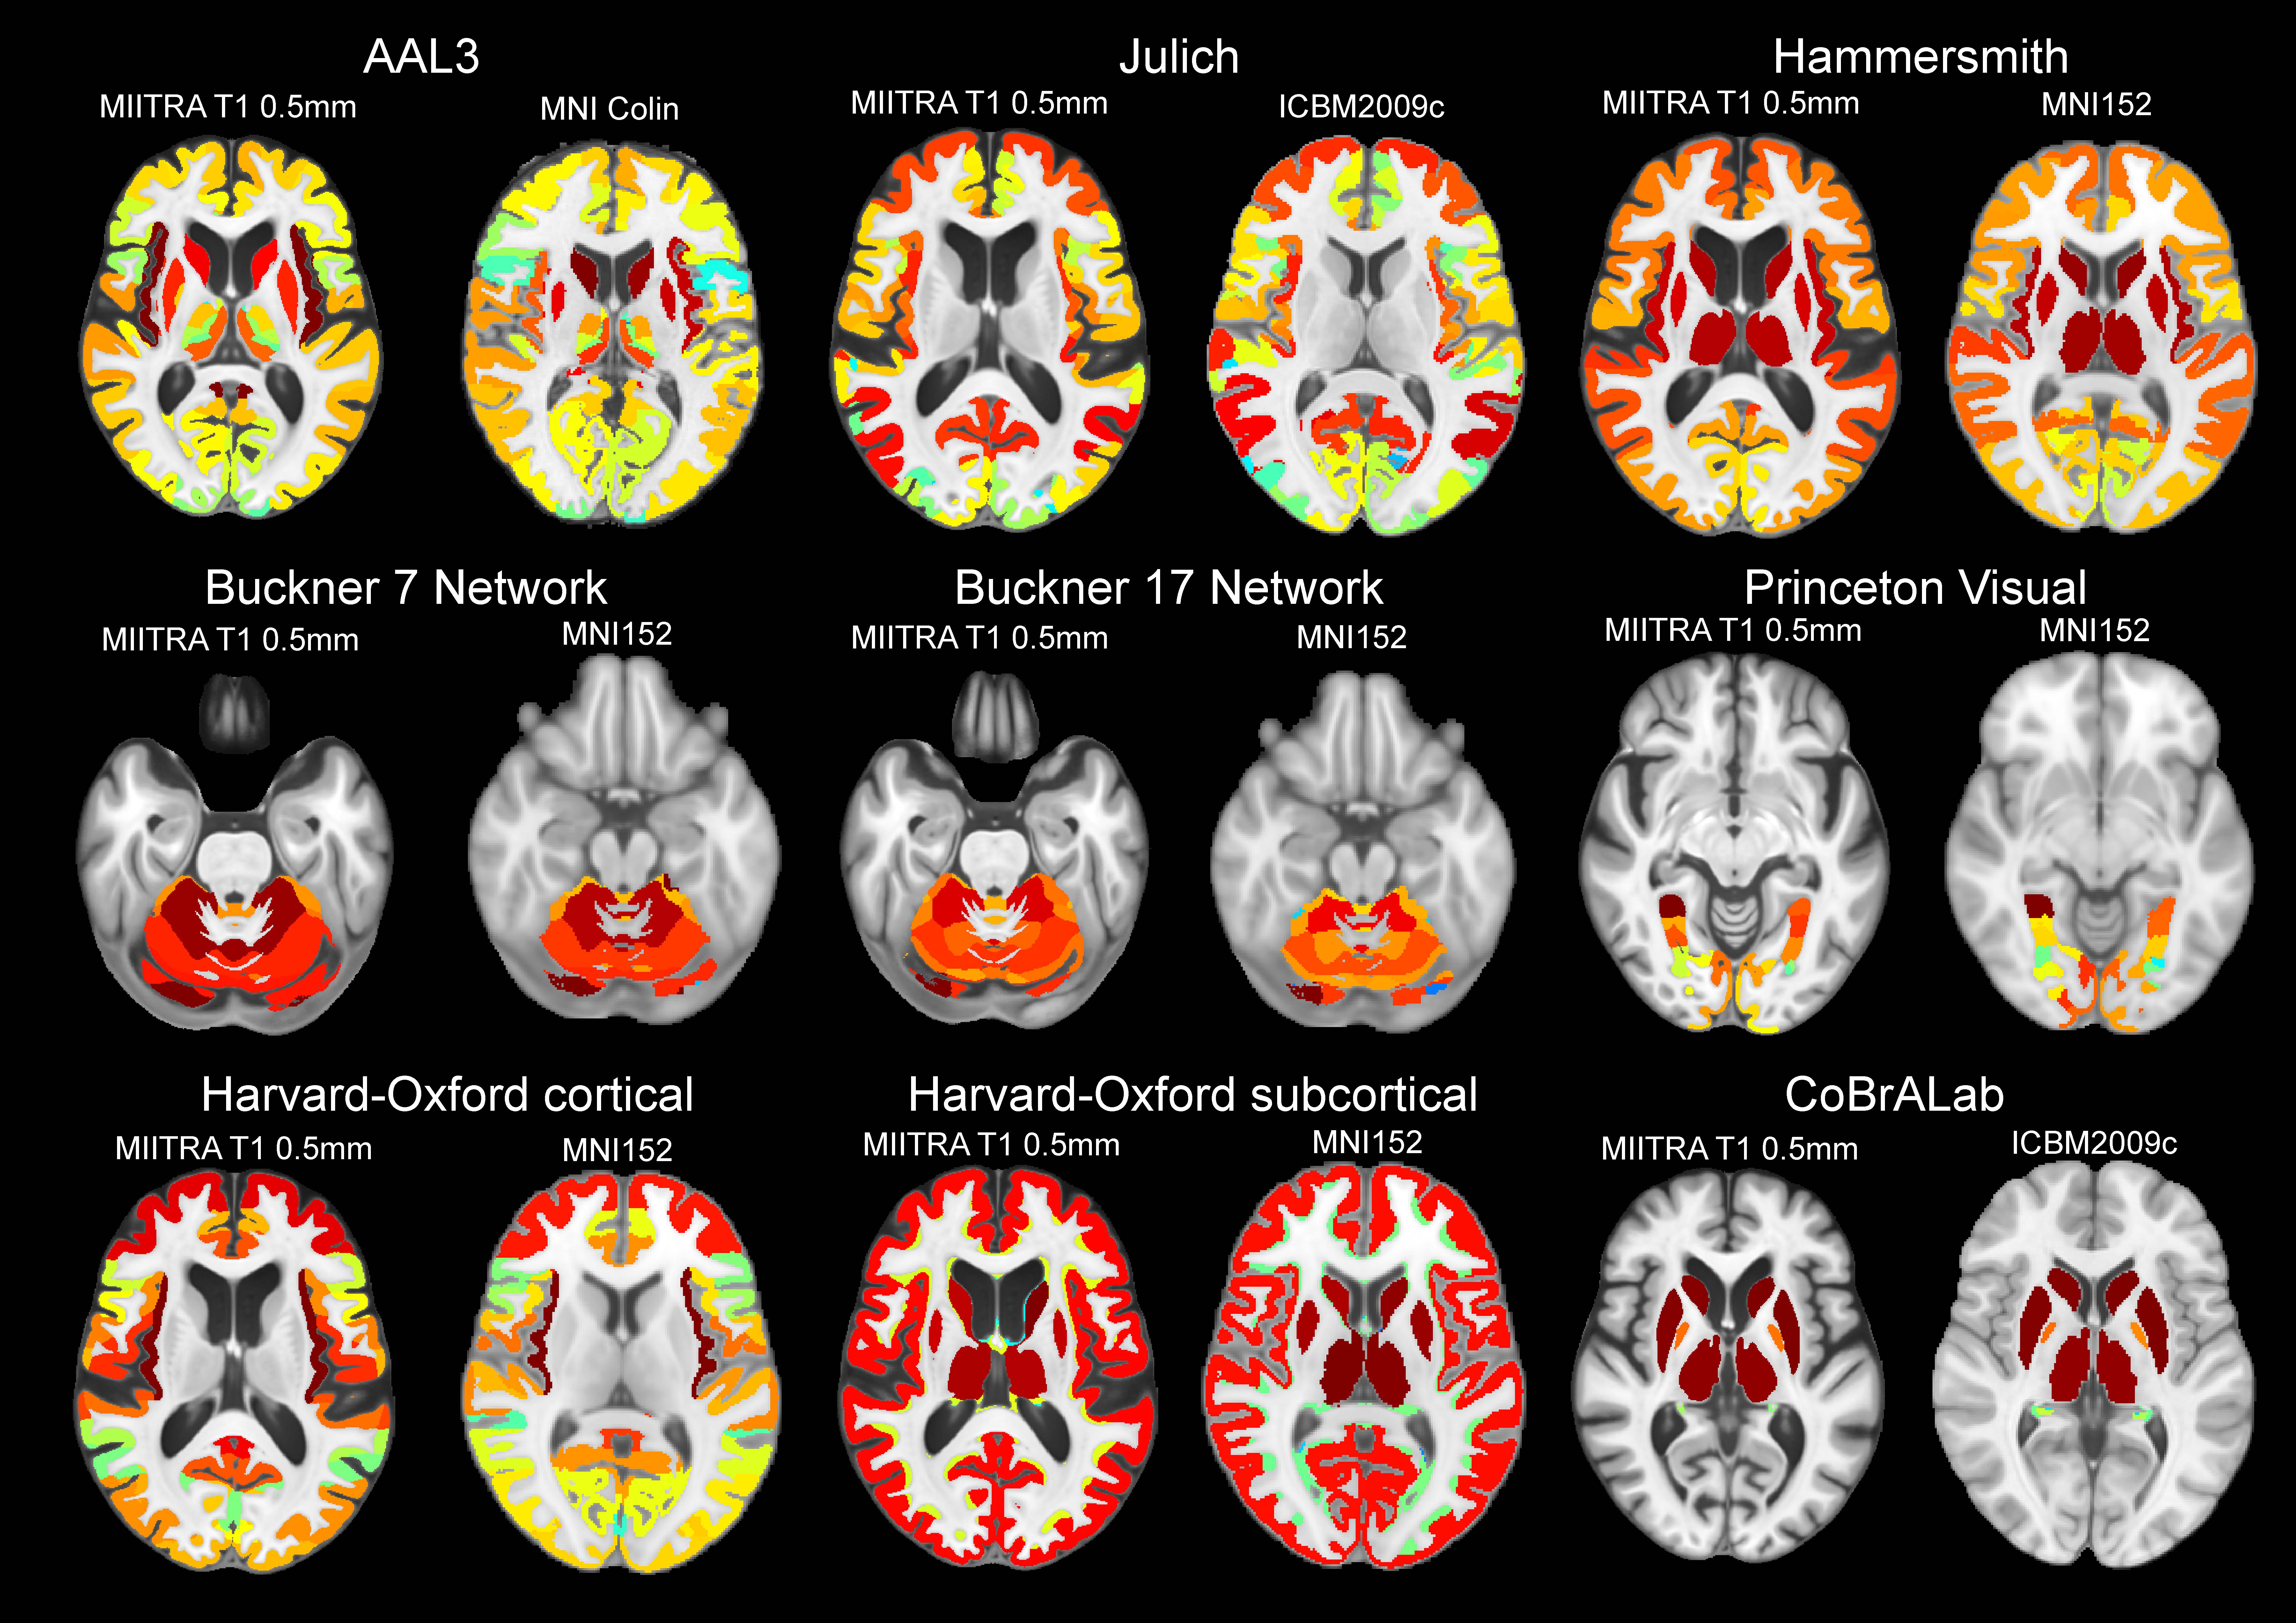
The measures of overlap were higher for the AAL3 labels obtained from the MIITRA atlas with an average pair-wise Jaccard index of 0.59 and standard deviation of 0.08, compared to 0.55±0.1 for the AAL3 (Fig1) labels obtained from the MNI Colin template. The pair-wise Jaccard index for the Julich (Fig2) and CoBrALab labels (Fig3) was 0.54±0.13 and 0.75±0.17 from MIITRA and, 0.53±0.14 and 0.74±0.17 from ICBM2009c. For the Harvard-Oxford (Fig3), Buckner (Fig4), Hammersmith (Fig1) and Princeton Visual (Fig4), the pairwise Jaccard was 0.68±0.14, 0.61±0.07, 0.71±0.10 and 0.35±0.06 respectively from MIITRA and 0.66±0.11, 0.61±0.08, 0.67±0.11 and 0.32±0.08 respectively from MNI 152 template. Heat maps representing the Jaccard index for each template are shown in Fig5.DISCUSSION
A comprehensive set of complementary gray matter labels were constructed for the MIITRA atlas in this work. These labels include gyral-based, cytoarchitecture-based, and functional connectivity-based labels which enhance the functionality of the MIITRA atlas, and its interoperability with other atlases. In the evaluation, the gray matter labels obtained from the MIITRA atlas showed higher overlap during the pair-wise comparison of older adult data suggesting that extracting these labels from the MIITRA space allows more consistent segmentation of the gray matter of the older adult brain compared to the segmentation achieved with labels obtained from the templates constructed using younger or middle aged dataCONCLUSION
This work developed a comprehensive set of complementary gray matter labels for the MIITRA atlas. These labels, in combination with the high-resolution templates of the atlas, may become particularly useful resources in neuroimaging studies of the aging brainAcknowledgements
This study was supported by:
National Institute on Aging (NIA) R01AG052200
National Institute on Aging (NIA) P30AG010161
National Institute on Aging (NIA) P30AG072975
National Institute on Aging (NIA) R01AG017917
National Institute on Aging (NIA) RF1AG022018
National Institute on Aging (NIA) R01AG056405
National Institute on Aging (NIA) R01AG015819
National Institute on Aging (NIA) R01AG064233
National Institute of Neurological Disorders and Stroke (NINDS), UF1NS100599
References
1. Wu Y, Ridwan AR, Niaz MR, Qi X, Zhang S, Alzheimer's Disease Neuroimaging Initiative, Bennett DA, Arfanakis K. Development of high quality T1-weighted and diffusion tensor templates of the older adult brain in a common space. Neuroimage. 2022 Oct 15;260:119417.
2. Avants BB, Tustison NJ, Song G, et al. A reproducible evaluation of ANTs similarity metric performance in brain image registration. Neuroimage. 2011 Feb 1;54(3):2033-44.
3. Mazziotta, J.C., Toga, A.W., Evans, A.C., Fox, P., Lancaster, J., 1995. A probabilistic atlas of the human brain: theory and rationale for its development. NeuroImage 2, 89–101
4. Holmes CJ, Hoge R, Collins L, Woods R, Toga AW, Evans AC. “Enhancement of MR images using registration for signal averaging.” J Comput Assist Tomogr. 1998 Mar-Apr;22(2):324–33.
5. VS Fonov, AC Evans, K Botteron, CR Almli, RC McKinstry, DL Collins and BDCG, Unbiased average age-appropriate atlases for pediatric studies, NeuroImage,Volume 54, Issue 1, January 2011, ISSN 1053–8119
6. Makris N, Goldstein JM, Kennedy D, Hodge SM, Caviness VS, Faraone SV, Tsuang MT, Seidman LJ. Decreased volume of left and total anterior insular lobule in schizophrenia. Schizophr Res. 2006 Apr;83(2-3):155-71
7. Amunts K, Mohlberg H, Bludau S, Zilles K. Julich-Brain: A 3D probabilistic atlas of the human brain's cytoarchitecture. Science. 2020;369(6506):988-992.
8. Edmund T. Rolls, Chu-Chung Huang, Ching-Po Lin, Jianfeng Feng, Marc Joliot, Automated anatomical labelling atlas 3, NeuroImage, Volume 206, 2020, 116189.
9. Buckner, R. L., Krienen, F. M., Castellanos, A., Diaz, J. C., Yeo, B. T. T., & Yeo, T. (2011). The organization of the human cerebellum estimated by intrinsic functional connectivity. Journal of neurophysiology, 2322-45.
10. Tullo, S., Devenyi, G. A., Patel, R., Park, M. T. M., Collins, D. L., & Chakravarty, M. M. (2018). Warping an atlas derived from serial histology to 5 high-resolution MRIs. Scientific data, 5, 180107.
11. Hammers A, Allom R, Koepp MJ, Free SL, Myers R, Lemieux L, Mitchell TN, Brooks DJ, Duncan JS. Three-dimensional maximum probability atlas of the human brain, with particular reference to the temporal lobe. Hum Brain Mapp. 2003 Aug;19(4):224-47.
12. Wang L, Mruczek RE, Arcaro MJ, Kastner S. Probabilistic Maps of Visual Topography in Human Cortex. Cereb Cortex. 2015 Oct;25(10):3911-31.
13. Niaz MR, Ridwan AR, Wu Y; Alzheimer's Disease Neuroimaging Initiative, Bennett DA, Arfanakis K. Development and evaluation of a high resolution 0.5mm isotropic T1-weighted template of the older adult brain. Neuroimage. 2022 Mar;248:118869.
14. Niaz, M. R. (2022). Development and Evaluation of High Resolution MRI Templates and Labels of the MIITRA Atlas (Doctoral dissertation, Illinois Institute of Technology).
Figures