3320
MRI measured Neuroanatomic volume, Cortical Thinning and WMH load with Aging: The Early, Intermediate and Late events of Cognitive status
Neha Yadav1, Arkaprava Majumdar1, and Vivek Tiwari1
1Department of Biological Sciences, Indian Institute of Science Education and Research Berhampur, Berhampur, India
1Department of Biological Sciences, Indian Institute of Science Education and Research Berhampur, Berhampur, India
Synopsis
Keywords: Alzheimer's Disease, Aging
The key to understanding brain-biomarkers depictive of normal cognition and cognitive impairment due to MCI (CI) and/or Alzheimer’s disease (CI-AD) is to identify the series of early, intermediate, and late events that encode brain health. The temporal and spatial order of events of brain health changes observed on MRI, associated with normal aging needs to be precisely delineated from the events associated with cognitive impairment. We have identified early, intermediate and late brain structural and microvascular events distinctive of CN, CI and CI-AD and developed an AI-based platform using an optimal number of MRI features distinctive of cognitive status.INTRODUCTION
Aging is one of the major risks for dementia1. Changes in brain health with normal aging involve a cascade of brain structure, vascular, and microstructural changes over the period that may have similar or distinct kinetics, order, and magnitude than alterations associated with cognitive impairment. The temporal and spatial order of events of brain health changes observed on MRI, associated with normal aging, should be precisely delineated from the order and magnitude of events associated with cognitive impairment due to MCI (CI) and Alzheimer’s disease (CI-AD) as early, intermediate and late events. Advanced neuroimaging and dissection of cerebral small vessel pathologies using magnetic resonance imaging investigations will provide a precise measure of the rate of brain structure atrophy and hypertrophies combined with absolute volumetry and surface measures for delineating the early Brain Biomarkers associated with normal aging and the temporal and spatial changes leading to cognitive impairment (CI) because of MCI and/or Alzheimer’s Disease. Here we have employed a comprehensive segmentation of brain regions for structural and white matter hyperintensity quantification together with Artificial intelligence to establish quantitative and definitive early, intermediate and late biomarkers for identifying cognitive status as CN, CI, and CI-AD.METHODS
Brain segmentation was performed on 3D MPRAGE, T2-FLAIR, and Diffusion-weighted imaging (DWI) to determine neuroanatomic-volume and White matter hyperintensity (WMH) load from cognitively normal (CN, N=1106), cognitively impaired (CI, N=230) and cognitively-impaired subjects with an etiological diagnosis of AD (CI-AD, N=636) in the cohort of National Alzheimer’s Coordinating Center (NACC) with a total of 2642 MRI scans. Volumes of brain regions obtained from segmentation were normalized with total intracranial volume (ICV) using the following equation:Vnorm = (Vestimated /VICV) x Vavg-ICV
Vnorm denotes normalized volume; Vestimated is the volume obtained from segmentation, and Vavg-ICV represents mean ICV. The rate of structural loss and ventricular hypertrophy across CN, CI and CI-AD subjects was determined using a linear regression-based model by setting up the age intercept at 50 years of age for all the 3 cognitive groups. The rate of progression of total WMH load with age across CN, CI, and CI-AD was obtained using an exponential fitting2. Moreover, the mean volumes and thickness were stratified3,4 into three age ranges, that is, 50-64 (early), 65-79 (intermediate), and >80 (late) to pinpoint the magnitude of alterations associated with CI and CI-AD patients compared to the cognitively normal subjects. Using the neuroanatomic volume and thickness, an optimal number of MRI features distinctive of cognitive status was optimized to develop an AI-based predictive platform.
RESULTS and DISCUSSION
Linear regression of MRI determined gray matter (GM) and white matter (WM) volume with age revealed progressive loss wherein the rate of GM and WM loss was slower in CI-AD and CI groups compared to the CN (Fig.1 A,B,C,D). Mean volumetric analysis across the three age groups revealed a significant early decline in GM and WM in CI and CI-AD subjects compared to the CN while GM and WM loss were not distinctive between CI and CI-AD subjects across either of the age groups (Fig.1 E and F). Similarly, a significant reduction in hippocampal volume was distinctive of CI and CI-AD subjects from that of CN at all age groups but lacked sensitivity to distinguish CI and CI-AD subjects at early age groups (Fig.2). Progressive increase in ventricular volume is an early age indicator of CI and CI-AD groups (Fig. 2F). Investigation of medial temporal cortical thickness revealed that thinning of parahippocampal gyrus is an early feature distinctive between CI vs CI-AD (CI:1.91 ± 0.25 vs, CI-AD:1.72 ± 0.28, p <0.001) subjects in addition to clear distinctions from CN (1.98 ± 0.21 ) (Fig.3). Microvascular segmentation showed an exponential increase in deep and periventricular white matter hyperintensity (WMH) load with aging across all three cognitive cohorts. The increase in WMH rate was significantly faster for CI and CI-AD groups compared to CN (Fig.4). WMH load was a distinctive feature between CI and CI-AD subjects in the intermediate and late age groups. A machine learning model based on majority voting was developed using early intermediate and late neuroanatomical changes to predict cognitive status (Fig.5). A combination of 9-MRI features presents a highly precise and accurate prediction of cognitive status (~80%) using a simple random forest method.CONCLUSION
Parahippocampal gyrus thinning accompanied by ventricular increase marks the early feature distinctive of MCI and AD subjects while hippocampal reduction and WMH increase are the intermediate events distinctive of MCI and AD. A combination of 9 MRI-determined neuroanatomic features is predictive of distinct cognitive status. Neuroimaging investigations wrapped in AI provide high accuracy in determining cognitive status and may be used as an advanced tool for the clinical management of normal aging and pathological aging-associated brain health changes.Acknowledgements
MRI and Cognitive data were obtained from The NACC database funded by NIA/NIH Grant U24 AG072122.References
- Stephan Y, Sutin AR, Luchetti M, Terracciano A. Subjective age and risk of incident dementia: Evidence from the National Health and Aging Trends survey. J Psychiatr Res. 2018 May;100:1-4. doi: 10.1016/j.jpsychires.2018.02.008. Epub 2018 Feb 10. PMID: 29471080; PMCID: PMC5866231.
- Garnier-Crussard, A., Bougacha, S., Wirth, M. et al. White matter hyperintensities across the adult lifespan: relation to age, Aβ load, and cognition. Alz Res Therapy 12, 127 (2020). https://doi.org/10.1186/s13195-020-00669-4
- Vardarajan BN, Faber KM, Bird TD, Bennett DA, Rosenberg R, Boeve BF, Graff-Radford NR, Goate AM, Farlow M, Sweet RA, Lantigua R, Medrano MZ, Ottman R, Schaid DJ, Foroud TM, Mayeux R; NIA-LOAD/NCRAD Family Study Group. Age-specific incidence rates for dementia and Alzheimer disease in NIA-LOAD/NCRAD and EFIGA families: National Institute on Aging Genetics Initiative for Late-Onset Alzheimer Disease/National Cell Repository for Alzheimer Disease (NIA-LOAD/NCRAD) and Estudio Familiar de Influencia Genetica en Alzheimer (EFIGA). JAMA Neurol. 2014 Mar;71(3):315-23. doi: 10.1001/jamaneurol.2013.5570. PMID: 24425039; PMCID: PMC4000602.
- Geifman N, Cohen R, Rubin E. Redefining meaningful age groups in the context of disease. Age (Dordr). 2013 Dec;35(6):2357-66. doi: 10.1007/s11357-013-9510-6. Epub 2013 Jan 27. PMID: 23354682; PMCID: PMC3825015.
Figures
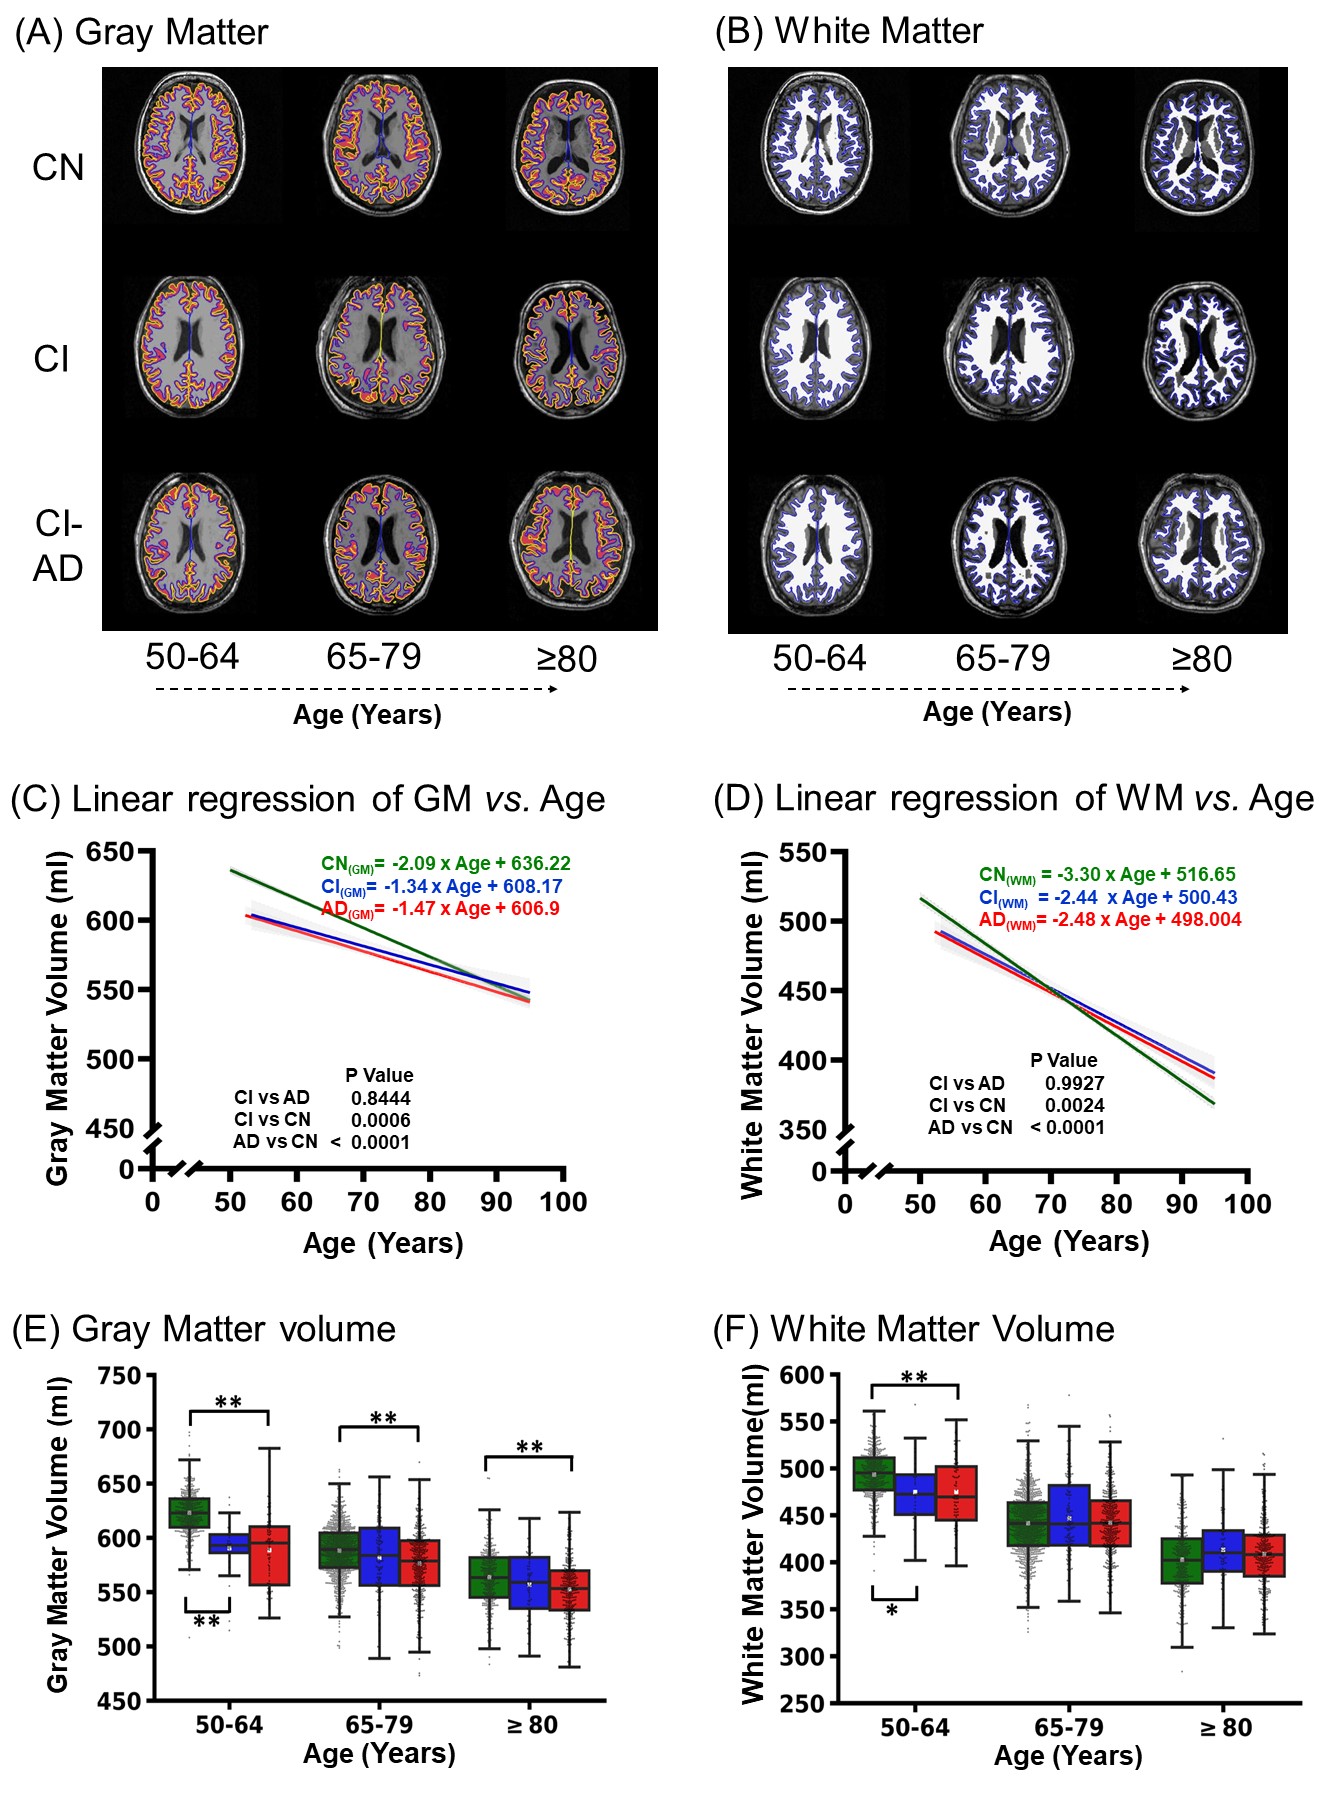
Fig.1-Loss of Gray matter volume and White matter volume with age across CN, CI, and CI-AD subjects. MRI segmented mask of (A) gray matter, (B) white matter on T1w MRI for 3 age groups (C, D) Linear regression of volume of GM and WM with age. Statistical significance for multiple comparisons was corrected using the Tukey method. (E, F) The mean volume of Normalised gray matter and white matter across early, intermediate and late age groups was compared using an independent two-tailed t-test followed by Bonferroni correction. White square in box plot represents the mean. * p<0.016, **p<0.001
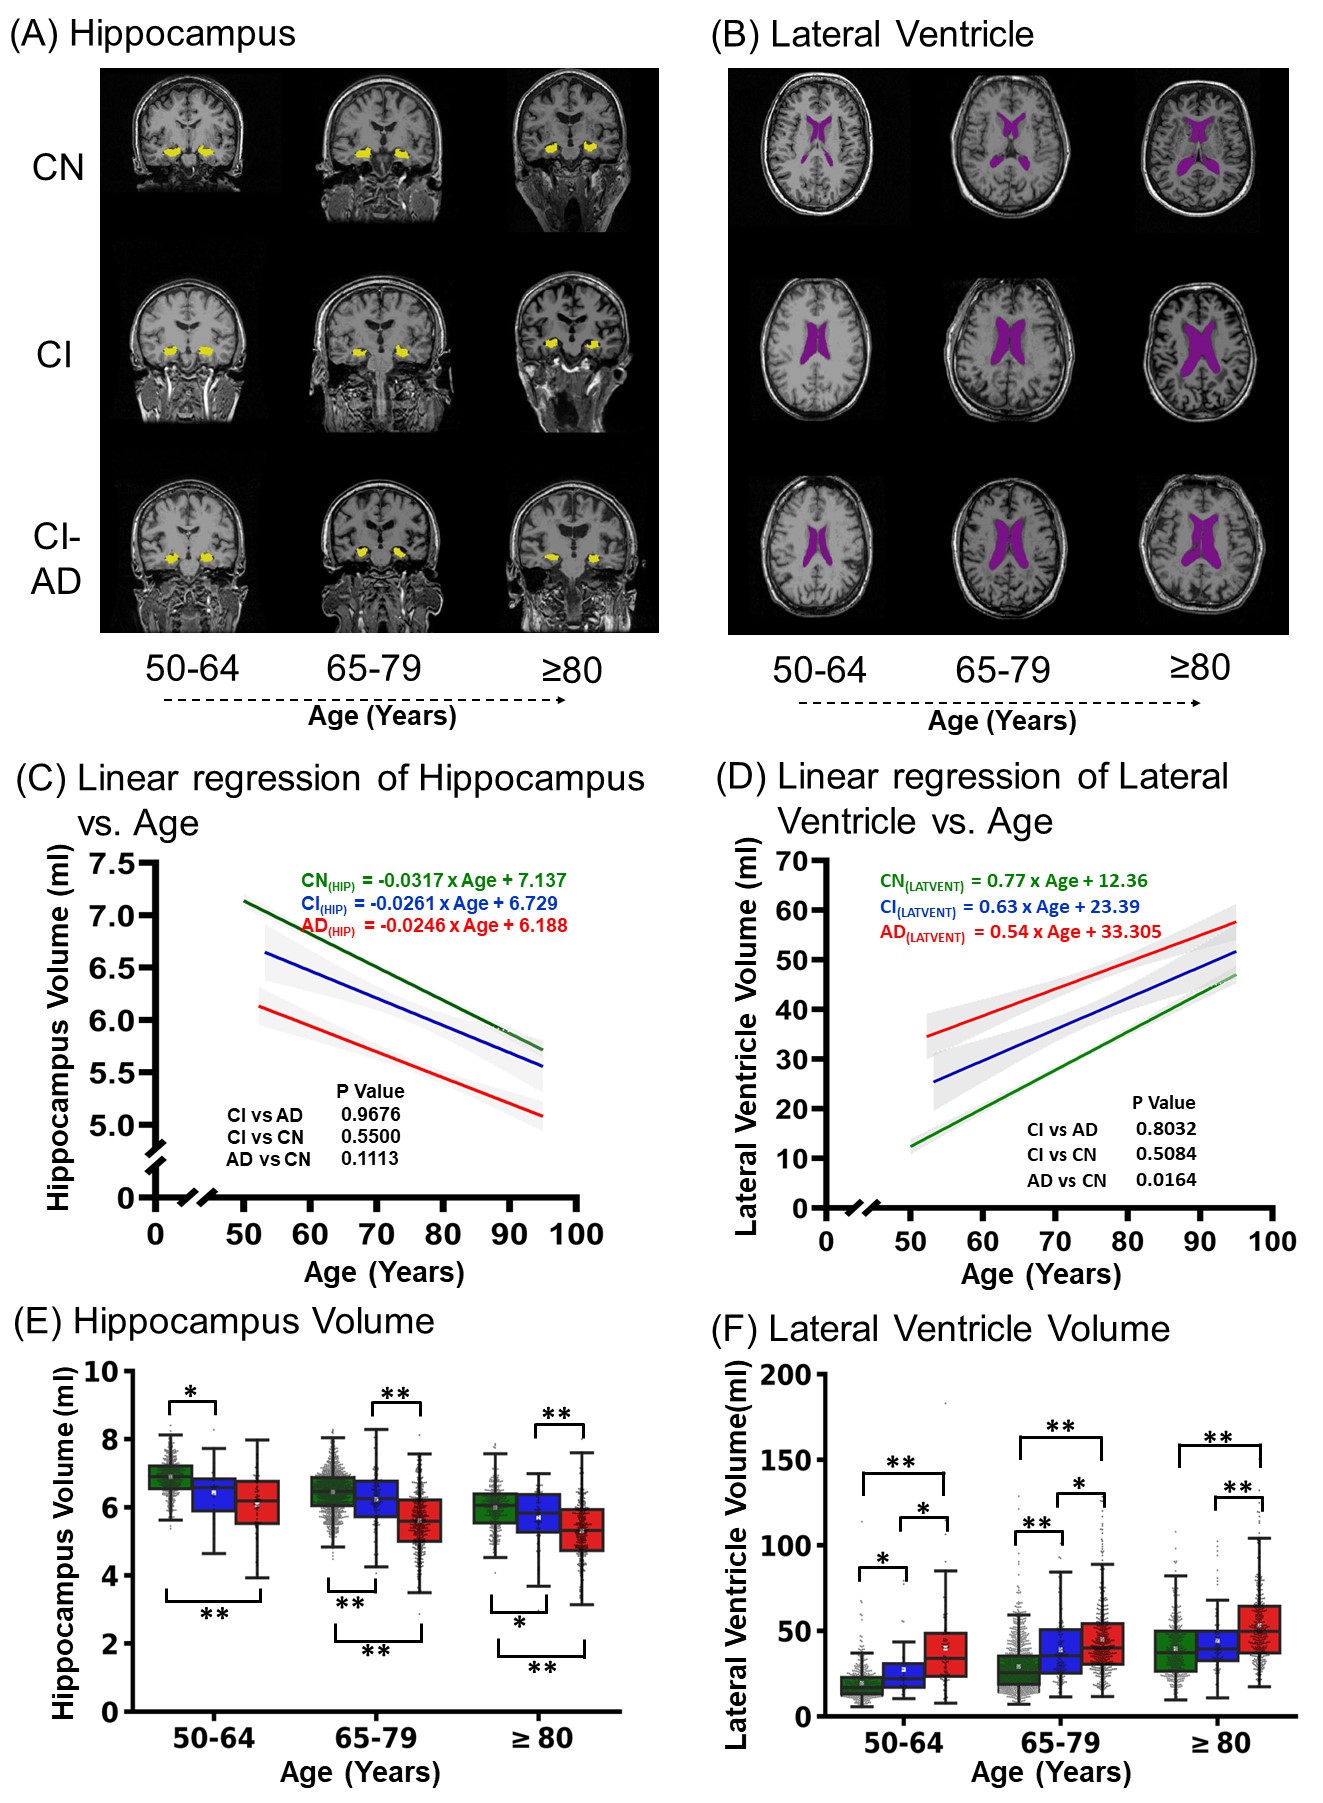
Fig.2-The distinct temporal decline of hippocampus volume and ventricular hypertrophy with age across CN, CI, and CI-AD subjects-(A,B) Hippocampus and ventricular mask on T1w image. Linear regression of (C) hippocampus and (D) lateral ventricle volume was performed by setting up the age intercept at 50 years. Statistical significance for the multiple comparisons was corrected using the Tukey method. Box plot showing the median and the mean volume of (E)hippocampus and the (F)lateral ventricle across early, intermediate and late age groups. * p<0.016, **p<0.001
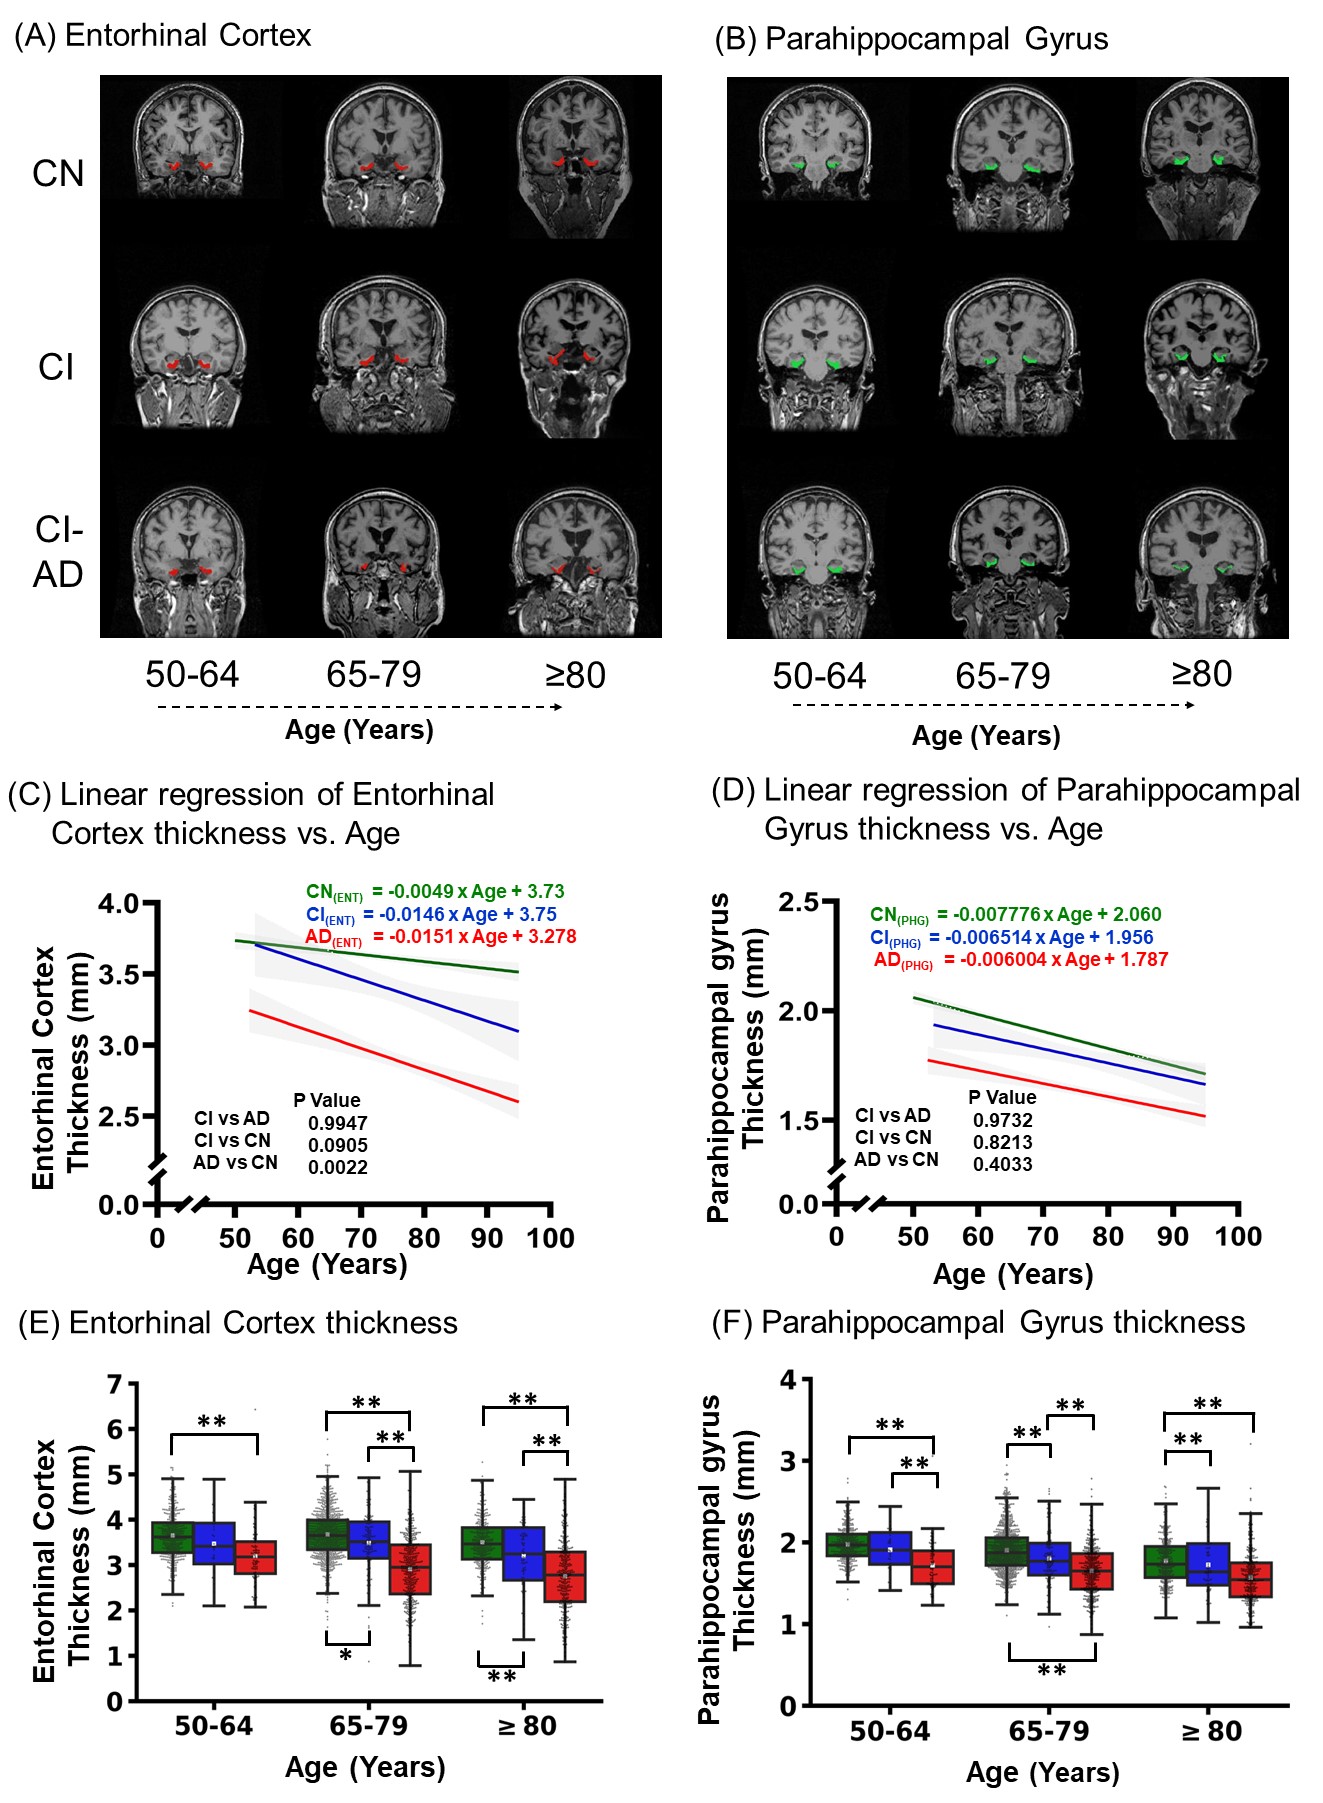
Fig.3-Cortical thinning with age across CN, CI, and CI-AD subjects. (A) Entorhinal cortex thickness and (B) Para hippocampal gyrus thickness mask on T1w coronal section from CN, CI, and CI-AD subjects at the 3 age groups. Linear regression of entorhinal cortex (C) and parahippocampal gyrus thickness (D) with age (intercept set at 50 years). The mean thickness of the entorhinal cortex (E) and parahippocampal gyrus (F) stratified across the early, intermediate, and late age groups of CN, CI, and CI-AD subjects. * p<0.016, **p<0.001
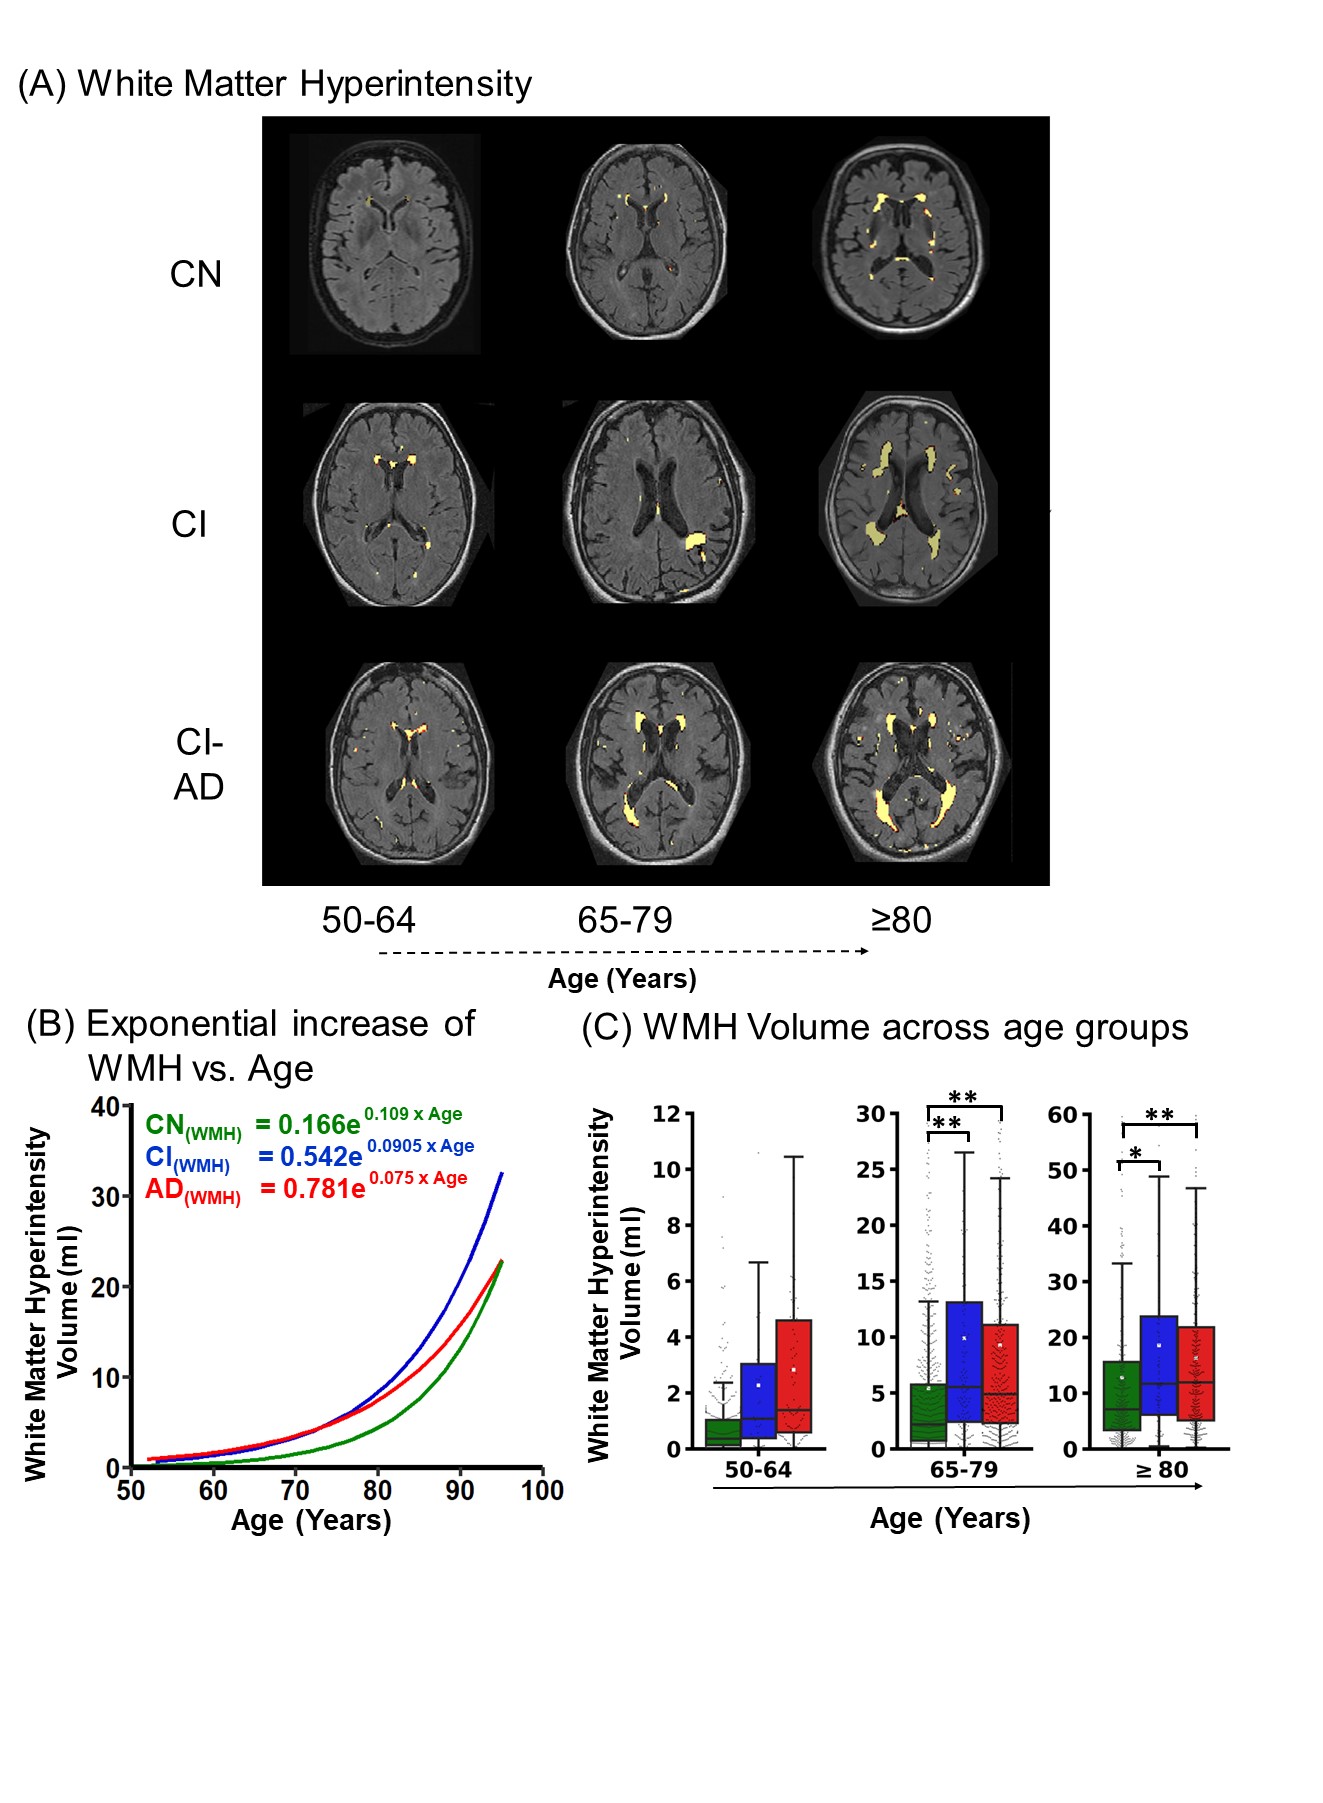
Fig.4-The increase in WMH load across CN, CI, and AD subjects with age. (A)WMH load mask on T1w for the three age groups. (B)The increase in WMH with age is shown by an exponential curve. (C) Box plot showing the mean and median WMH load for 3 age groups. * p<0.016, **p<0.001.
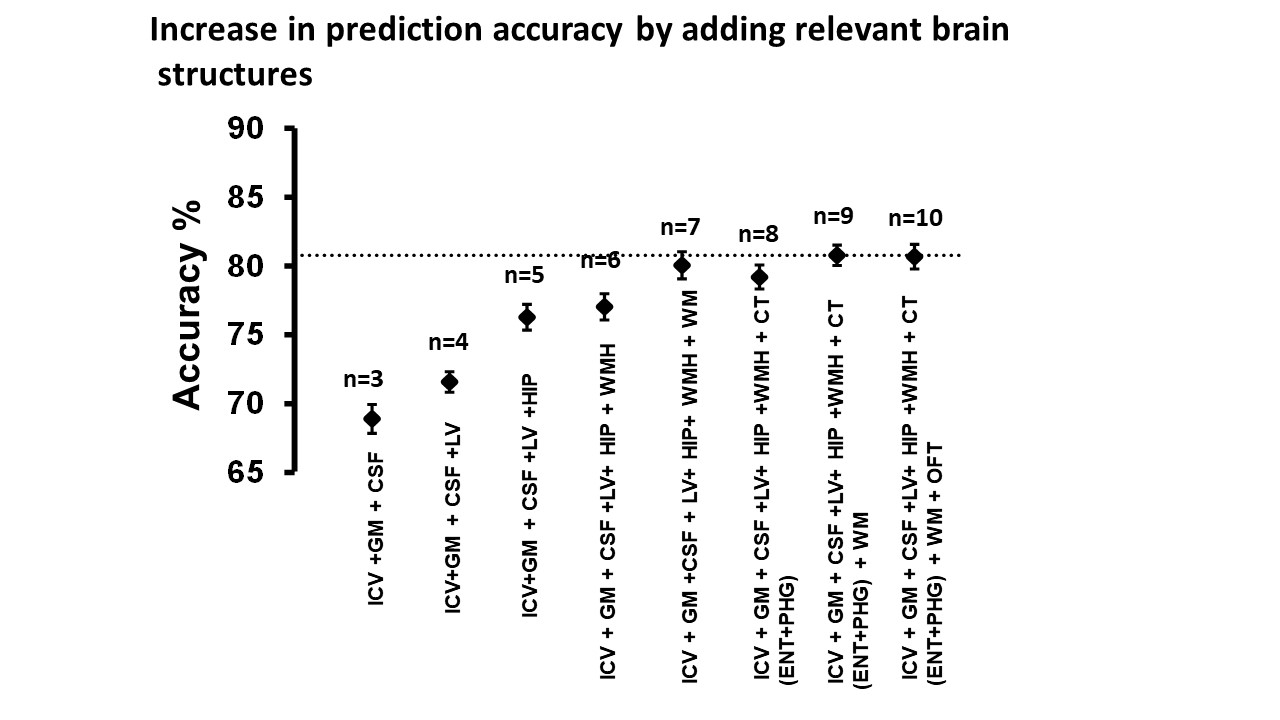
Fig.5-Summary of the Machine learning algorithm performance in predicting the cognitive status of the participants based on the MRI-segmented brain volume and thickness and age. Parameters are added gradually to check for the increase in the accuracy of the model. *GM=gray matter, CSF=cerebrospinal fluid, LV=Lateral Ventricle, HIP=Hippocampus, WMH=White Matter Hyperintensity, WM=White Matter, CT=Cortical thicknesses (Entorhinal cortex(ENT) and Parahippocampal Gyrus(PHG)), OFT= orbitofrontal cortex
DOI: https://doi.org/10.58530/2023/3320