3319
MRI phenotypes of the brain are related to long-term dementia outcome in community-dwelling older adults
Jasmin A. Keller1, Sigurdur Sigurdsson 2, Bárbara Schmitz Abecassis 1, Ilse M.J. Kant 3,4, Mark A. van Buchem1, Lenore J. Launer5, Matthias J.P. van Osch1, Vilmundur Gudnason2,6, and Jeroen H.J.M. de Bresser1
1Department of Radiology, Leiden University Medical Center, Leiden, Netherlands, 2Icelandic Heart Association, Kopavogur, Iceland, 3Clinical Artificial Intelligence Implementation and Research Lab (CAIRELab) and Department of Information Technology & Digital Innovation, Leiden University Medical Center, Leiden, Netherlands, 4Department of Digital Health, University Medical Center Utrecht, Utrecht, Netherlands, 5Laboratory of Epidemiology and Population Science, National Institute on Aging, Bethesda, MD, United States, 6Faculty of Medicine, University of Iceland, Reykjavik, Iceland
1Department of Radiology, Leiden University Medical Center, Leiden, Netherlands, 2Icelandic Heart Association, Kopavogur, Iceland, 3Clinical Artificial Intelligence Implementation and Research Lab (CAIRELab) and Department of Information Technology & Digital Innovation, Leiden University Medical Center, Leiden, Netherlands, 4Department of Digital Health, University Medical Center Utrecht, Utrecht, Netherlands, 5Laboratory of Epidemiology and Population Science, National Institute on Aging, Bethesda, MD, United States, 6Faculty of Medicine, University of Iceland, Reykjavik, Iceland
Synopsis
Keywords: Dementia, Aging, Cerebral small vessel disease
Individual brain MRI markers only show at best a modest association with long-term occurrence of dementia. Therefore, it is challenging to accurately identify individuals at increased risk for dementia. We implemented a combined hierarchical clustering analysis based on neurodegenerative and neurovascular brain MRI markers and identified 14 distinct subgroups of individuals with different brain MRI phenotypes. These subgroups had a different long-term risk for dementia; especially the multi-burden brain MRI phenotype showed an increased risk (HR: 13.8 (95%-CI:4.28-44.37)). These findings may in the future be useful to determine patient prognosis and may aid in patient selection for future treatment studies.Introduction
Most older adults have brain changes on MRI, such as manifestations of neurodegenerative diseases and cerebral small vessel disease (SVD)1 (for example white matter hyperintensities (WMHs) or lacunes). However, individual brain MRI markers only show at best a modest association with long-term occurrence of dementia2. It, therefore, remains challenging to identify individuals who are at increased risk to develop dementia3. Due to heterogenous etiology and mixed pathologies, methods combining different brain MRI markers may likely aid in a more detailed characterization of potential prognostically relevant so called brain MRI phenotypes. We, therefore, aimed to identify different brain MRI phenotypes by combined hierarchical clustering analysis based on neurodegenerative and neurovascular brain MRI markers in community-dwelling individuals. Within each of these brain MRI phenotype subgroups, we determined the long-term dementia risk.Methods
Participants & study designThe dataset used for the current analysis is part of the AGES Reykjavik study4 (n = 3056). At baseline, FLAIR and T1-weighted brain MRI scans were acquired on a 1.5 Tesla Signa Twinspeed system (General Electric Medical Systems, Waukesha, Wisconsin). Dementia outcome was determined as a binary variable (yes/no) by contacting the nursing homes 10.2 ± 2.4 years after the baseline MRI scan. The inclusion and exclusion of participants from the AGES-Reykjavik study for the current study is illustrated in figure 1. Participants who were demented at baseline were excluded from the analyses.
Cluster analysis
The brain MRI markers used to determine the brain MRI phenotypes were brain volumes for the estimation of brain atrophy (brain parenchymal fraction, white matter fraction, grey matter fraction, and lateral ventricle fraction), WMH markers (periventricular/confluent WMH fraction per lobe, deep WMH fraction per lobe, and the WMH shape parameters fractal dimension, solidity, convexity, concavity index and eccentricity5), brain infarcts (subcortical, cerebellar and cortical infarcts), microbleeds, and enlarged perivascular spaces (PVS). Brain MRI markers were normalized as z-scores (after multiplication by 100 and natural log transformation when not normally distributed), or otherwise scaled between -2 and 2. Hierarchical clustering was performed applying Ward’s method in R version 4.1.0 (R Core Team, 2021) and packages Nbclust 6, factoextra 7, cluster 8, and dendextend9. The dendrogram cut-off was determined using the Dunn index and the heatmap (see figure 2).
Statistical analysis
Cardiovascular risk factors were compared between subgroups with chi-square test for binary variables and one-way ANOVAs for continuous variables. Cox regression was used to estimate the risk of future dementia occurrence within the brain MRI phenotype subgroups (adjusted for age and sex). The reference group was chosen based on having the fewest brain abnormalities. SPSS version 25 (Chicago, IL) was used for the analysis.
Results
The optimal cut-off of the hierarchical clustering model was determined to be at 14 subgroups (figure 2). The main MRI markers per subgroup (S) are illustrated in figure 3. The brain MRI phenotypes of the subgroups ranged from limited burden (S12), mostly atrophy and infarcts (S14), mostly irregularly shaped WMH and atrophy (S3) to a multi-burden subgroup (S2). Baseline characteristics of the study sample per subgroup are shown in Table 1. Subgroup S12 was determined to have the least brain abnormalities and was used as the reference in the survival analysis (Figure 4). Baseline characteristics differed significantly between subgroups (Table 1). Dementia cases at follow-up ranged from 2% to 46% per subgroup. The range of hazard ratios across the subgroups is 4.1-13.8. The multi-burden subgroup S10 showed the largest hazard ratio of 13.8 (95% CI: 4.28-44.37) compared to the reference group (S12).Discussion
We showed that distinct brain MRI phenotypes can be identified in community-dwelling older adults. Subgroups showed a different risk of developing dementia in the future, with an increased risk especially in individuals in the multi-burden brain pathology subgroup compared to a limited-burden subgroup. Identification of different brain MRI phenotypes can lead to novel insights into the MRI correlates of dementia predisposition. Our results revealed 14 distinct subgroups of individuals with different distributions of brain MRI markers of neurodegenerative and neurovascular disease. These findings may in the future be useful in determining patient prognosis and may aid in patient selection for future treatment studies.Acknowledgements
This research was funded by an Alzheimer Nederland grant (WE.03-2019-08).References
- Wardlaw JM, Smith EE, Biessels GJ et al. Neuroimaging standards for research into small vessel disease and its contribution to ageing and neurodegeneration. Lancet Neurol. 2013;12(8):822-38.
- Bos D, Wolters FJ, Darweesh SKL et al. Cerebral small vessel disease and the risk of dementia: A systematic review and meta-analysis of population-based evidence. Alzheimers Dement. 2018;14(11):1482-1492.
- Alber J, Alladi S, Bae HJ et al. White matter hyperintensities in vascular contributions to cognitive impairment and dementia (VCID): Knowledge gaps and opportunities. Alzheimers Dement (N Y). 2019;5:107-117.
- Harris TB, Launer LJ, Eiriksdottir G et al. Age, Gene/Environment Susceptibility-Reykjavik Study: multidisciplinary applied phenomics. Am J Epidemiol. 2007 May 1;165(9):1076-87.
- Keller JA, Sigurdsson S, Klaassen K et al. A more irregular white matter hyperintensity shape is associated with increased long-term dementia risk in community dwelling older adults: The AGES Reykjavik Study. Submitted 2022.
- Charrad M, Ghazzali N, Boiteau V et al. NbClust: An R Package for Determining the Relevant Number of Clusters in a Data Set. Journal of Statistical Software. 2014;61(6):1-36.
- Kassambara A. FactoExtra: Extract and Visualize the Results of Multivari- ate Data Analyses for R, version 1.0.7. 2020.
- Maechler M, Rousseeuw P, Struyf A et al. Package “cluster”: R package version 2.1.2. 2021.
- Galili T. dendextend: an R package for visualizing, adjusting and comparing trees of hierarchical clustering. Bioinformatics. 2015 Nov 15;31(22):3718-20.
Figures
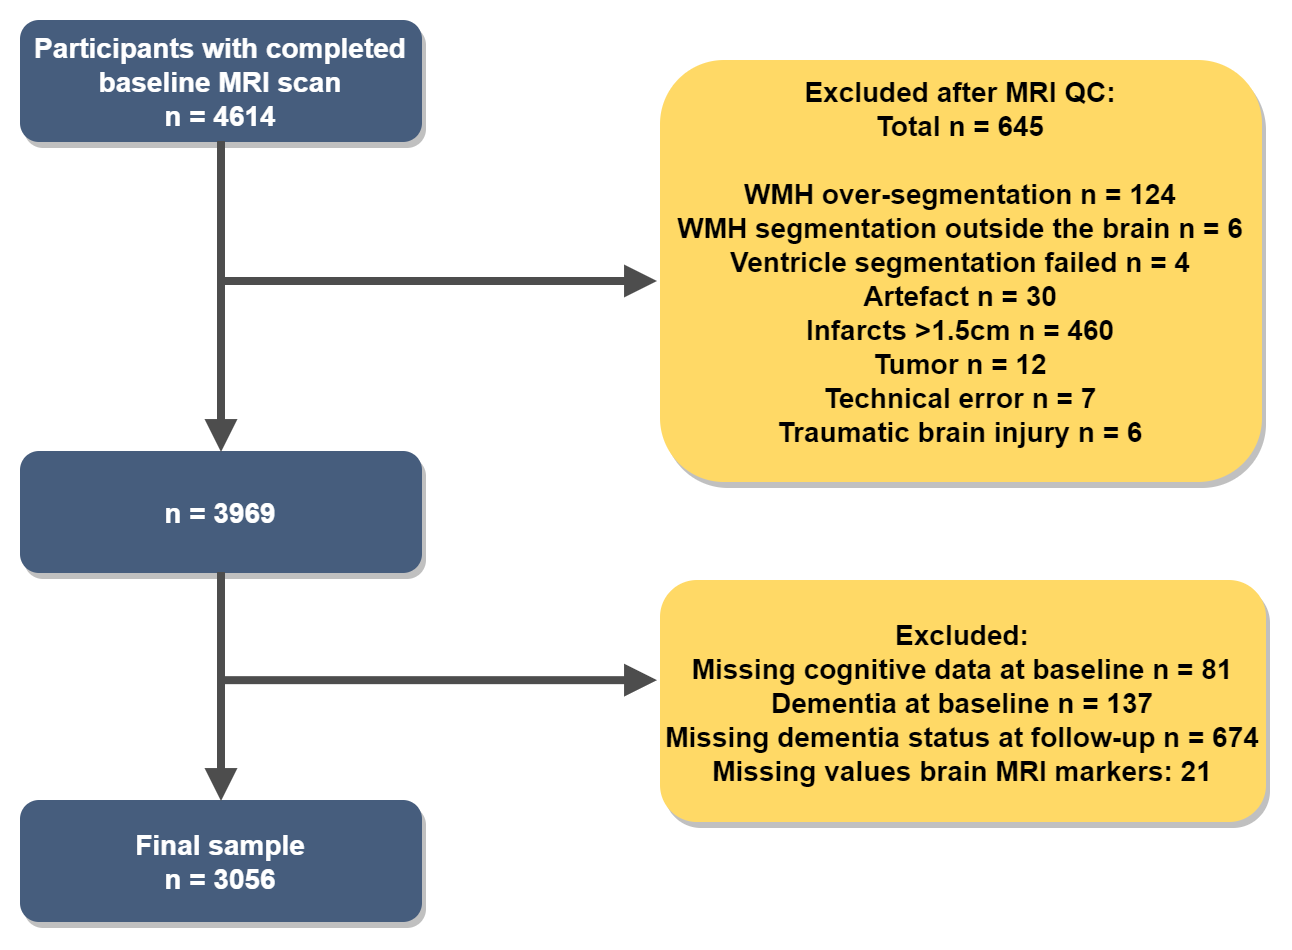
Figure 1. Flowchart illustrating the inclusion and
exclusion of participants.
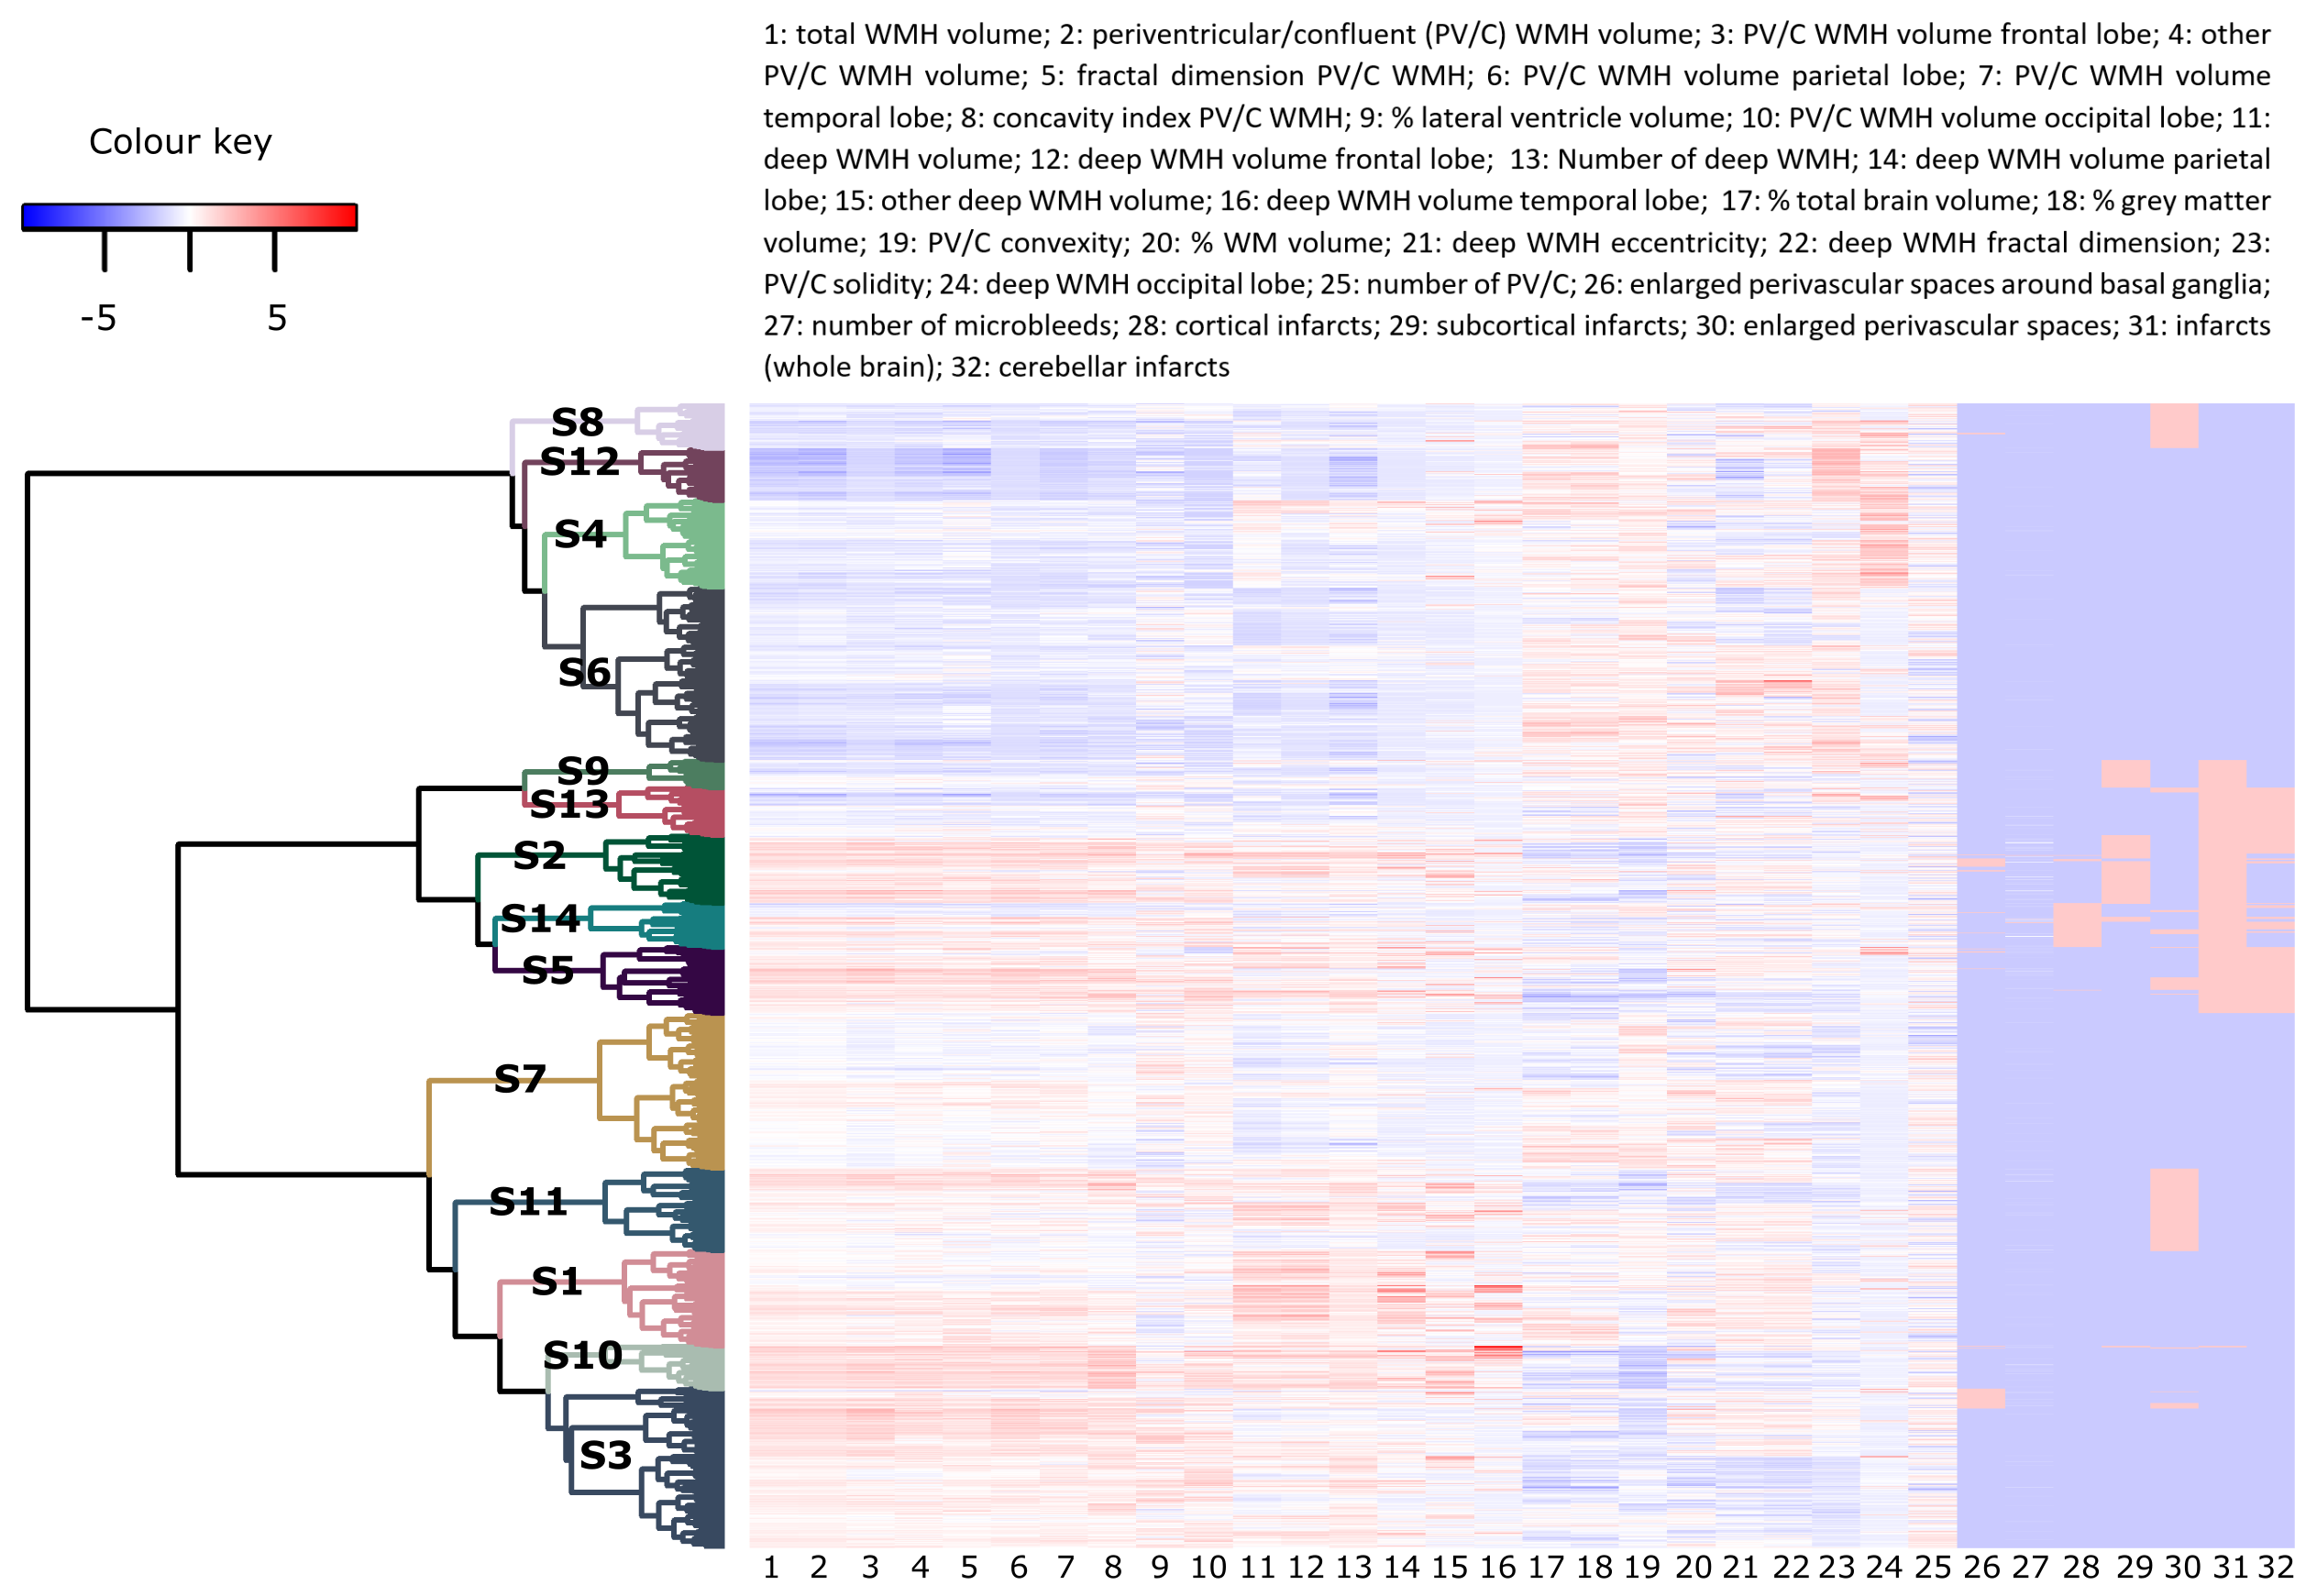
Figure
2. Heatmap and
dendrogram: results of the hierarchical clustering analysis. S: subgroup; WMH:
white matter hyperintensity; WM: white matter; PV/C: periventricular/confluent.
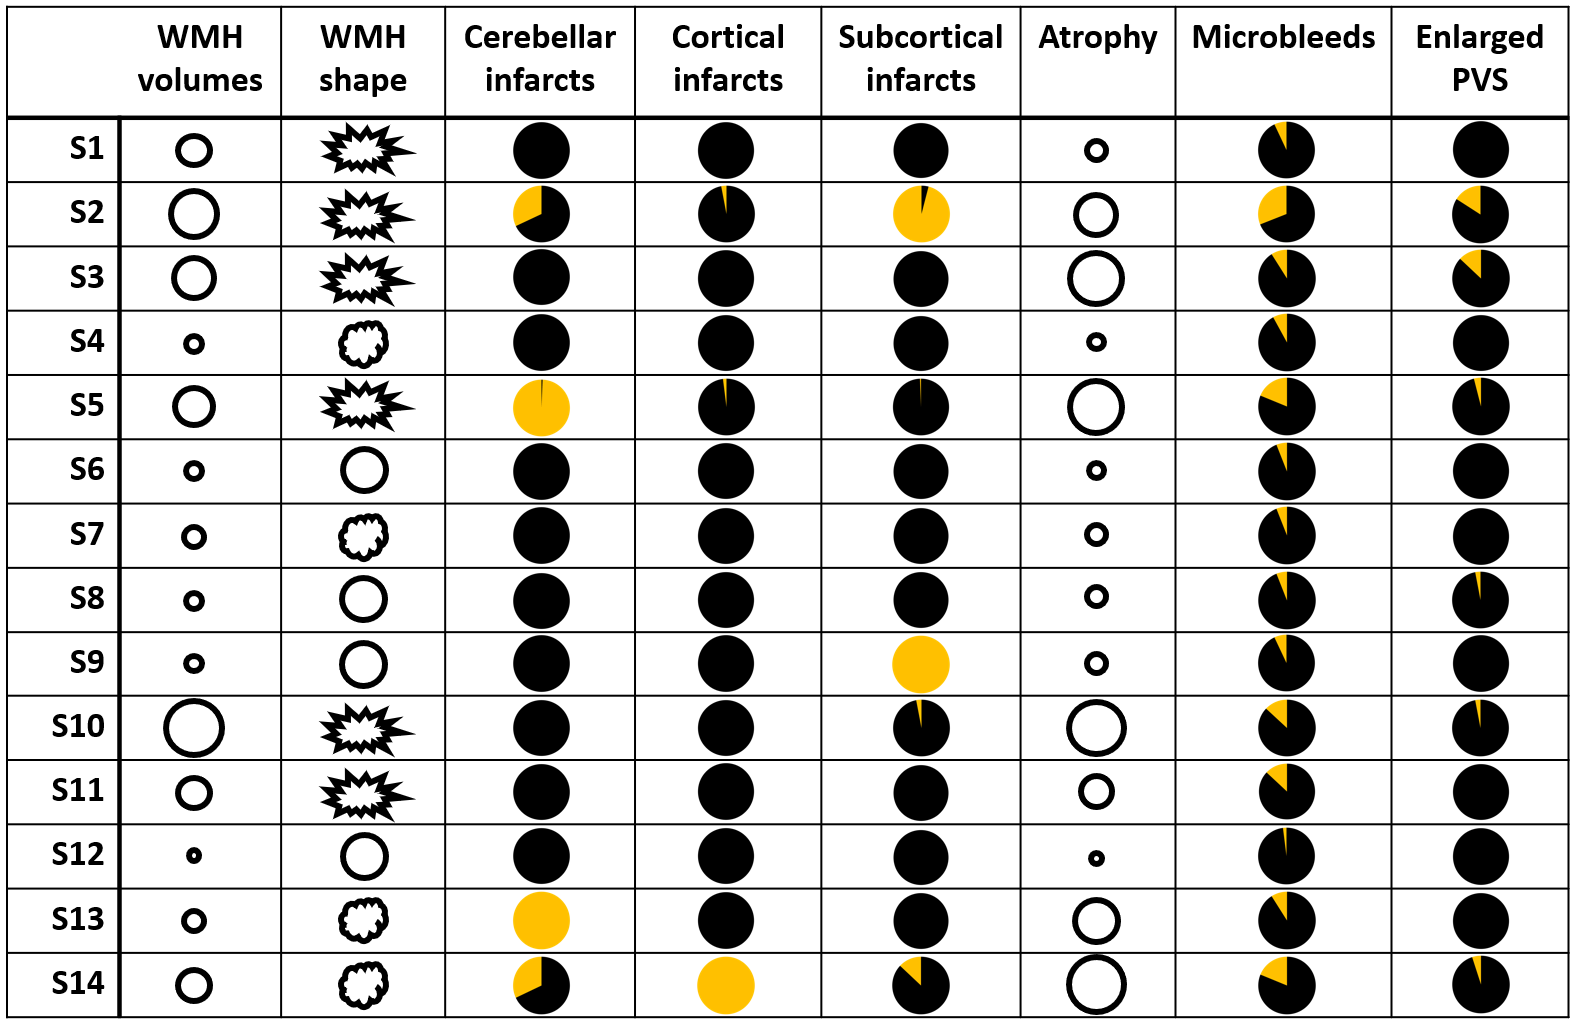
Figure
3. Symbolic
illustration of the MRI markers per cluster. Small circles indicate low WMH volumes or atrophy. Big circles indicate high WMH volumes or atrophy. WMH shape is illustrated with symbols with three different degrees of shape irregularity. Pie charts indicate percentage of subjects with infarcts, enlarged PVS or microbleeds. S: subgroup; WMH: white matter
hyperintensity; enlarged PVS: enlarged perivascular spaces in the basal ganglia.
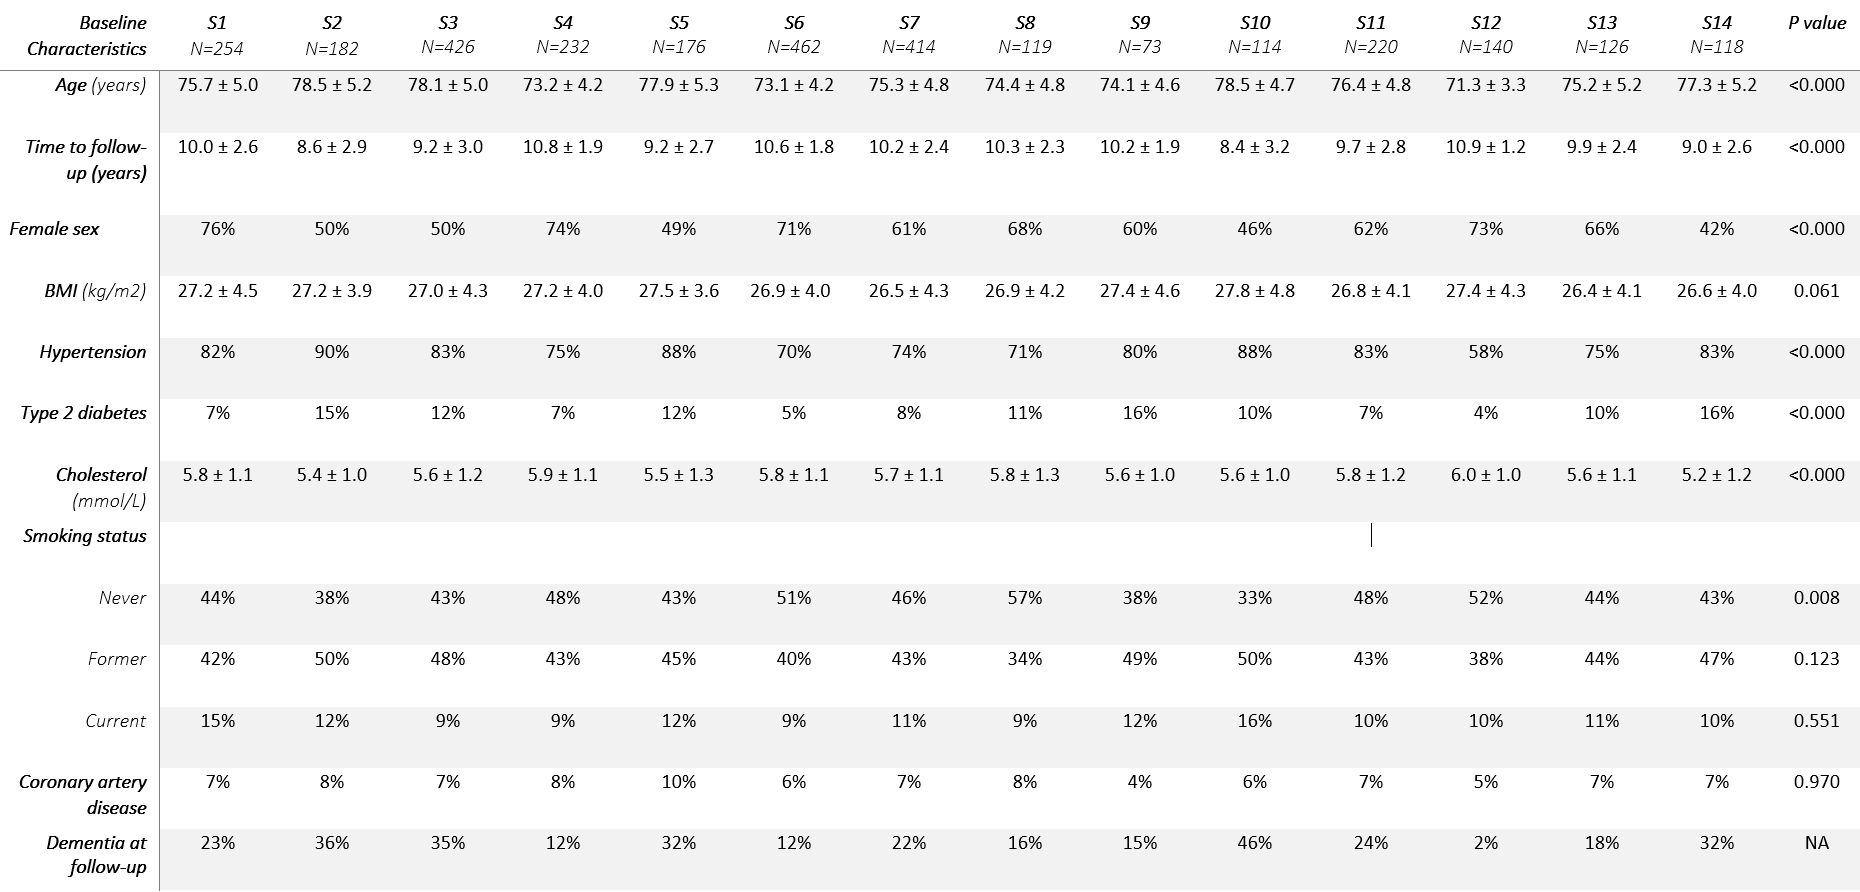
Table 1. Baseline characteristics of the
study sample per subgroup. S: subgroup; BMI: body mass index.
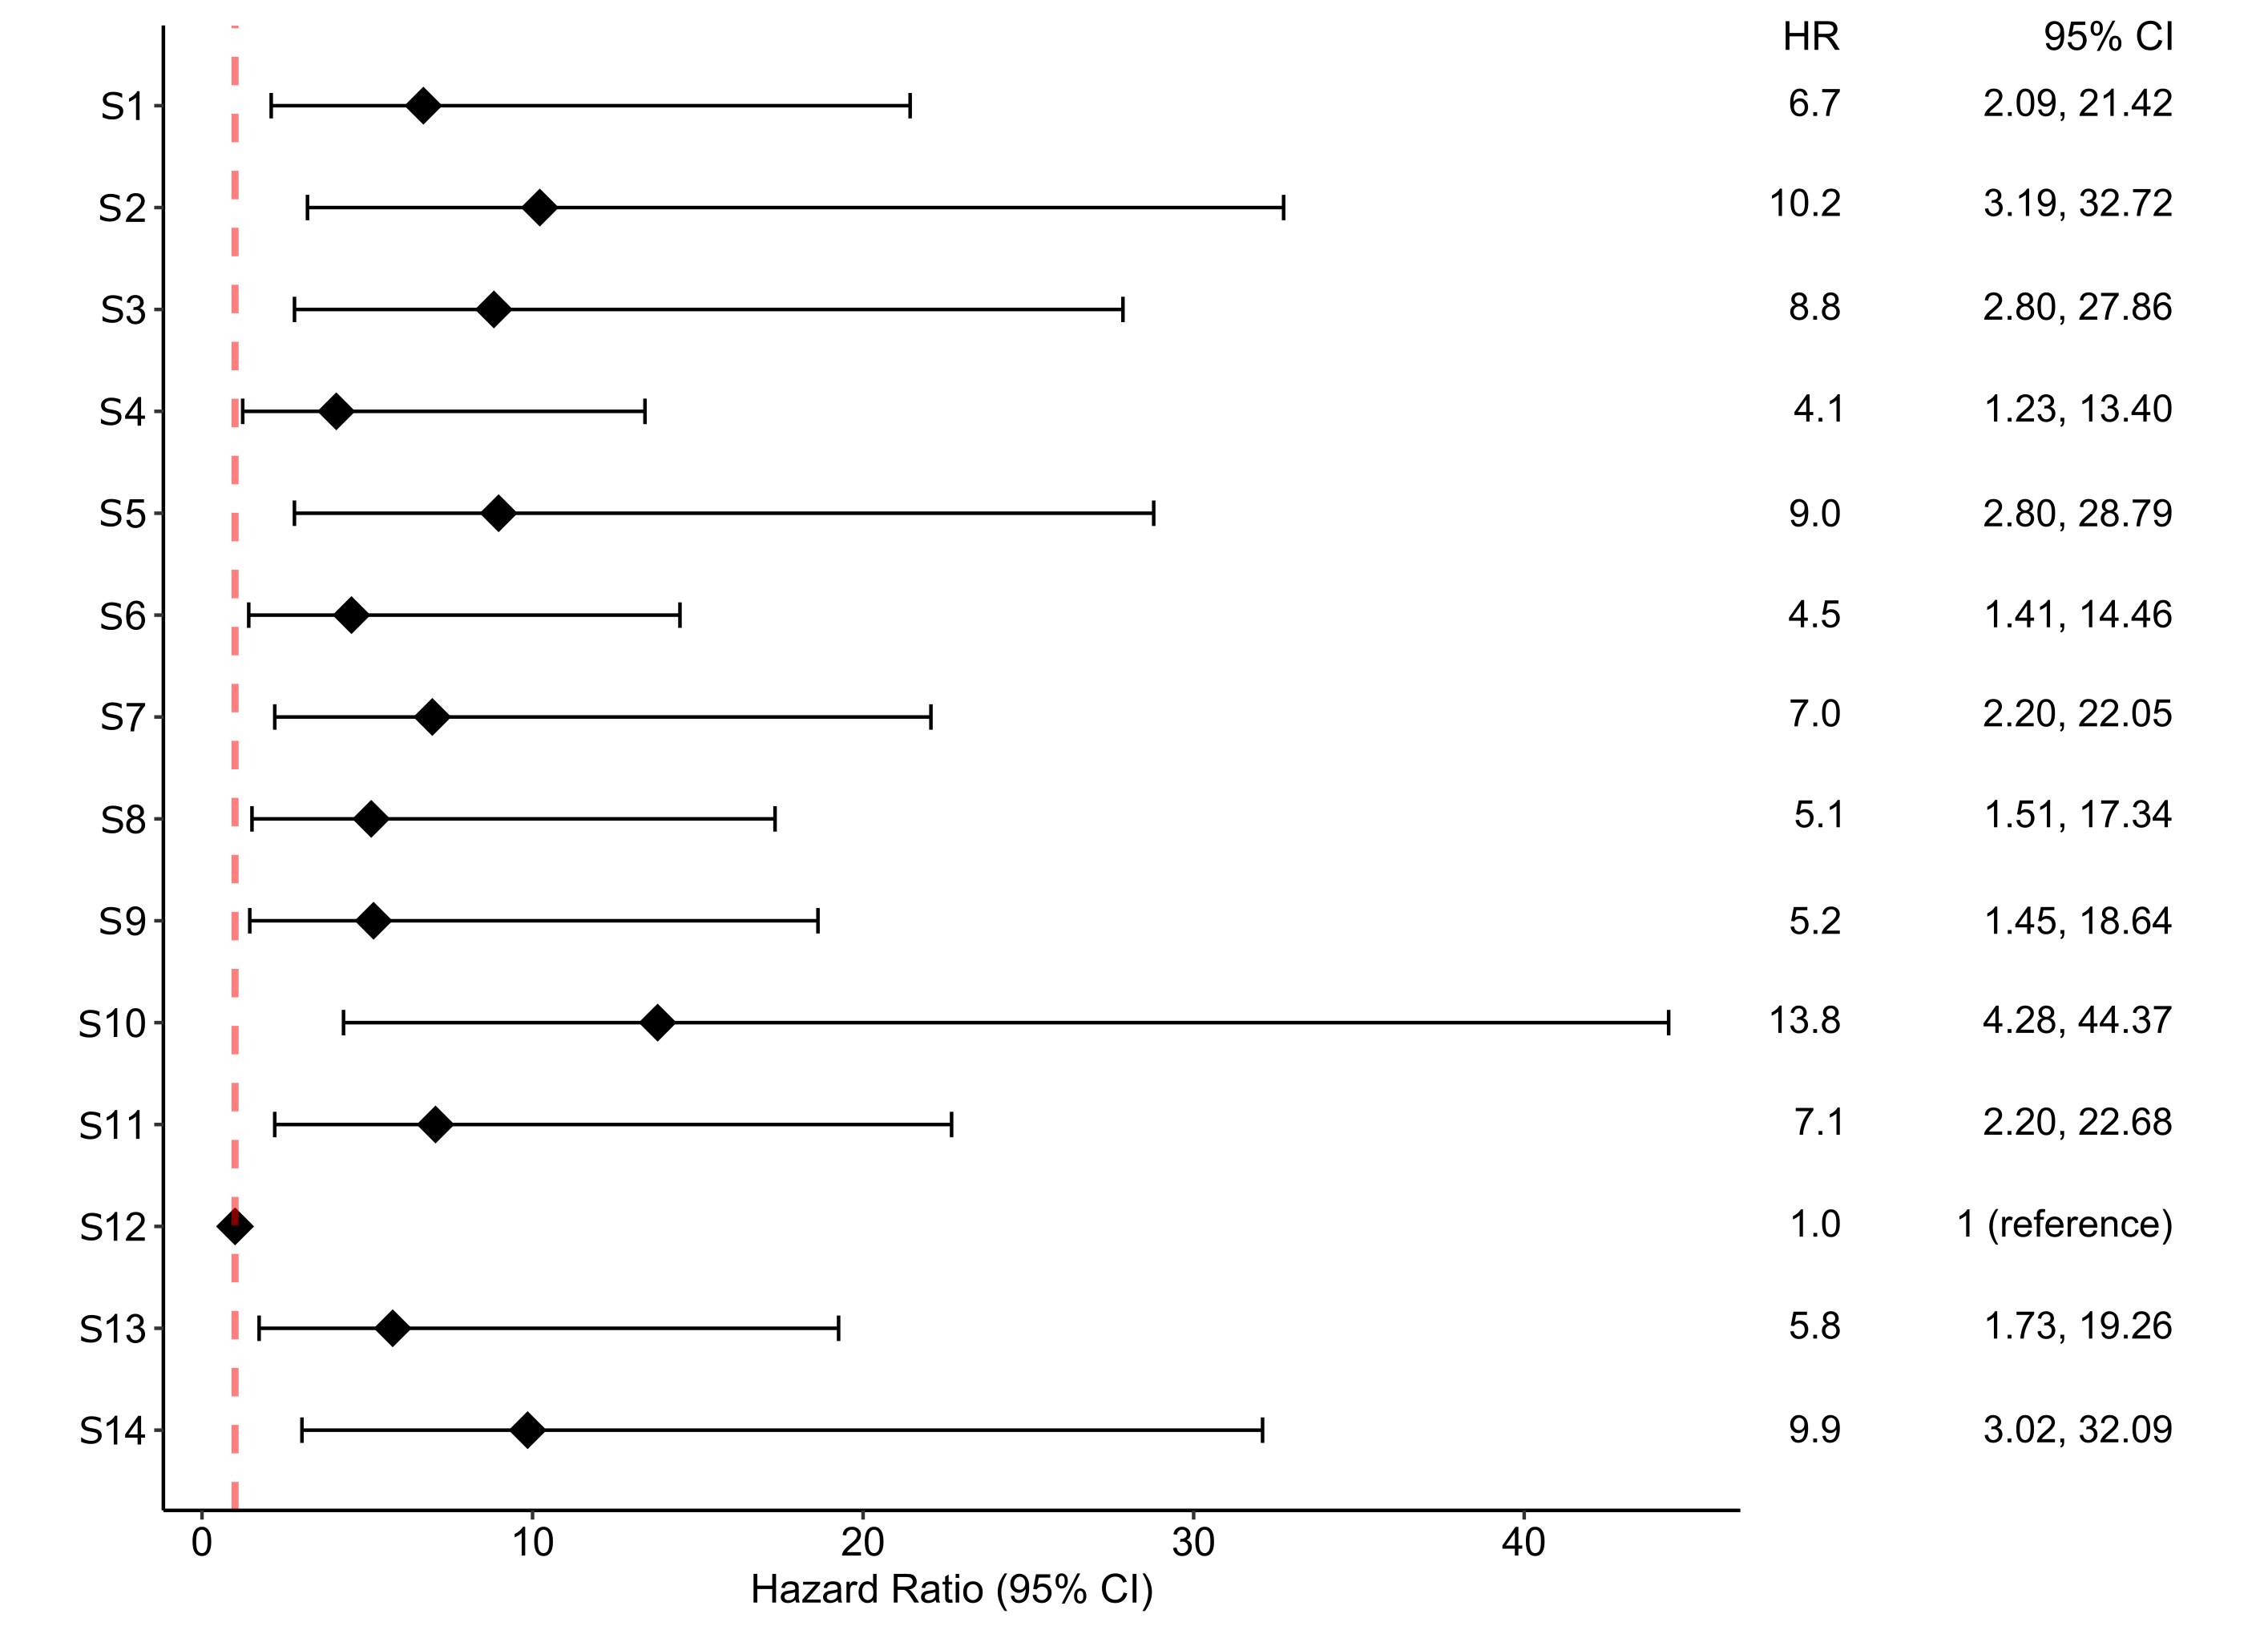
Figure 4. Hazard ratios per subgroup. S:
subgroup; HR: hazard ratio; CI: confidence interval.
DOI: https://doi.org/10.58530/2023/3319