3317
Network analysis of Alzheimer’s disease using group cohesive parcellation of rsfMRI
Ajay Nemani1 and Mark Lowe1
1Cleveland Clinic, Cleveland, OH, United States
1Cleveland Clinic, Cleveland, OH, United States
Synopsis
Keywords: Alzheimer's Disease, fMRI (resting state), Parcellation, Network Modelling
The search for rsfMRI-based network biomarkers in Alzheimer's disease has yielded inconsistent results. These models are derived from standard anatomical and functional parcellations that may bias downstream analyses. We present a network model of Alzheimer's disease based on cohesive parcellation and compare it to traditional measures of network topology.
Introduction
The subtle progression of Alzheimer’s disease (AD) begins several years before the onset of clinically detectable cognitive impairment. This has driven several efforts to find and characterize biomarkers for early diagnosis, risk assessment, and progression. Normal cognition depends on the healthy function of underlying brain networks. Brain modeling based on resting state functional imaging (rsfMRI) is a powerful tool for mapping and characterizing such networks, yet the search for rsfMI-based network metrics has yielded inconsistent results1,2.Brain network models are not normally studied at native voxel resolution. Instead, these methods depend heavily on parcellation to define network nodes. Typically, an exemplar time series based on the average of all voxels within a parcel is extracted and used to model connections between these parcel-defined nodes, creating a reduced representation of the data for downstream modeling. Several classic anatomically and functionally derived parcellations have been used, but none of them reflect this exemplar-based approach, potentially biasing derived models and thus leading to inconsistent results. We have recently introduced cohesive parcellation, a data-driven parcellation designed for optimal downstream, exemplar-based analyses3. Here we show how cohesion-focused network analysis may reveal a stronger and more consistent changes than traditional network measures.
Methods
20 AD patients and 10 cognitively normal (CN) controls were imaged on a Siemens 3T Prisma (Erlangen, Germany). Whole brain rsfMRI data were acquired (64 axial slices, 88x88 matrix, 2.5 mm isotropic voxels, TE/TR = 32/607 ms, 976 volumes, 50 deg flip, SMS=8) along with high resolution T1w images for anatomical context and dual echo field GRE maps for distortion correction. rsfMRI data were corrected for motion4, physiologically-based nuisances5, and B0 distortions. Anatomical data were registered to both their corresponding functional data and the 2 mm MNI template. All data were then warped to this common space and smoothed with an isotropic 2 mm FWHM Gaussian kernel. The data were temporally filtered with a quadratic detrend and a 0.01 – 0.10 Hz bandpass filter.The data were then parcellated using group-based version of cohesive parcellation3 with a cohesion threshold of 0.5. Parcel exemplars were calculated based on the mean of voxel member time courses and used to construct a graph-based network model, with edges defined by the correlation between network exemplars. All edges below 0.5 correlation were removed, and the largest connected component extracted. Several node-based and global graph-theoretic measures were calculated6. Nodal measures include cohesion, path length, efficiency, and clustering coefficient. Global measures include average path length, global efficiency, transitivity, clustering. Small world coefficient and measure were also calculated using 1000 lattice-preserving graph randomizations. Two-tailed t-tests were calculated between the AD and CN groups.
Results
Group cohesive parcellation generated 2011 parcels for network modeling, which represents a fairly high degree of fragmentation. Figure 1 shows a montage of this cohesive parcellation. Figures 2, 3, and 4 show the network modeling results for nodal, global and small worldness measures, respectively. The only significant difference between AD and CN groups (p < 0.05) was cohesion and to a smaller extent, small world measure.Discussion
Previous studies have shown a decrease in small worldness in AD patients, indicating that global degeneration of gray matter generally leads to a more random network topology7. We reproduce that result using cohesive parcellation. Additionally, previous studies have indicated AD patients show altered efficiency and clustering coefficient8, but these results have not been consistent9. Those differences were not detected using a cohesive parcellation.In contrast, cohesion as a nodal network measure showed a strong decrease in the AD group. As the cohesion threshold was fixed at 0.5, this indicates a more fragmented organization of intrinsic connectivity in AD patients, requiring a large amount of parcels to encapsulate cohesive nodes. This is consistent with the kind of large scale degeneration seen in AD.
Conclusion
We demonstrate how cohesive parcellation can be exploited to reveal network differences between AD patients and CN controls. Cohesive measures may serve as a potential biomarker for AD, or alternatively, cohesive parcellation may represent a more robust basis to generate parcels for downstream, exemplar-based network modeling, potentially yielding more consistent results. Future efforts will be directed at looking at regional differences in network degeneration based on cohesion, including an exploration of default mode network-specific alterations, which has been strongly implicated in AD10.Acknowledgements
No acknowledgement found.References
1. Fornito, A. et al. Graph analysis of the human connectome: promise, progress, and pitfalls. Neuroimage 2013; 80:426–444.2. Jacobs H, et al. Meta-analysis of functional network alternations in Alzheimer’s disease: toward a netwok biomarker. Neurosci and Biobehav Reviews 2013; 37:753-765.
3. Nemani, A and Lowe, MJ. Cohesive parcellation of the human brain using resting-state fMRI. J Neuroscience Methods 2022; 377:109629.
4. Beall EB and Lowe MJ. SimPACE: generating simulated motion corrupted BOLD data with synthetic-navigated acquisition for the development and evaluation of SLOMOCO: a new, highly effective slicewise motion correction. Neuroimage 2014; 101:21-34.
5. Beall EB and Lowe MJ. Isolating physiologic noise sources with independently determined spatial measures. Neuroimage 2007; 37(4):1286-300.
6. Zalesky A, et al. On the use of correlation as a measure of network connectivity. NeuroImage 2012; 60:2096-2106.
7. Kundu S, et al. A novel joint brain network analysis using longitudinal Alzheimer’s disease data. Scientific Reports 2019; 9:19589.
8. Supekar K, et al. Network anlaysis of intrinsic functional brain connectivity in Alzheimer’s disease. 2008; 4(6): e1000100.
9. Li, W, et al. Simulating the evolution of functional brain networks in Alzheimer’s disease: exploring disease dynamics from the perspective of global activity. Scientific Reports 2016; 6:34156.
10. Badhwar A, et al. Resting-state network dysfunction in Alzheimer’s disease: a systematic review and meta-analysis. Alzheimer’s and Dimentia 2017; 8:73-85.
Figures
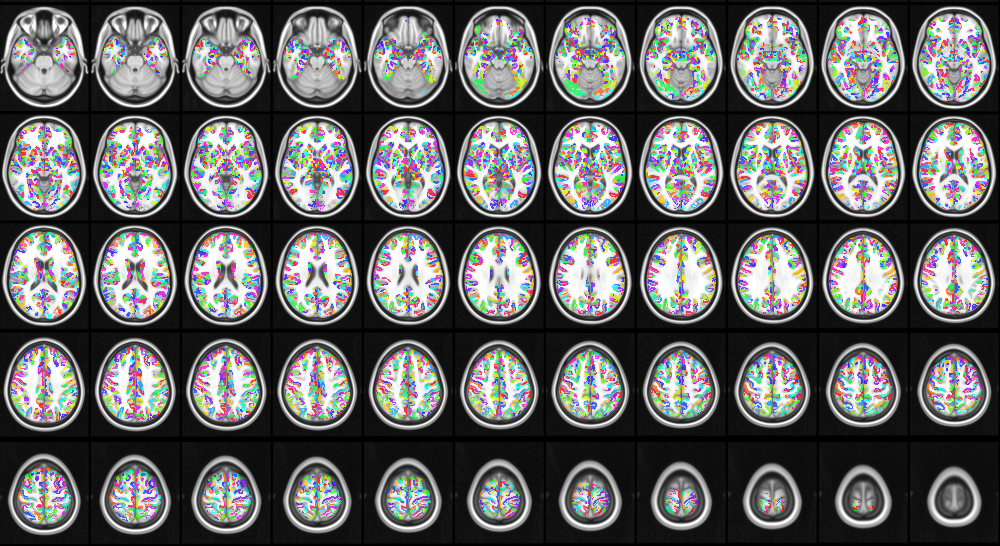
Figure 1: Group cohesive parcellation across all 30 subjects resulted in 2011 parcels.
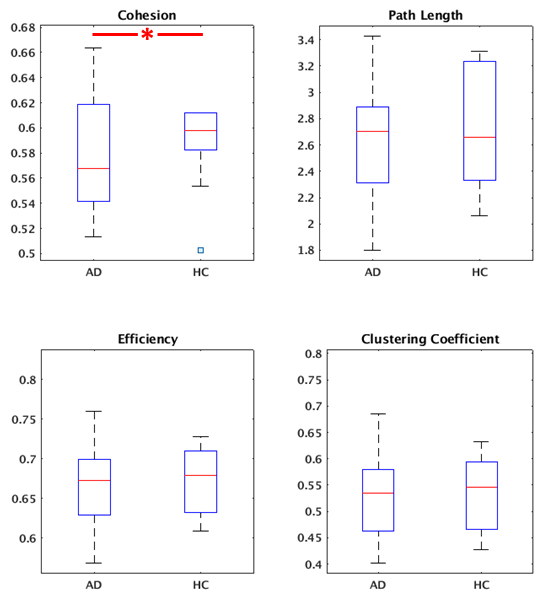
Figure 2: Nodal graph measures between AD and CN controls. Among the selected measures, only cohesion showed a significant change (p < 0.05).
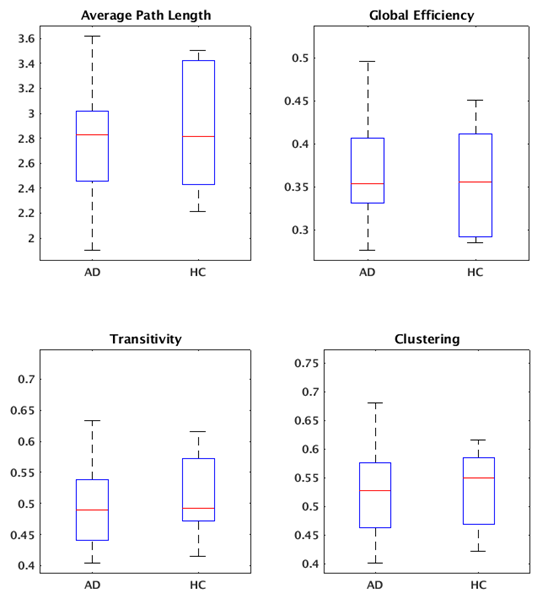
Figure 3: Global graph measures between AD and CN controls. No significant differences were found.
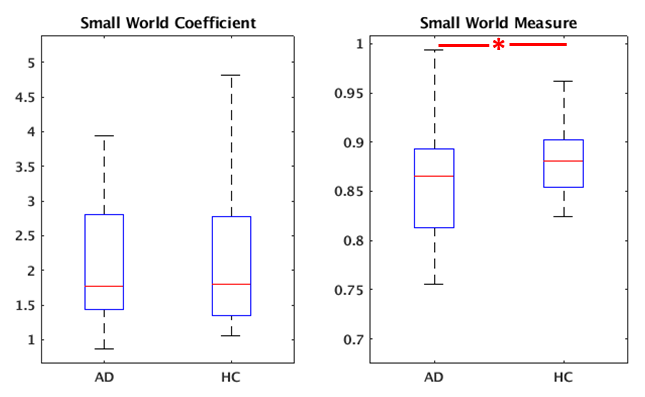
Figure 4: Small world estimates between AD and CN controls. The small world measure showed a significant change (p < 0.05), while the small world coefficient did not.
DOI: https://doi.org/10.58530/2023/3317