3314
Identification of Brain Networks Associated with Alzheimer’s Disease Risk1Radiology, Neurology, BIAC, Duke Univ Medical Center, Durham, NC, United States, 2Radiology, Duke Univ Medical Center, Durham, NC, United States, 3BIAC, Duke Univ Medical Center, Durham, NC, United States, 4BME, Duke Univ Medical Center, Durham, NC, United States, 5Neurology, Duke Univ Medical Center, Durham, NC, United States, 6Psychiatry and Behavioral Sciences Department, Duke Univ Medical Center, Durham, NC, United States, 7Statistical Sciences, Duke University, Durham, NC, United States, 8Neurology, Duke University Medical Center, Durham, NC, United States
Synopsis
Keywords: Alzheimer's Disease, Alzheimer's Disease, Aging
The brain connectome helds promise to detect subtle changes in individuals at risk for Alzheimer's disease. We imaged using high resolution diffusion imaging 72 subjects enriched for the APOE4 genotype to reveal vulnerable networks associated with a composite AD risk factor including age, genotype, and sex. Sparse canonical correlation analysis (CCA) revealed a high weight associated with genotype, and subgraphs involving the cuneus, temporal, cingulate cortex, and cerebellum. Our results have identified structural brain networks and the associated weights for several risk factors for AD in preclinical stages.Introduction
Studying populations at risk for Alzheimer’s disease (AD) may provide early biomarkers and targets for interventions at stages where interventions can be more effective and allow for time to test and implement preventive lifestyle strategies. Our study population is enriched for APOE4 carriage because it represents the major known genetic risk for Alzheimer’s disease, and thus holds the promise to reveal vulnerable brain networks based on diffusion weighted imaging, tractography, and connectivity.Methods
Our study population included 72 people across the age span, enriched for APOE4 to reveal vulnerable brain networks associated with a composite AD risk factor including age, APOE genotype, and sex. MRI data was acquired using a 3T GE Premier Performance scanner with a 60 cm gradient coil with peak strength of 115 mT/m, and a 48-channel head coil. We acquired diffusion weighted images using motion robust, multi-shot echo planar imaging (EPI) with 4 interleaved shots, reconstructed using MUSE. We used TE 60.6 ms/TR=14725 ms for 21 diffusion directions (b=1000 s/mm2) and 3 non-diffusion weighted images, acquired at 1x1x1 mm resolution using a field of view (FOV) of 25.6 cm, and a 256x256 matrix, 136 slices,. Anatomical images were acquired using a 3D T1-weighted IR-FSPGR-BRAVO sequence with TE=3.2 ms, TR=2263.7 ms, flip angle 8°, prep time 900 ms, recovery time 700 ms, 256x256x160 slices, 25.6x25x6x16 mm FOV. These images were used for brain parcellation and co-registration with DWI using SAMBA [1] and ANTs [2]. DWI processing used Dipy [2] to estimate the diffusion tensor and tractography. DWI volumes were affine registered to the first non-diffusion weighted image, using Advanced Normalization Tools (ANTs) to correct for eddy distortions, and denoised using a PCA based algorithm. All anatomical images were registered to the IIT human brain atlas using our SAMBA pipeline. The streamlines were reconstructed using the Q-ball constant Solid Angle Reconstruction. We chose a relative peak threshold of 0.5, minimum separation angle at 25°, and a stopping criterion using the brain mask. We estimated connectomes based on the number of streamlines connecting each pair of regions in the IIT atlas. To identify vulnerable brain networks associated with risk for AD, including age, sex, and APOE4 genotypes we developed : sparse canonical correlation with bootstrap confidence interval estimation (SCCA), and sparse regression based predictive modeling.Results
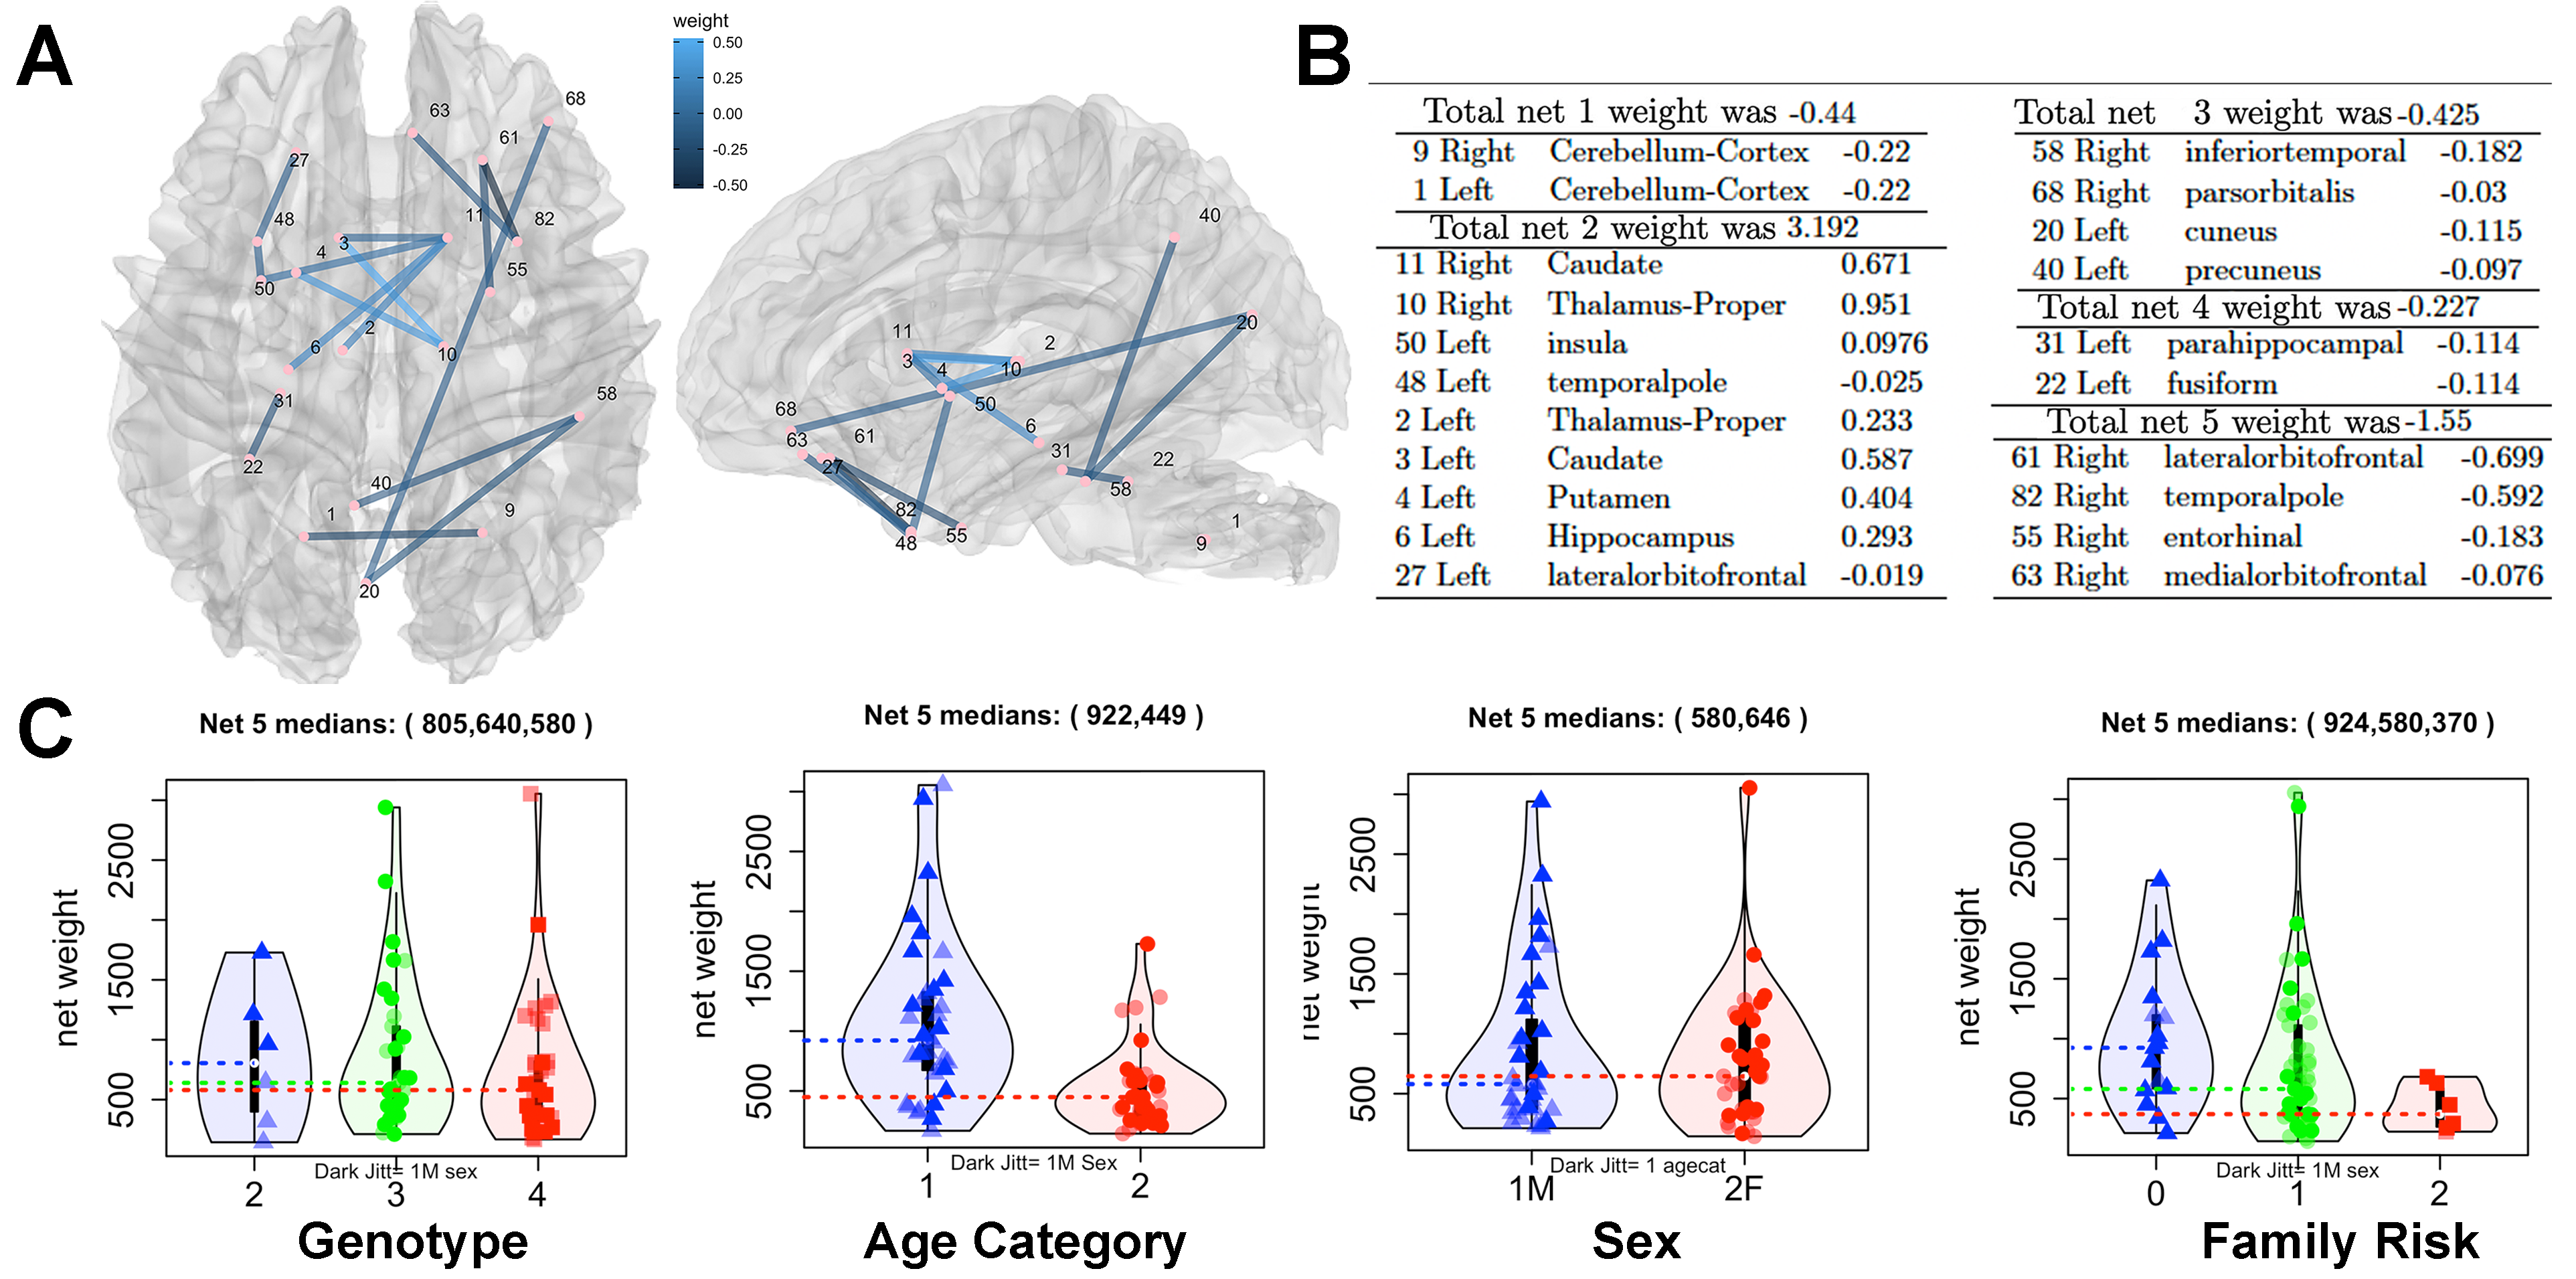
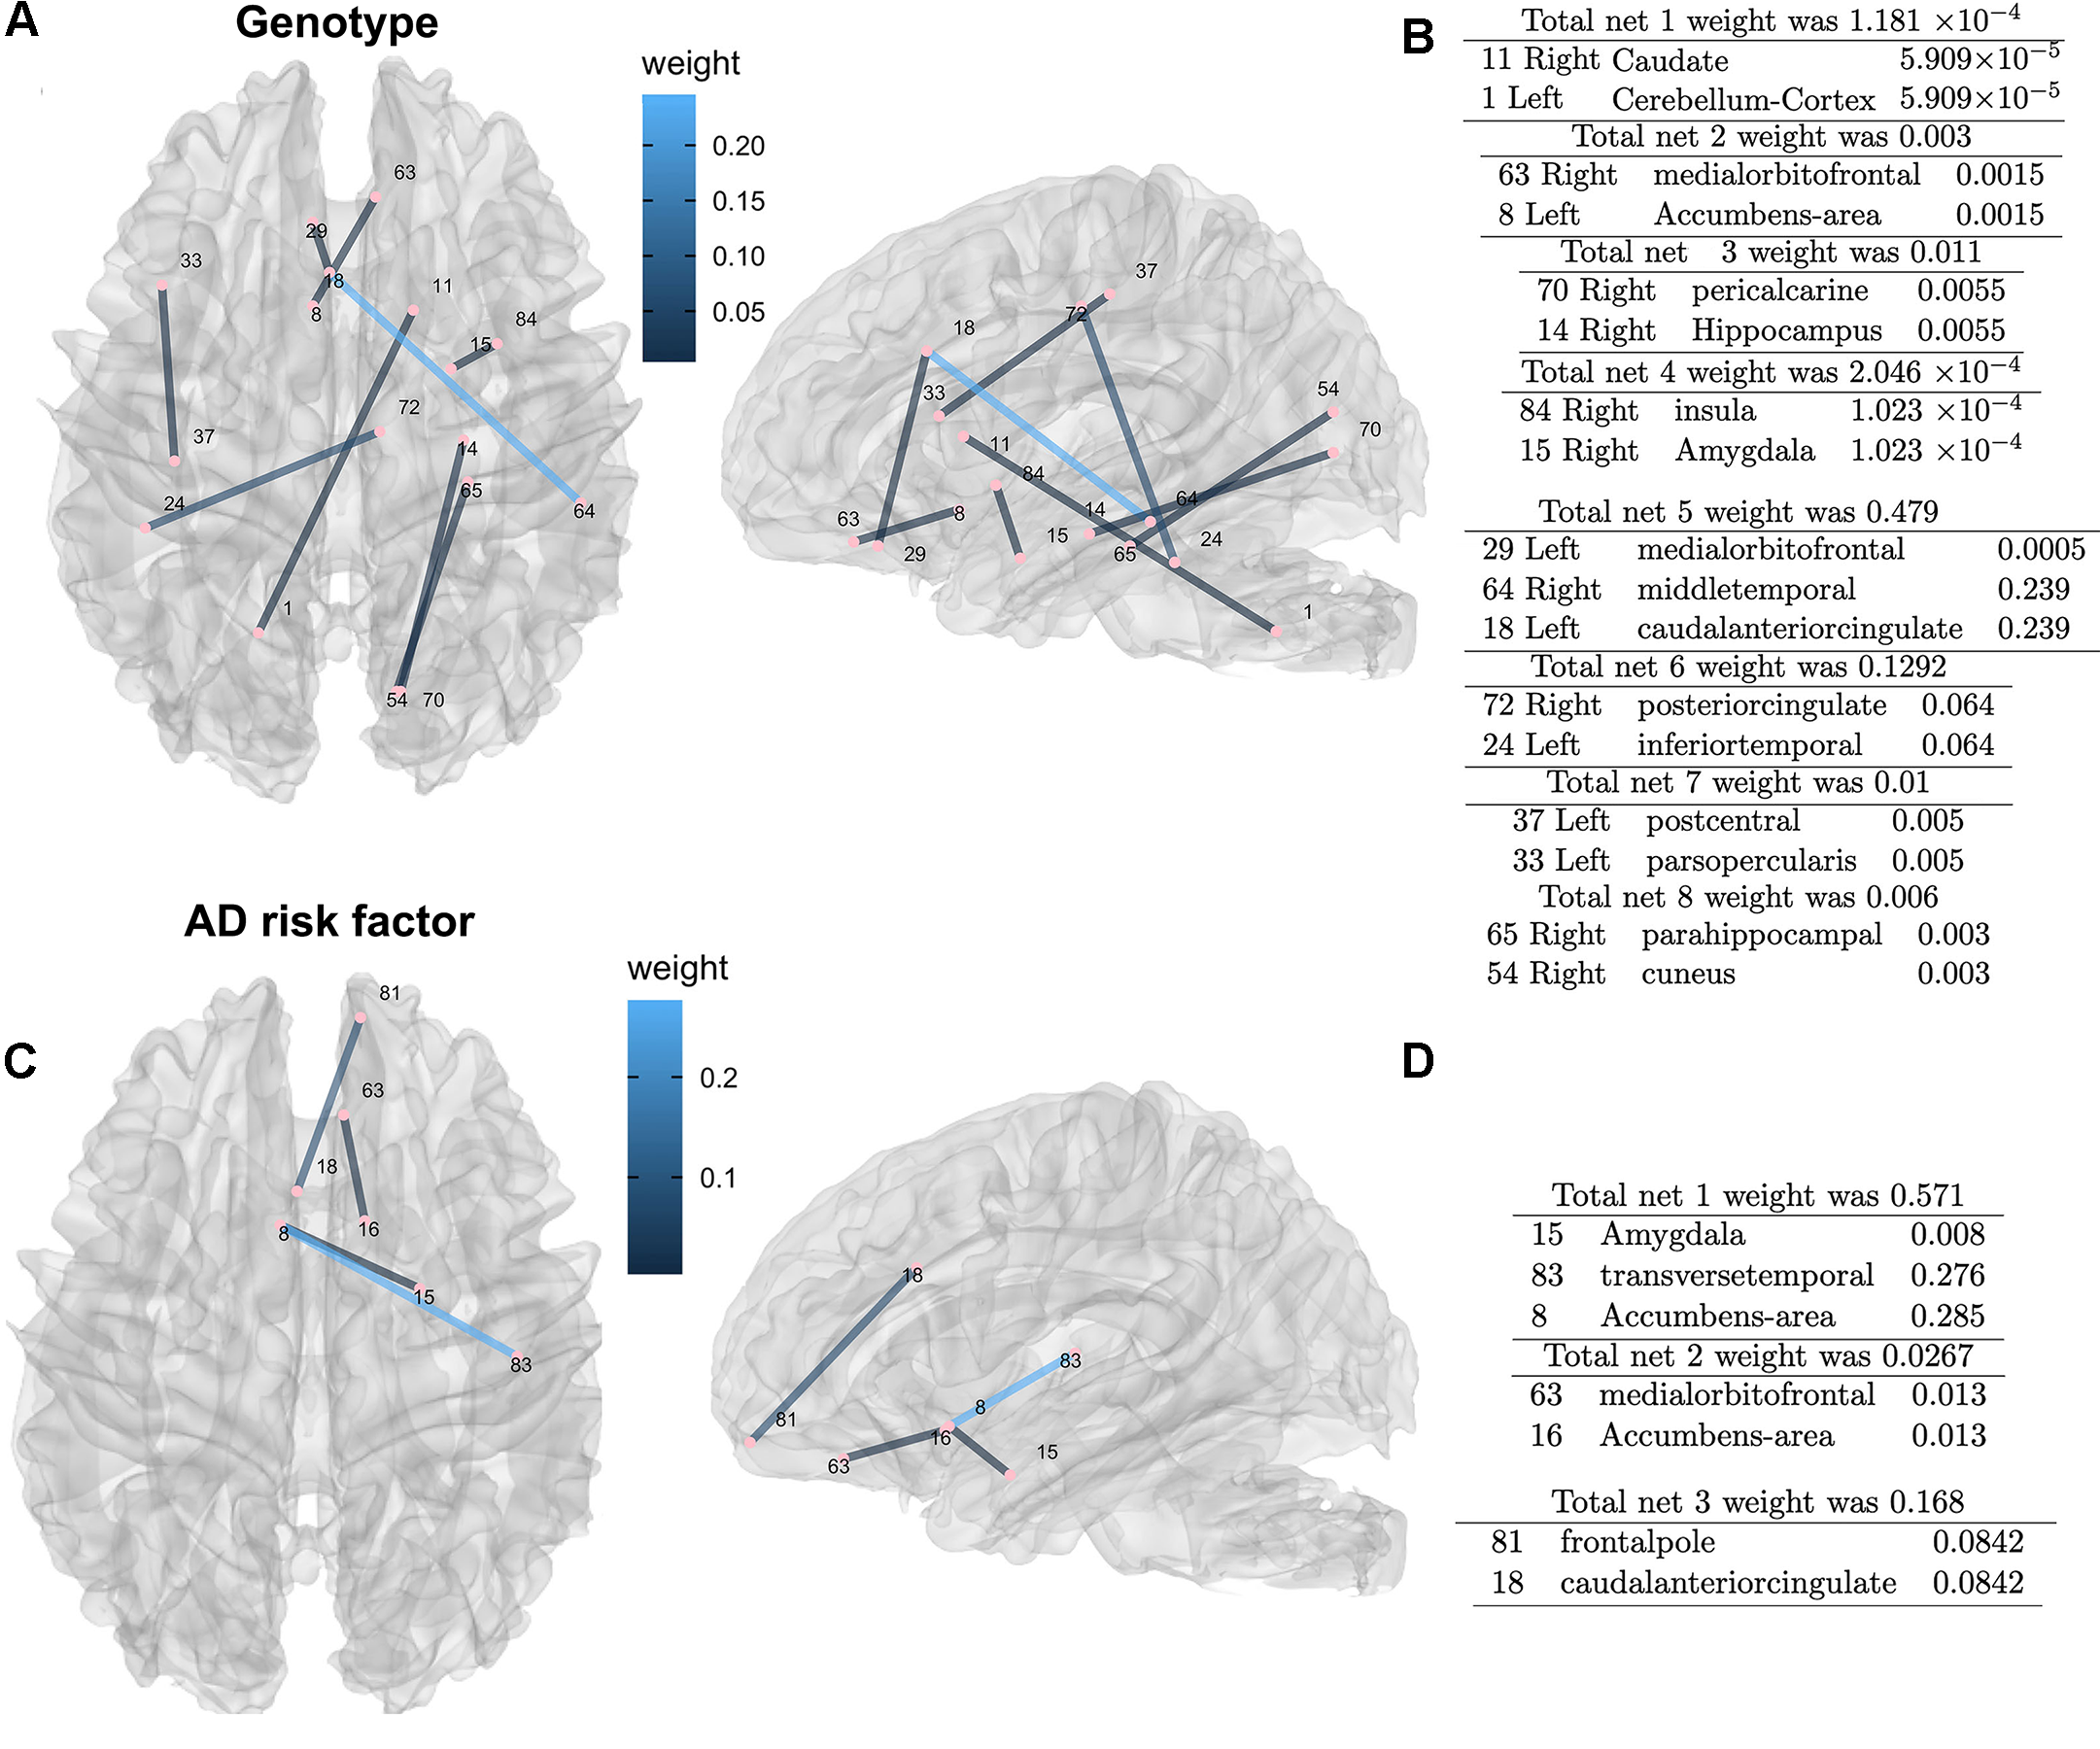
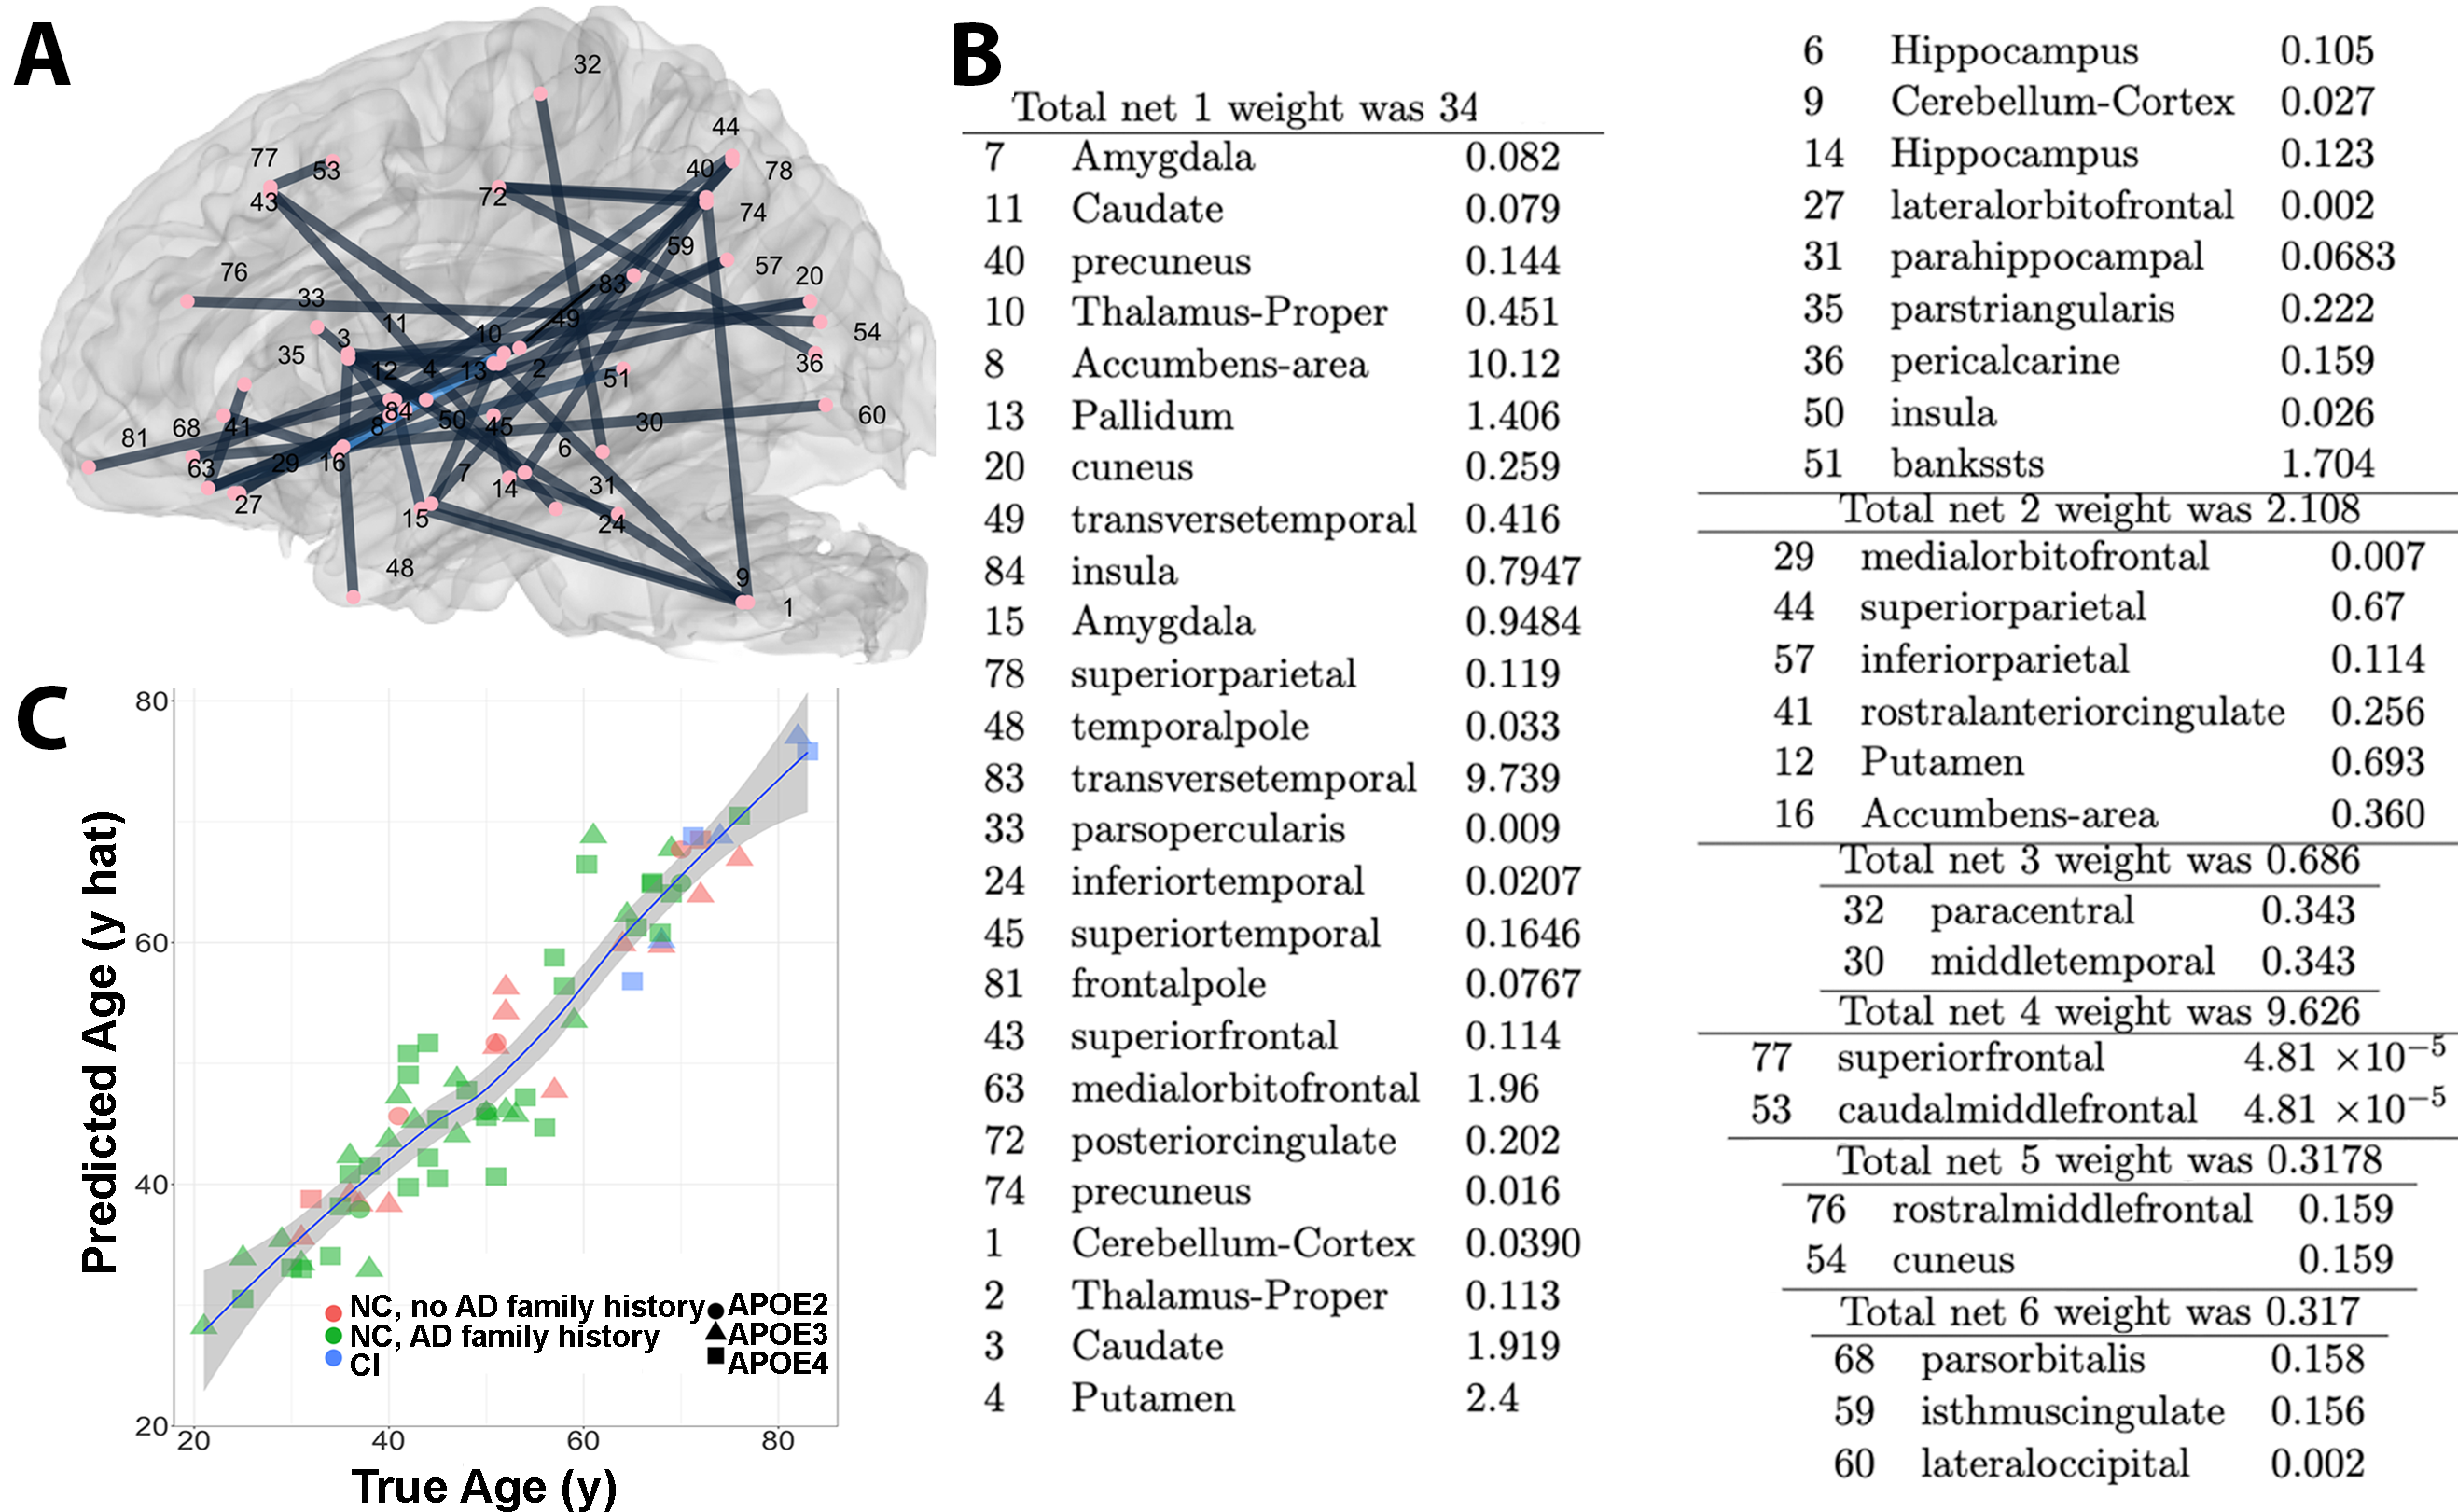
Sparse canonical correlation revealed a high weight was associated with genotype, and subgraphs involving the cuneus, temporal, cingulate cortices and the cerebellum (Figure 1). Adding cognitive metrics to the risk factor revealed the highest cumulative degree of connectivity for the pericalcarine cortex, insula, banks of the superior sulcus, and the cerebellum. To enable scaling up our approach to larger studies, we extended tensor network principal component analysis, introducing CCA components. Our sparse regression predictive models had errors of 17% for genotype, 24% for family risk factor for AD (0 if with normal cognition and no relatives with AD, 1 if with normal cognition and Ad in the family, 2 if cognitively impaired )(Figure 2), and 5 years for age (Figure 3). Age prediction in groups including MCI and AD subjects involved regions not found using only normal subjects, i.e. middle and transverse temporal, paracentral and superior banks of temporal sulcus, as well as the amygdala and parahippocampal gyrus.Discussion
We identified brain subnetworks predictive of APOE genotype, family risk factor for AD, and age. Predicting a greater brain age than the biological one may help identify subjects that are cognitively normal but at risk for AD, and early targets that show changes before cognitive decline. We aim to replicate this study in a larger population, and possibly using existing data bases, which may inform on the validity of current findings.Conclusion
Our results linking structural connectomes with AD risk and cognitive traits largely support and complement published fMRI network biomarkers studies, but in preclinical populations. Our findings support giving more consideration to several potential early biomarkers, including a role for the cerebellum.Acknowledgements
This work was supported by the Duke University School of Medicine, RF1 AG057895, R01 AG066184, U24 CA220245,RF1 AG070149, and P30 AG072958.References
1. Anderson RJ, Cook JJ, Delpratt N, Nouls JC, Gu B, McNamara JO, Avants BB, Johnson GA, Badea A. Small animal multivariate brain analysis (samba)–a high throughput pipeline with a validation framework. Neuroinformatics. 2019:17(3):451–472.
2. Avants BB, Epstein CL, Grossman M, Gee JC. Symmetric diffeomorphic image registration with cross-correlation: evaluating automated labeling of elderly and neurodegenerative brain. Med Image Anal. 2008:12(1):26–41.
3. Garyfallidis E, Brett M, Amirbekian B, Rokem A, Van Der Walt S, Descoteaux M, Nimmo-Smith I, Contributors D. Dipy, a library for the analysis of diffusion MRI data. Front Neuroinformatics. 2014:8:8.
Figures