3312
Mapping Connectivity of the Nucleus Basalis of Meynert in Alzheimers using fMRI and probabilistic tractography1Synaptec Network, Santa Monica, CA, United States, 2Neurology, UCLA, Los Angeles, CA, United States
Synopsis
Keywords: Alzheimer's Disease, Alzheimer's Disease
The nucleus basalis (NBM) is the major source of cholinergic innervation to the cerebral cortex, hippocampus and other subcortical structures. Focusing DTI and fMRI on the NBM can shed light on the potential state of subjects with Alzheimer’s disease. We aim to use DTI to provide insight into the white matter projections from the NBM and use fMRI to depict how it is functionally wired.
We found that imaging of the NBM differentiated dementia patients from controls, and captured the level of cognitive decline. While the results are preliminary, this analysis introduces a method of observing the progression of AD.
Background
The nucleus basalis of Meynert (NBM) is a structure in the basal forebrain that is responsible for a major source of cholinergic innervation to the cerebral cortex and amygdala. Elderly patients have diminished cholingergic activity in the NBM, likely due to reduced cholineacetyltransferase (ChAT) and acetylcholinesterase (AChE) activity. Their NBM neurons are both smaller and less dense than those found in younger individuals. A variety of cognitive disorders, including Alzheimer’s disease (AD), are correlated with degeneration of cholinergic neurons. Projections from the cholinergic neuron complex (Ch4) in the NBM to the cerebral cortex remain largely unmapped, but cholinergic axons have been traced from the NBM through the amygdala and insular cortex to the hippocampus and entorhinal cortex.The degeneration of Ch4 has a profound effect on the pathology of AD, because the disruption of this small group of neurons can perturb neurotransmission in all cortical areas. While the role of Ch4 in cognition is not fully understood, the cholinergic circuitry may provide a window into the cognitive state of AD. Focusing Diffusion Tensor Imaging and fMRI on the NBM can shed light on the potential state of subjects with Alzheimer’s disease. We aim to use DTI to provide insight into the white matter projections from the NBM and use resting state fMRI to depict how it is functionally wired. Combining these methods may even provide potential biomarkers for the early developmental stage of AD.
Methods
Subjects:38 Alzheimer's patients were identified using the gold standard lumbar puncture method based on amyloid-beta and tau markers. They were split into 2 groups based on CDR scores: 20 subjects who scored 0.5 (very mild) and 18 subjects with a CDR score of 1.0 (mild). 23 healthy, age-matched control participants were also recruited for comparison. All subjects were scanned on a Siemens 1.5T Espree and received an anatomical MPRAGE image, a resting state BOLD (rs-fMRI) image and a 30 direction DTI acquisition .
Results
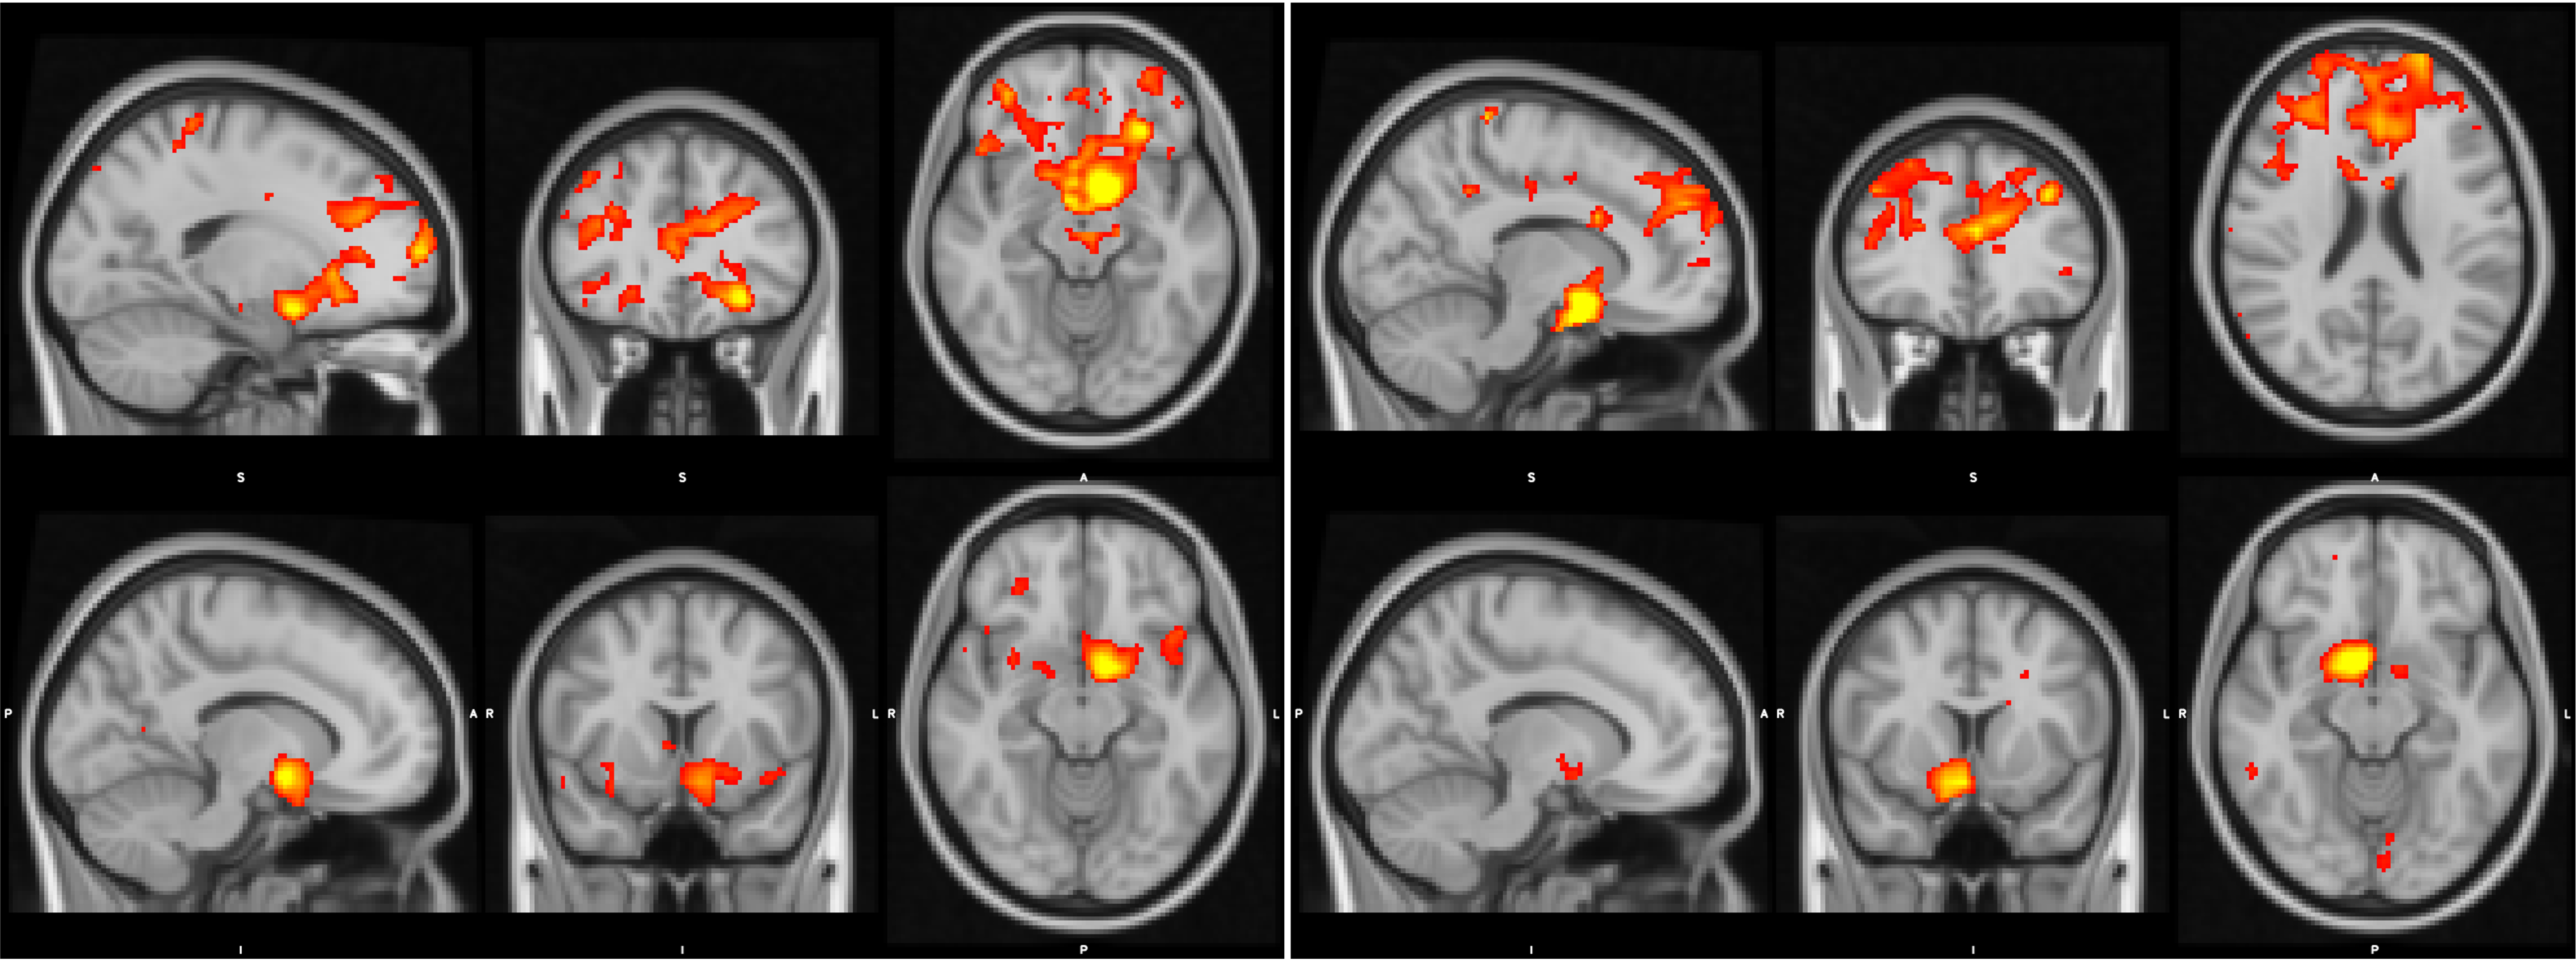
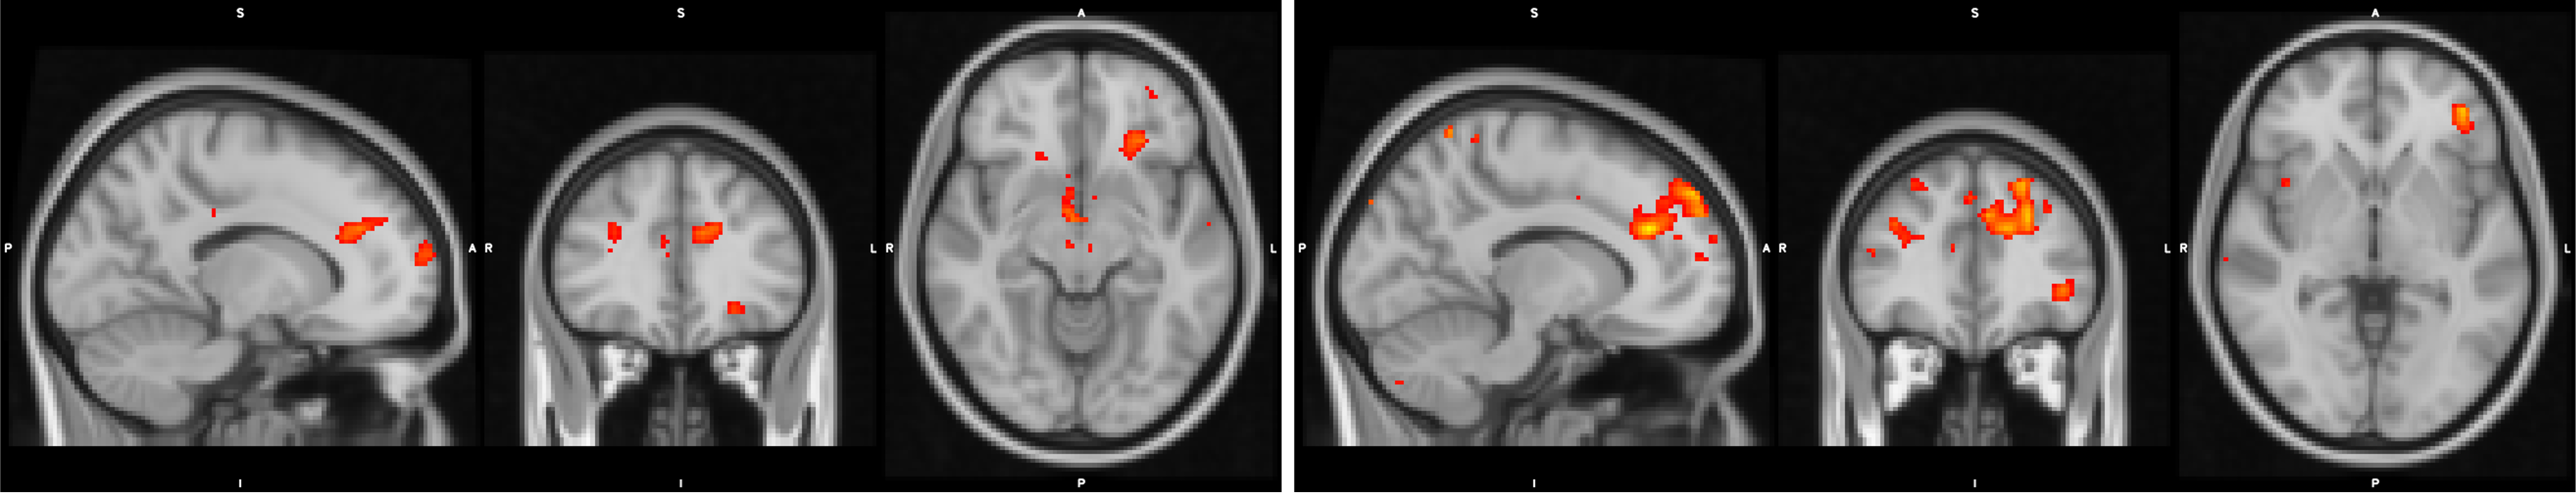
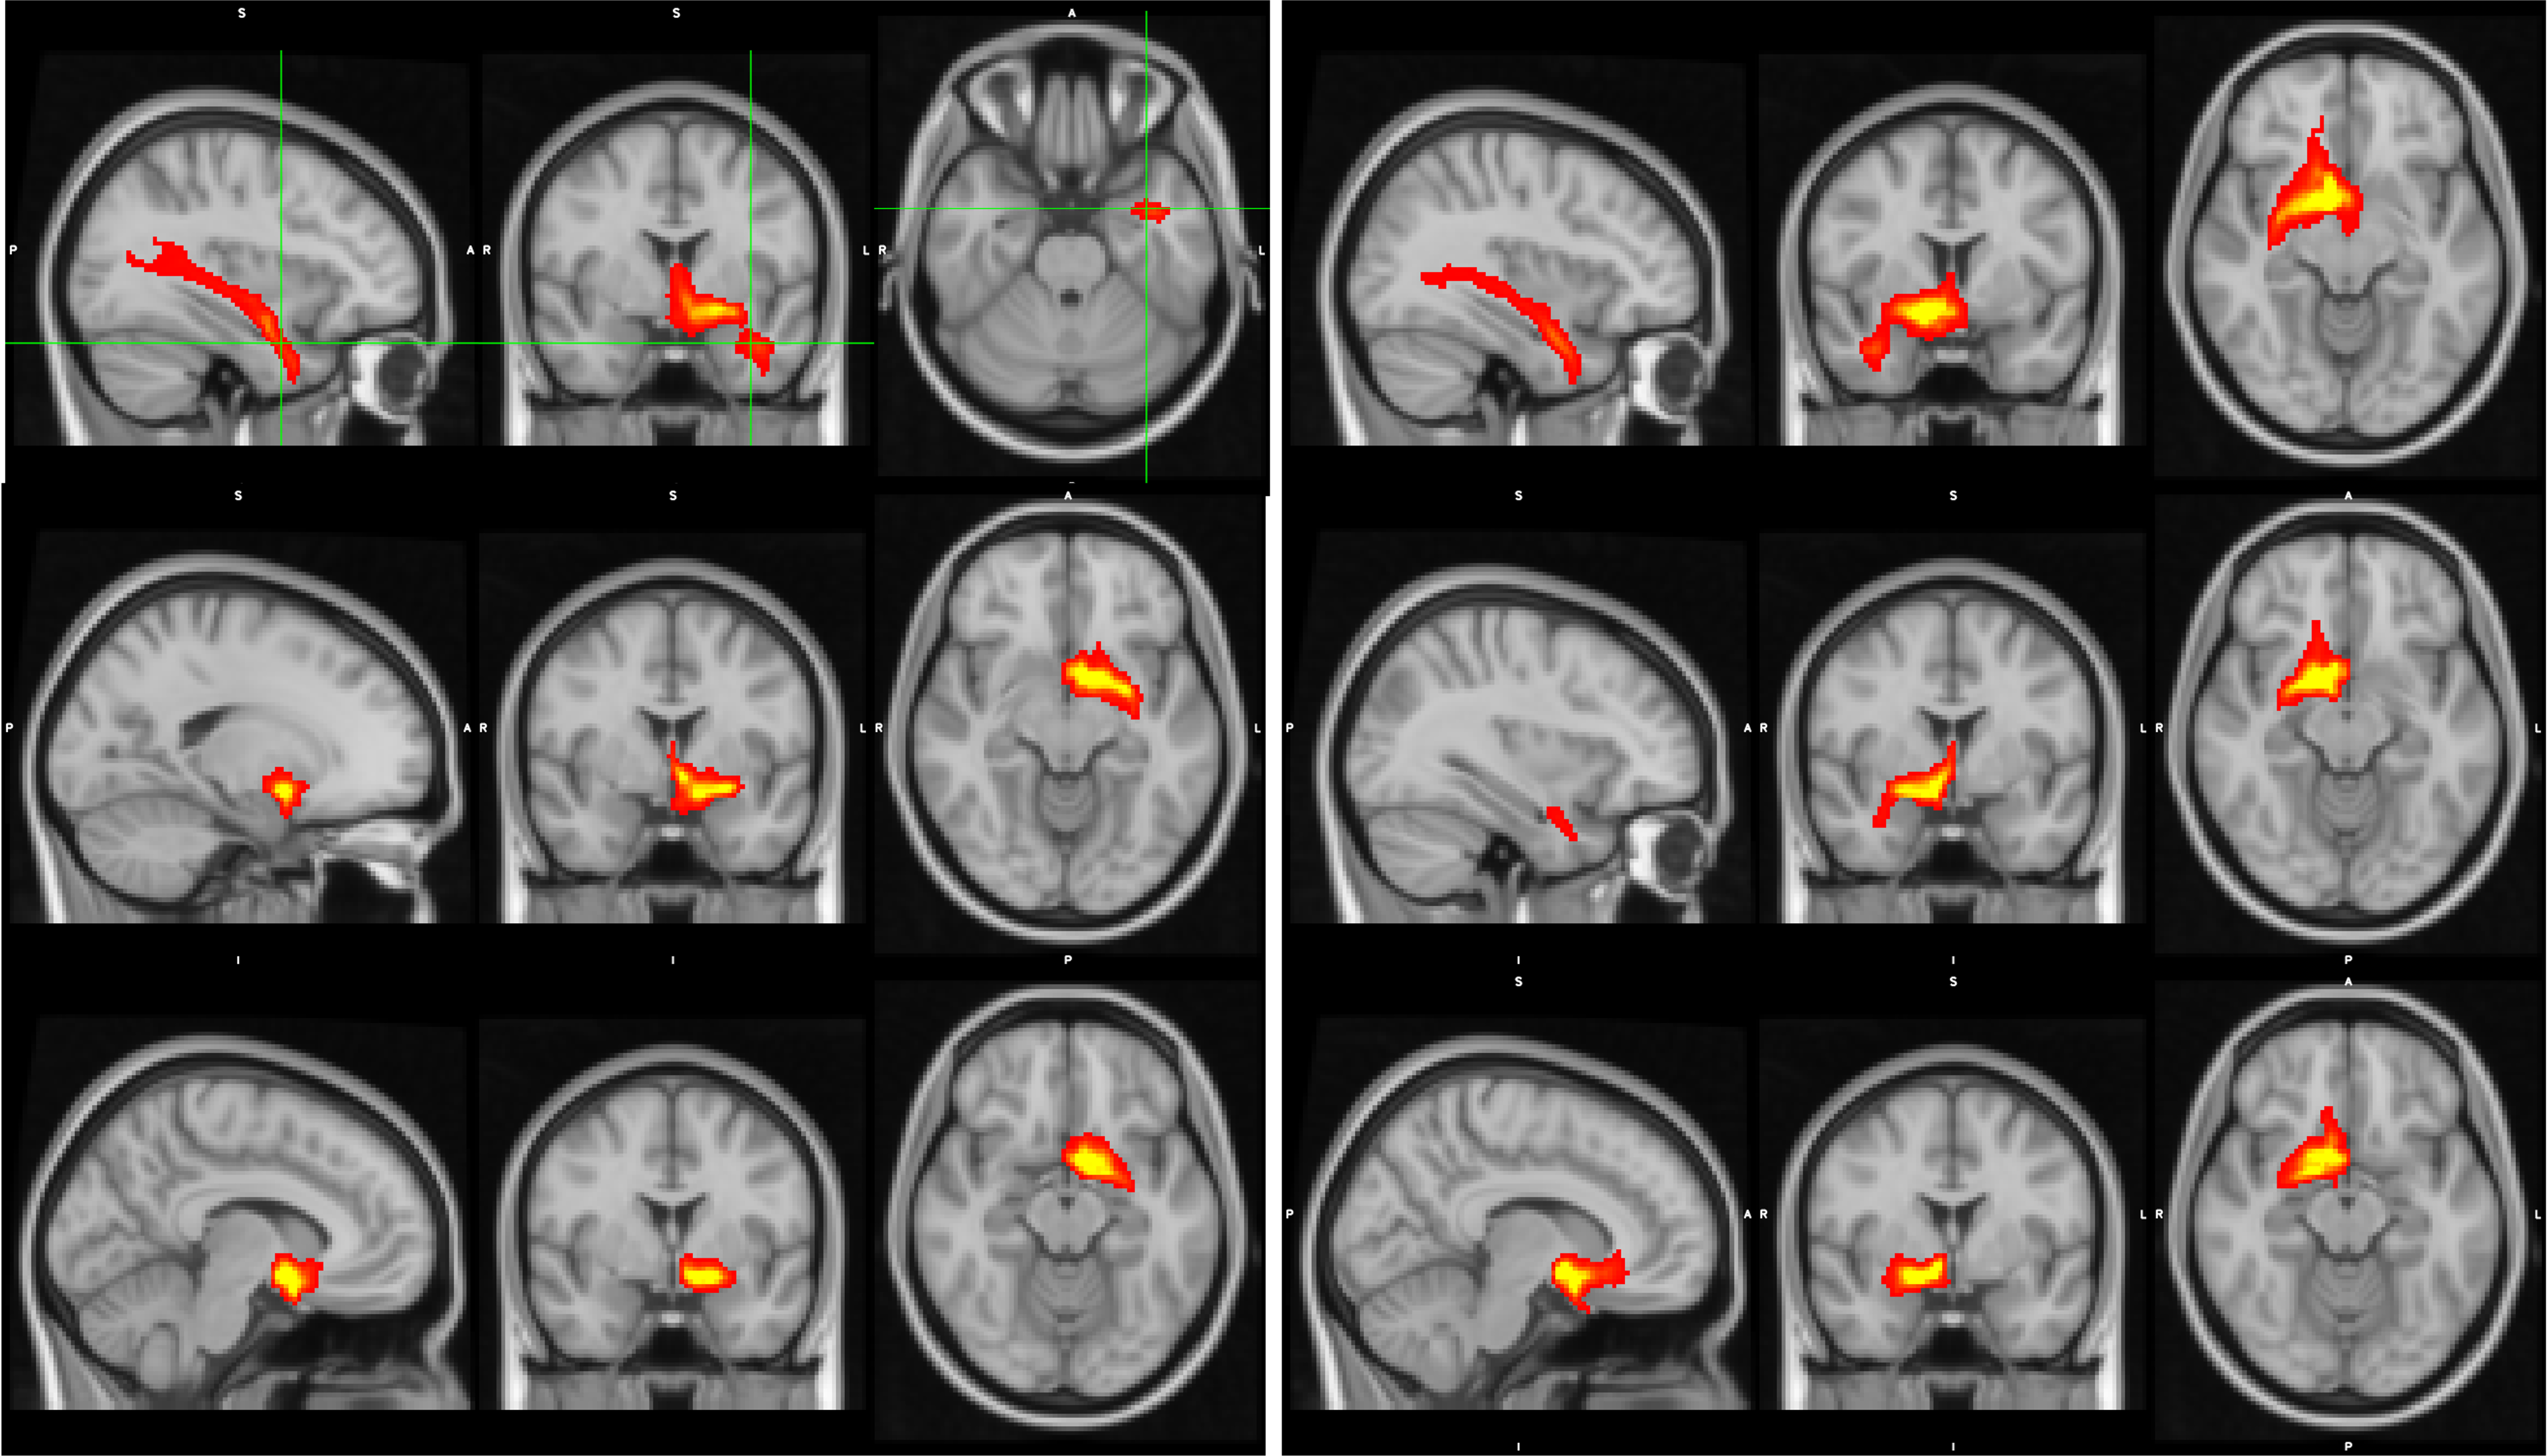
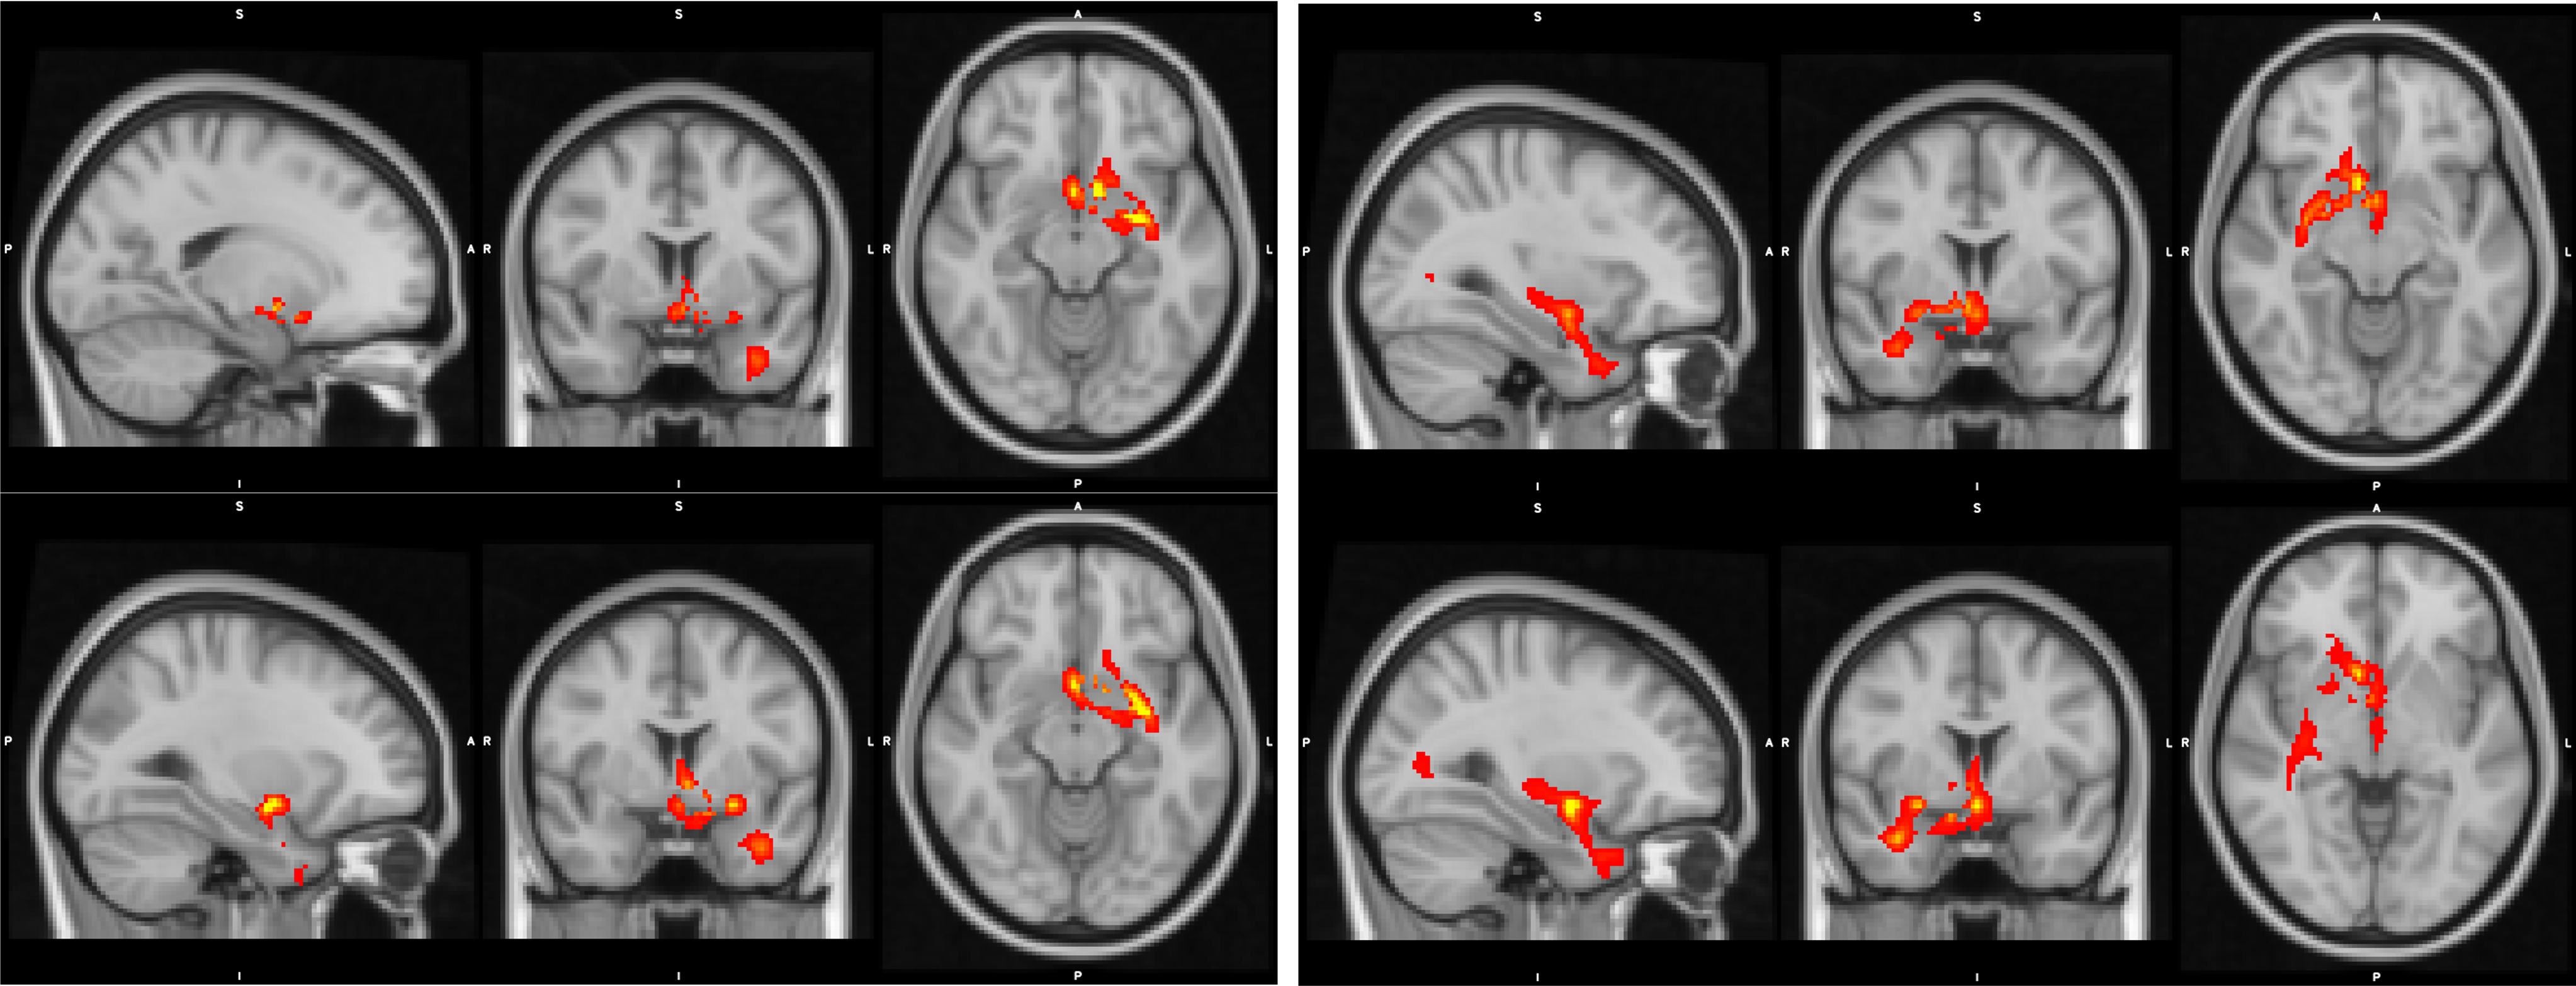
Functional Connectivity Group average shows a clear correspondence of a decrease in global functional connectivity between the NBM and the rest of the brain (figure 1). Group differences between healthy controls and the Alz group highlight specifically these regions (Figure 2). The AD group had a decrease in activity in the thalamus and frontal cortex, specifically some ventro-lateral regions that are most prominent when looking at the right NBM. The results between healthy controls/CDR 1.0 AD and healthy controls/CDR 0.5 were quite similar. Difference between CDR 0.5 and CDR 1.0 were equivocal and showed no findings, thus to increase power CDR 0.5 and CDR 1.0 were combined into a single Alz group to increase power.Probabilistic Tractography showed a drastic drop off in both tract density and count corresponding with CDR score from healthy controls. Figure 3 depicts how the group averages of tracts running through the amygdala towards the hippocampus diminish as CDR score is increased. When counting the average number of tracts that reached the entorhinal cortex (EC), there was a 39.4% drop off from the control group (1593) to the CDR 0.5 group (965); and an additional 23.8% drop from CDR 0.5 to CDR 1.0 (735). Figure 4 is able to capture this phenomenon to a degree, depicting a greater difference of the EC pathway in for CDR 1.0 subjects.
Conclusion
Imaging of the NBM successfully differentiated dementia patients from controls, and additionally was able to capture the level of cognitive decline. While the results are still preliminary due to small sample size, this analysis introduces a new method of observing the progression of AD pathologies. An interesting finding is that probabilistic tractography was more sensitive to differentiating sub groups of Alzheimer’s Disease, where as Functional Connectivity was not. One benefit of this method is that it does not require any special fMRI add on beyond the standard BOLD acquisition. Clinically, this approach may help resting fMRI and DTI classify the progression of neurodegenerative disorders.Acknowledgements
No acknowledgement found.References
M.W. Woolrich, S. Jbabdi, B. Patenaude, M. Chappell, S. Makni, T. Behrens, C. Beckmann, M. Jenkinson, S.M. Smith. Bayesian analysis of neuroimaging data in FSL. NeuroImage, 45:S173-86, 2009
S.M. Smith, M. Jenkinson, M.W. Woolrich, C.F. Beckmann, T.E.J. Behrens, H. Johansen-Berg, P.R. Bannister, M. De Luca, I. Drobnjak, D.E. Flitney, R. Niazy, J. Saunders, J. Vickers, Y. Zhang, N. De Stefano, J.M. Brady, and P.M. Matthews. Advances in functional and structural MR image analysis and implementation as FSL. NeuroImage, 23(S1):208-19, 2004
M. Jenkinson, C.F. Beckmann, T.E. Behrens, M.W. Woolrich, S.M. Smith. FSL. NeuroImage, 62:782-90, 2012
Mesulam, M‐Marsel. "Cholinergic circuitry of the human nucleus basalis and its fate in Alzheimer's disease." Journal of Comparative Neurology 521.18 (2013): 4124-4144.
Liu, Alan King Lun, et al. "Nucleus basalis of Meynert revisited: anatomy, history and differential involvement in Alzheimer’s and Parkinson’s disease." Acta neuropathologica 129.4 (2015): 527-540.
Figures