3311
Network analysis reveals differences in the topology of structural brain networks of young asymptomatic APOE-epsilon4 carriers1Psychology, Cardiff University, Cardiff, United Kingdom, 2Psychology, University of Bath, Bath, United Kingdom, 3Cardiff University, Cardiff, United Kingdom
Synopsis
Keywords: Alzheimer's Disease, Alzheimer's Disease
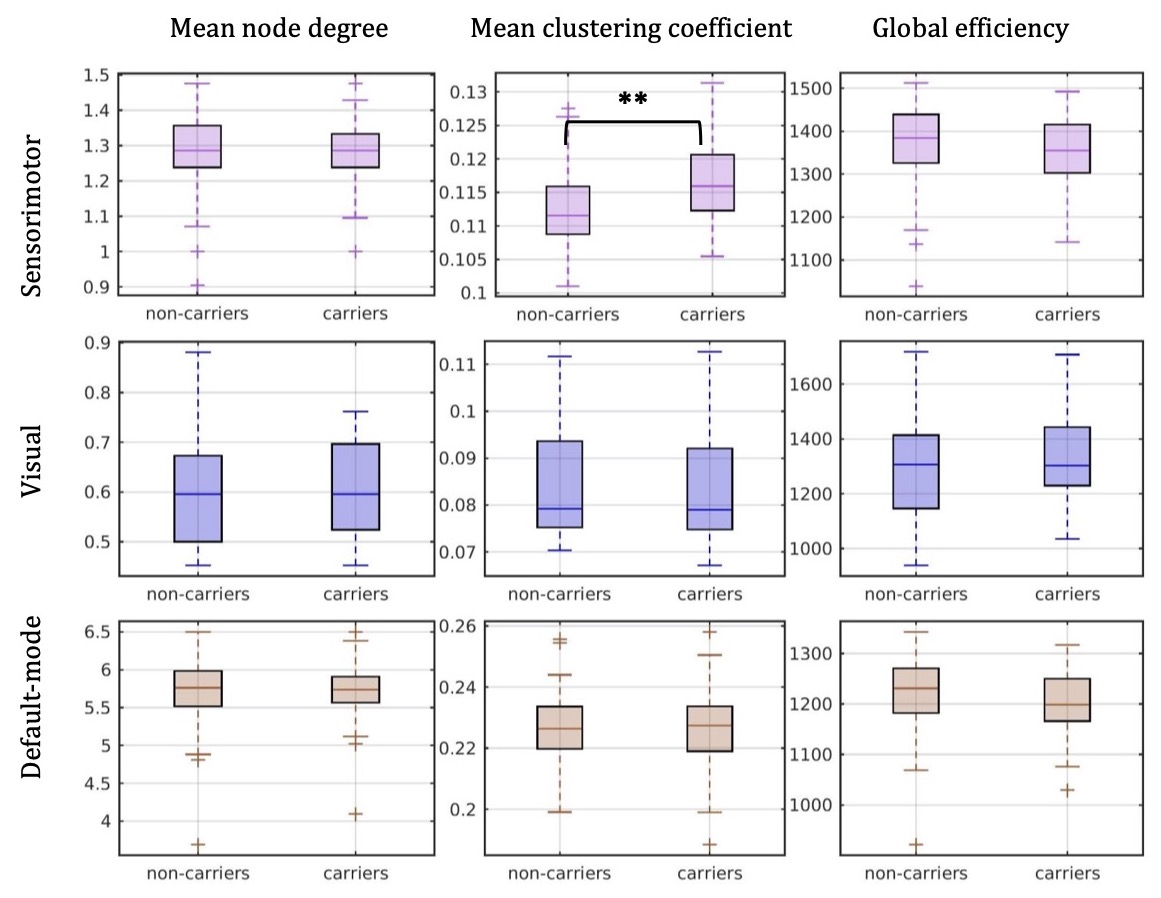
This work explores the link between the topological properties of brain structural networks and APOE-epsilon4 in young asymptomatic adults. We investigated the sensorimotor, visual and default-mode networks. We found evidence that there are differences in the mean clustering coefficient of the sensorimotor network of carriers versus non-carriers, with the left caudal middle frontal, left precentral, right postcentral and right precentral gyri driving the differences. Interestingly, the mean clustering coefficient was higher in carriers compared to non-carriers. In contrast, no differences were found for the visual or the default-mode networks.Introduction
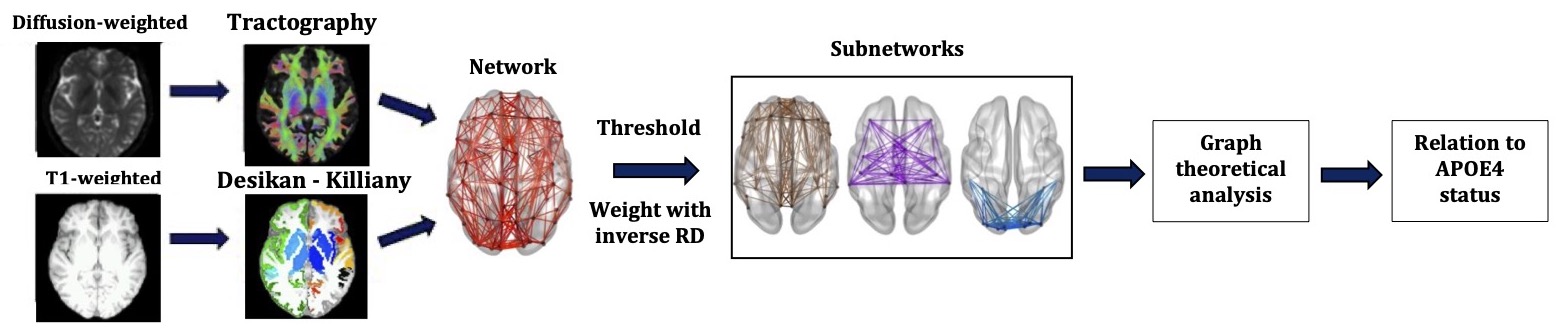
Genome-wide Association Studies have identified many Single Nucleotide Polymorphisms (SNPs) as conferring risk for Alzheimer's disease (AD)1, with the apolipoprotein epsilon4 allele (APOE4) conferring the greatest risk2,3,4,5,6. The default-mode7,8,9,10, sensorimotor11 and visual12,13 networks have been shown to be altered in AD patients compared to controls. Additionally, AD and mild-cognitive-impairment patients have higher radial diffusivity (RD) in white matter tracts compared to controls14,15. Such an increase, although non-specific, can be influenced by lower myelination or axonal density16,17,18. In this study we use tractography-derived structural brain networks with the edges weighted by the inverse-RD, and investigate possible differences in the brain networks of young healthy APOE4 carriers versus non-carriers.Methods
Genotyping: Genomic DNA was obtained from saliva. Genotyping was performed using custom Illumina HumanCoreExome-24 BeadChip genotyping arrays. Quality control and imputation were implemented in plink 1.919. Participants were excluded for ambiguous sex, cryptic relatedness up to third-degree relatives, genotyping completeness less than 98%, non-European ethnicity admixture, and outliers from an autosomal heterozygosity filter. SNPs were excluded where the minor allele frequency was less than 1%, if the call rate was less than 98%, or if the chi-squared test for Hardy-Weinberg equilibrium had p<1e-6. A total of 233,054 genotyped SNPs remained after quality control. Further details of the process are described elsewhere20,21,22,23,24.MRI data collection and pre-processing: 130 healthy participants (81 female, 19-35 years) were scanned on a GE Signa HDx 3T MRI scanner. T1-weighted images were acquired using an axial three-dimensional FSPGR sequence (TR/TE=8/3ms, 1mm isotropic resolution). Diffusion-weighted MRI images were acquired using a peripherally cardiac-gated sequence with b=1,200s/mm2 along 30 unique, isotropically distributed gradient orientations (TR/TE=20s/90ms, 2.4mm isotropic resolution). Three images with no diffusion weighting were also acquired. The diffusion images were co-registered to the T1-weighted images. Free-water, head movement and eddy current distortion corrections were applied.
Tractography: Probabilistic, anatomically-constrained streamline tractography was performed using MRtrix25, employing the iFOD2 algorithm26,27,28. The maximum angle between successive steps was 50o, the minimum and maximum streamline lengths were 30mm and 250mm respectively, and the FOD amplitude cut-off was 0.06. Two million streamlines were generated for each participant, with the seed points on the interface between grey matter and white matter.
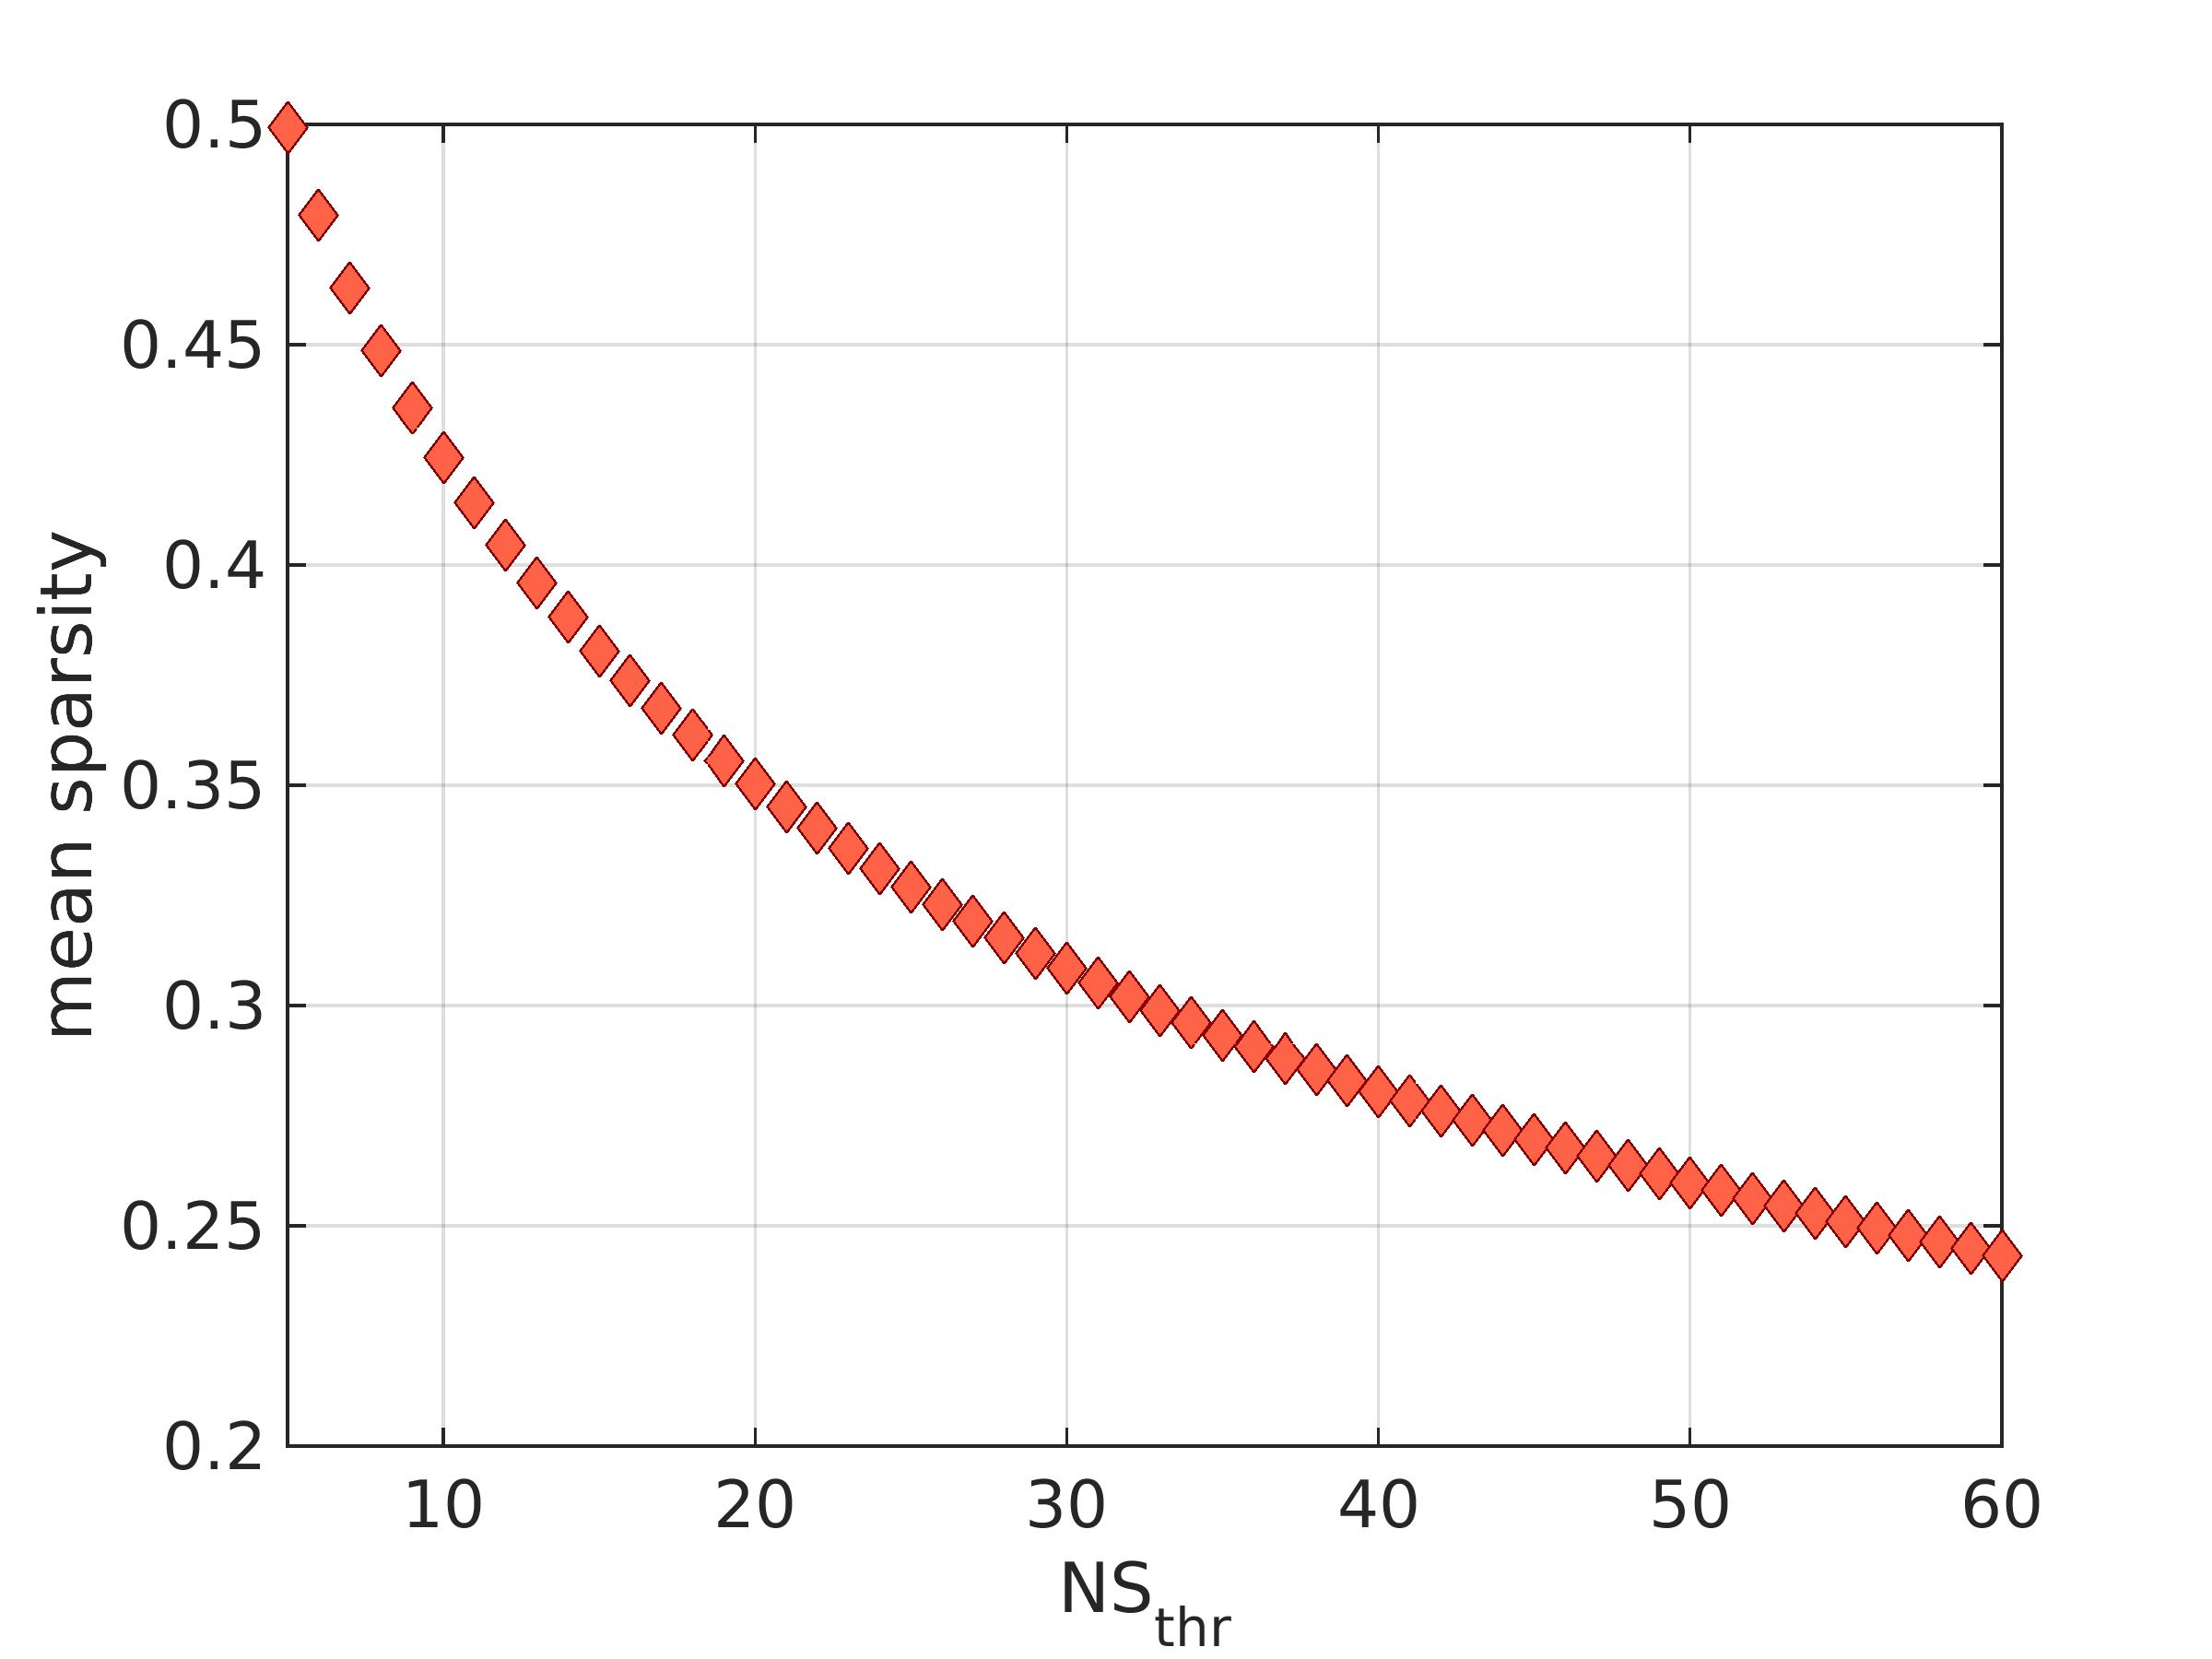
Network construction: The Desikan-Killiany atlas29 was used to identify the 82 cerebrum areas forming the nodes of the structural brain networks. The edges of the networks were the white-matter tracts connecting brain areas. Edges with fewer than NSthr number of streamlines (NS) were removed; the analysis was repeated for NSthr ranging from 5 to 60 to ascertain that any statistically significant results were not due to the threshold choice. This NSthr range corresponded to mean sparsity for the networks between 0.5 and 0.25. Edges that survived thresholding were weighted with the mean inverse-RD calculated along the voxels spanning the corresponding white matter tracts. Networks were constructed for the default-mode, sensorimotor and visual systems. Three graph theoretical metrics, namely the mean node degree, mean clustering coefficient and global efficiency, were calculated for each network using the Brain Connectivity Toolbox30.
Statistical analysis: A 2-sample t-test was used to compare the distributions of the graph theoretical metrics between APOE4 carriers and non-carriers. The resulting p-values were corrected for multiple comparisons using the false-discovery-rate algorithm31, applied over the three graph theoretical metrics of the three networks. Any measures exhibiting statistically significant differences between the two groups were followed up to identify whether the differences were present across all network nodes, or driven by specific nodes within each network.
The analysis pipeline is shown in Fig. 1.
Results
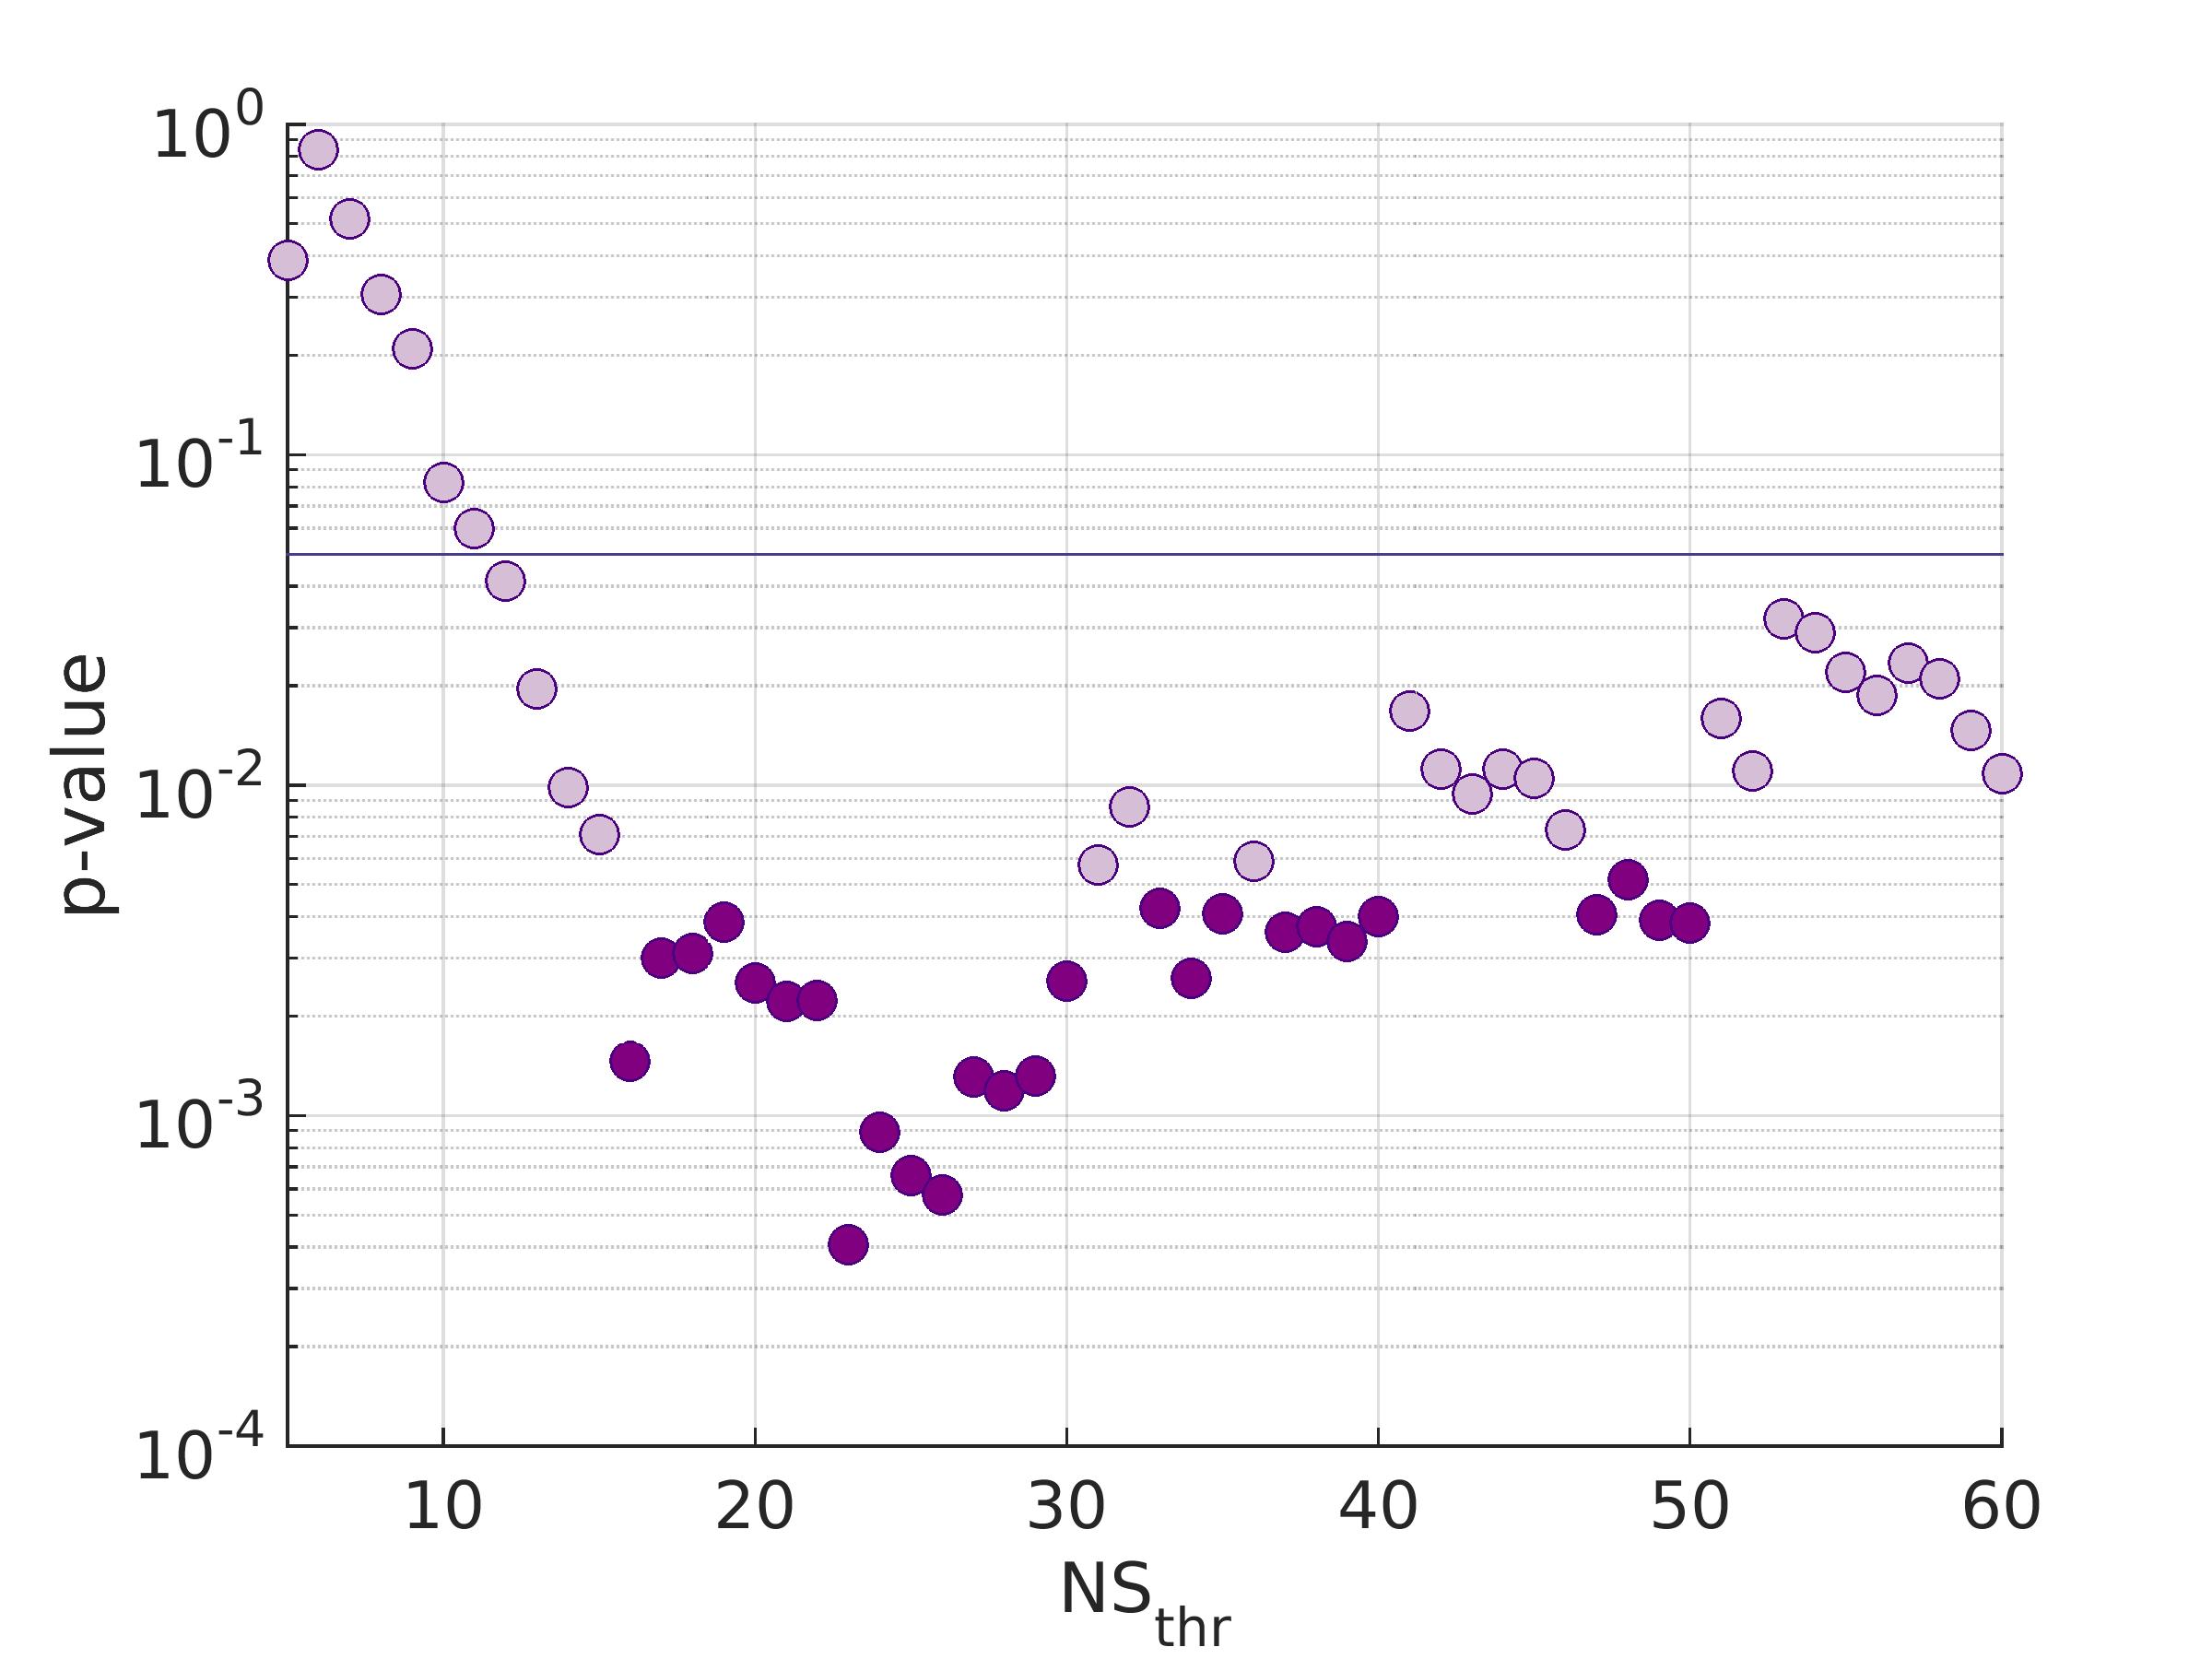
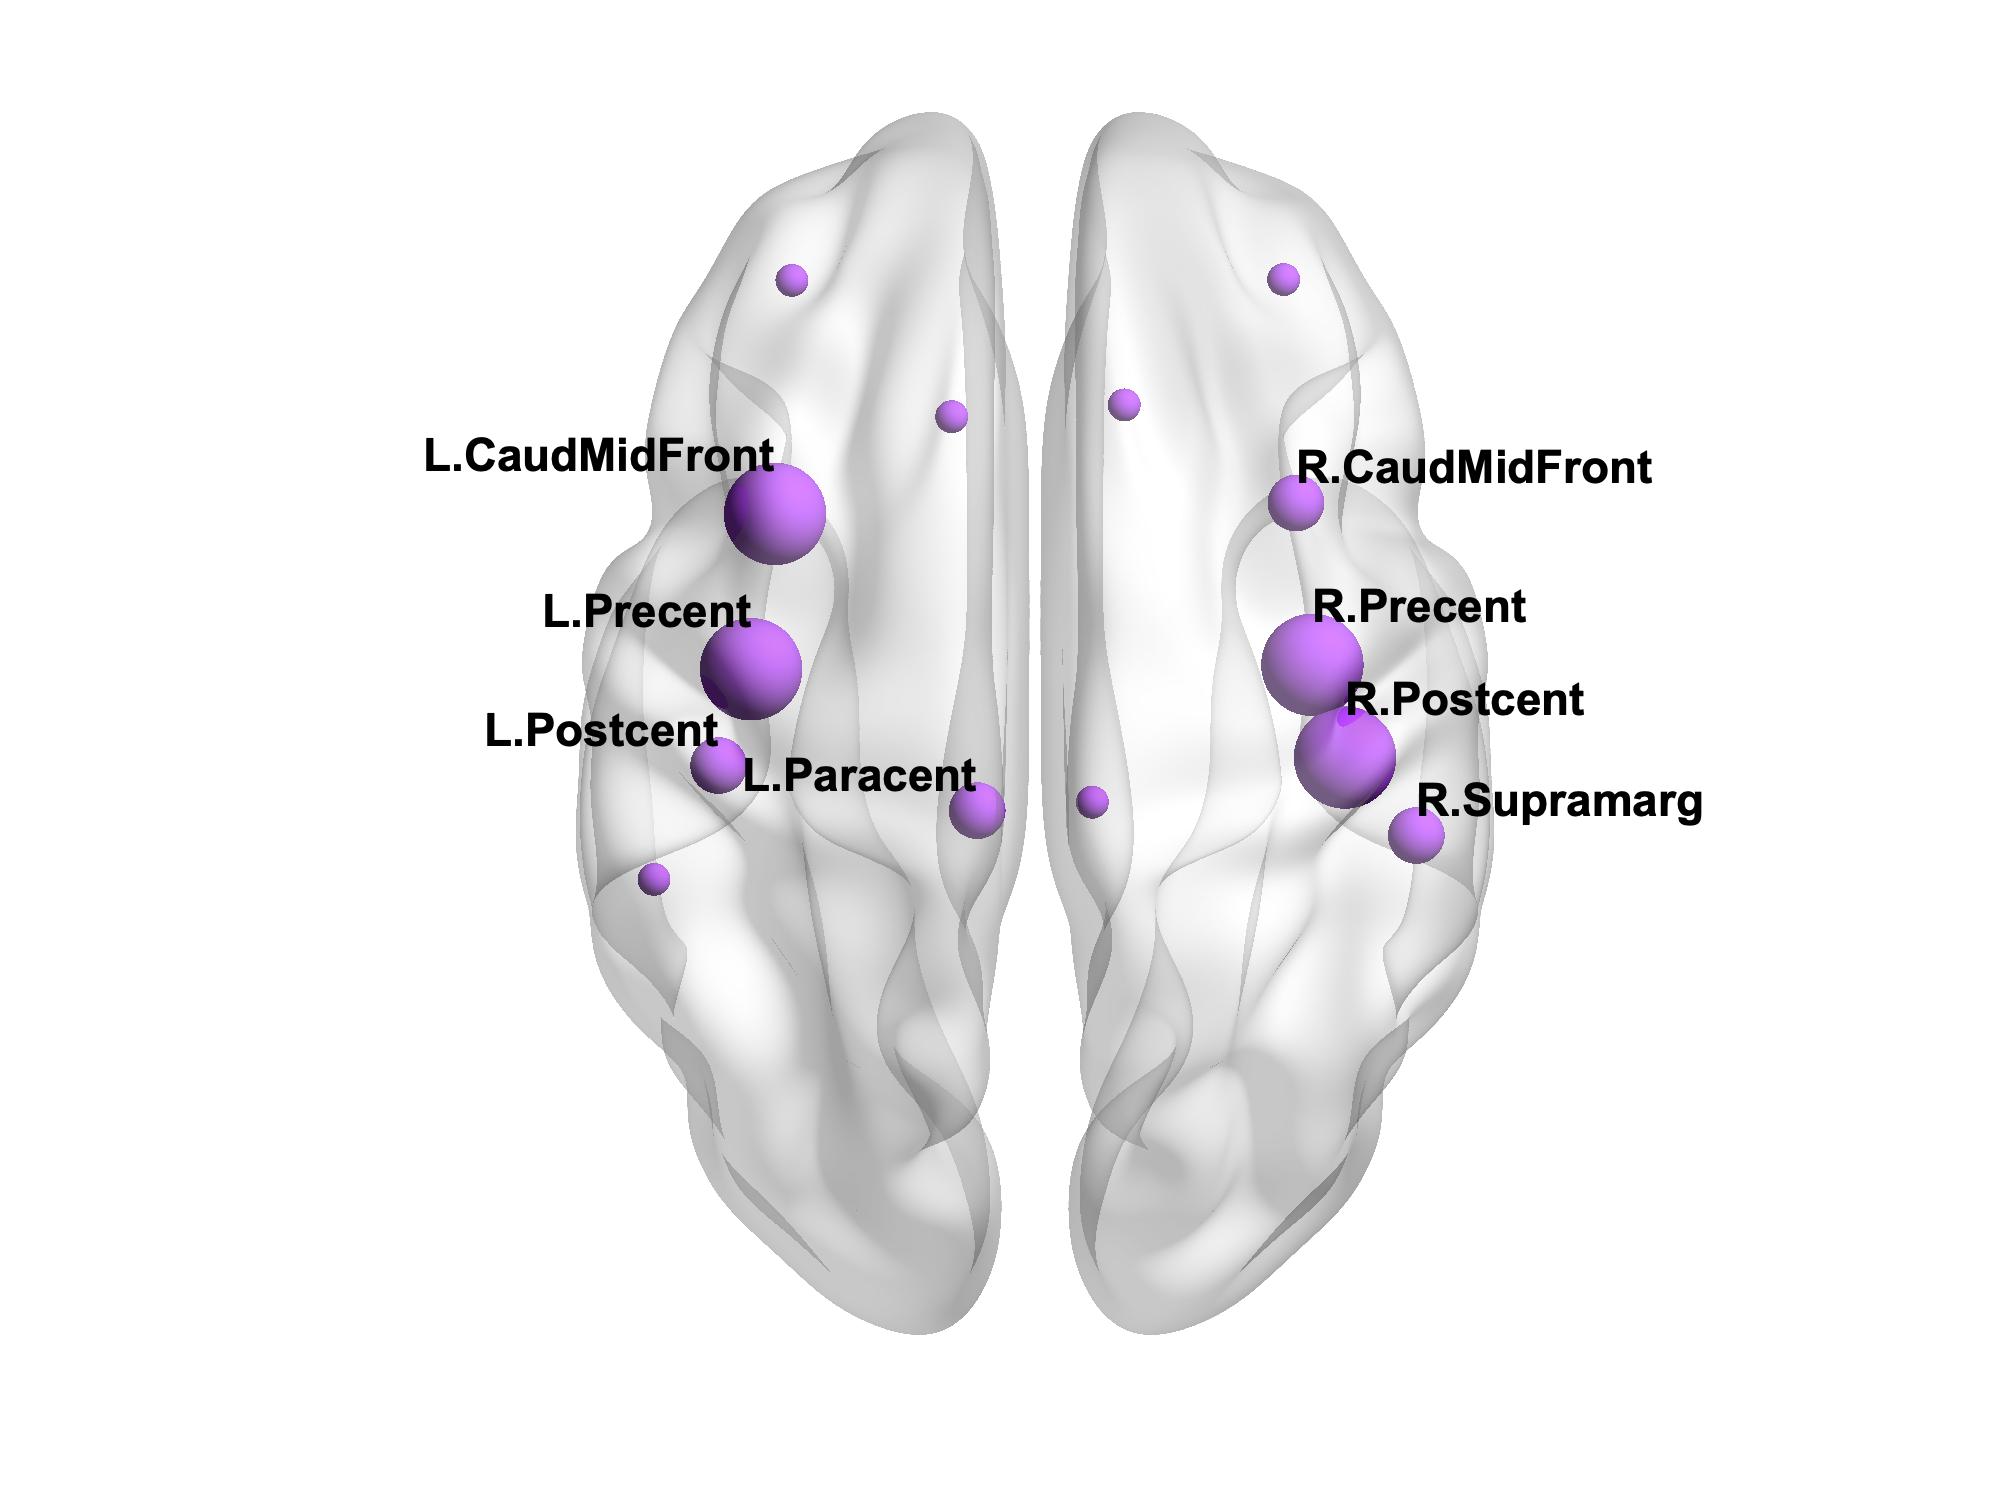
There were 41 APOE4 carriers and 89 non-carriers. The mean sparsity of the structural networks versus NSthr is shown in Fig. 2.Statistically significant differences that survived multiple-comparison correction were identified between the APOE4-carrier and APOE4-non-carrier distributions of the mean clustering coefficient of the sensorimotor network, with carriers exhibiting higher values of the mean clustering coefficient. The difference was most pronounced for NSthr=23 (corresponding to sparsity of 0.34) with p=0.0004, but persisted across thresholds (Fig. 3). The distributions for the metrics of the three networks for carriers and non-carriers are shown in Fig. 4. The subsequent analysis showed that the differences in the distributions were driven by the following nodes: left caudal middle frontal (p=0.004), left precentral (p=0.013), right postcentral (p=0.007) and right precentral (p=0.004) (Fig. 5).
Discussion
Our results show differences in the structural networks of APOE4 carriers compared to non-carriers, with carriers exhibiting higher mean clustering coefficient of the sensorimotor network. The left caudal middle frontal, right postcentral and bilateral precentral gyri drove the differences. Middle-aged APOE4 carriers have been shown to have thinner cortex in the caudal middle frontal and precentral gyri compared to non-carriers32. If these differences are present early in adulthood in APOE4 carriers, the increased mean clustering coefficient in those gyri that we observed could indicate an early compensatory mechanism, which is eventually overcome by the disease. The network edges were weighted by the inverse-RD, which may partly reflect differences in myelination or axon density, both of which support effective communication in the brain. MRI sequences that are more sensitive to axonal density and myelination should be used in similar studies in the future.Acknowledgements
EM was funded by a Wellcome Trust ISSF Postdoctoral Research Fellowship at Cardiff University (204824/Z/16/Z). DKJ was funded by a Wellcome Trust Investigator Award (096646/Z/11/Z) and a Wellcome Trust Strategic Award (104943/Z/14/Z).References
1. B.W. Kunkle, B. Grenier-Boley, R. Sims, et al. Genetic meta-analysis of diagnosed Alzheimer’s disease identifies new risk loci and implicates Ab, tau, immunity and lipid processing. Nat Genet 2019, 51(3): 414-430.
2. W. J. Strittmatter, A. M. Saunders, D. Schmechel, M. Pericak-Vance, J. Enghild, G. S. Salvesen, A. D. Roses. “Apolipoprotein E: high-avidity binding to beta-amyloid and increased frequency of type 4 allele in late-onset familial Alzheimer disease.” PNAS, 1993, 90(5):1977-1981.
3. A. M. Saunders, W. J. Strittmatter, D. Schmechel, P. H. St. George-Hyslop, M. A. Pericak-Vance, S. H. Joo, B. L. Rosi, J. F. Gusella, D. R. Crapper-MacLachlan, M. J. Alberts, C. Hulette, B. Crain, D. Goldgaber, A. D. Roses. “Association of apolipoprotein E allele epsilon4 with late-onset familial and sporadic Alzheimer’s disease.” Neurology, 1993, 43(8) 1467.
4. J.C. Lambert, C.A. Ibrahim-Verbaas, D. Harold et al. “Meta-analysis of 74,046 individuals identifies 11 new susceptibility loci for Alzheimer’s disease.” Nat Genet, 2013, 45(12):1452-1458.
5. J.T. Yu, L. Tan, J. Hardy. Apolipoprotein E in Alzheimer’s disease: an update.” Annu Rev Neurosci, 2014, 37:79-100.
6. L.A. Farrer, L.A. Cupples, J. L. Haines, B. Hyman, W.A. Kukull, R. Mayeux, R.H. Myers, M.A. Pericak-Vance, N. Risch, C.M. van Duijn. “Effects of age, sex, and ethnicity on the association between apolipoprotein E genotype and Alzheimer’s disease. A meta-analysis. APOE and Alzheimer Disease Meta Analysis Consortium.” JAMA, 1997, 278(16):1349-1356.
7. F. Palesi, G. Castellazzi, L. Casiraghi, E. Sinforiani, P. Vitali, C. A. M. Wheeler-Kingshot, E. D’Angelo. “Exploring patterns of alteration in Alzheimer’s Disease brain networks: a combined structural and functional connectome analysis.” Frontiers in Neuroscience, 2016, doi.org/10.3389/fnins.2016.00380
8. Z. Dai, Q. Lin, T. Li, X. Wang, H, Yuan, X. Yu, Y. He, H. Wang. “Disrupted structural and functional brain networks in Alzheimer's disease.” Neurobiol Aging, 2019, 75:71–82.
9. A.P. Badhwar, A. Tam, C. Dansereau, P. Orban, F. Hoffstaedter, P. Bellec. “Resting-state network dysfunction in Alzheimer’s disease: A systematic review and meta-analysis.” Alzheimer’s and Dementia: Diagnosis, Assessment and Disease Monitoring, 2017, 8, 73–85.
10. A. Mohan, A.J. Roberto, A. Mohan, A. Lorenzo, K. Jones, M.J. Carney, L. Liogier-Weyback, S. Hwang, K.A.B. Lapidus. “The Significance of the Default Mode Network (DMN) in Neurological and Neuropsychiatric Disorders: A Review.” Yale J Biol Med, 2016, 89(1):49– 57.
11. C.-C. Huang, W.-M. Huang, C.-H. Chen, Z.-Y. Jhou, The Alzheimer's Disease Neuroimaging Initiative, and C.-p. Lin. The combination of functional and structural MRI is a potential screening tool in Alzheimer's disease. (2018) Frontiers in Aging Neuroscience, doi.org/10.3389/fnagi.2018.00251.
12. Y. Deng, L. Shi, Y. Li, D. Wang, Alzheimer’s Neuroimaging Initiative. “Altered topological organization of high-level visual networks in Alzheimer’s disease and mild cognitive impairment patients.” Neuroscience Letters. 2016, 630:147-153.
13. Z. Wang, K. Qiao, G. Chen, D. Sui, H.-M. Dong, Y.-S. Wang, H.-J. Li, J. Lu, X.-N. Zuo, Y. Han. “Functional connectivity changes across the spectrum of subjective cognitive decline, amnestic mild cognitive impairment and Alzheimer’s disease.” Front Neuroinform, 2019. Doi: https://doi.org/10.3389/fninf.2019.00026.
14. Q. Wen, S. M. Mustafi, J. Li, S. L. Risacher, E. Tallman, S. A. Brown, J. D. West, J. Harezlak, M. R. Farlow, F. W. Unverzagt, S. Gao, L. G. Apostolova, A. J. Saykin, Y.-C. Wu, White matter alterations in early-stage Alzheimer's disease: A tract-specific study. (2019) Alzheimer's & Dementia: Diagnosis, Assessment & Disease Monitoring, 11:576-587.
15. Q. Wang, Y. Wang, J. Liu, C. L. Sutphen, C. Cruchaga, T. Blazey, B. A. Gordon, Y. Su, C. Chen, J. S. Shimony, B. M. Ances, N. J. Cairns, A. M. Fagan, J. C. Morris, T. L.S. Benzinger, Quantification of white matter cellularity and damage in preclinical and early symptomatic Alzheimer's disease. (2019) NeuroImage: Clinical, 22:101767.
16. Y. Chen, H. An, H. Zhu, T. Stone, J. K. Smith, C. Hall, E. Bullitt, D. Shen, W. Lin. White matter abnormalities revealed by diffusion tensor imaging in non-demented and demented HIV+ patients. (2009) NeuroImage, 47:1154–1162
17. M. D. Cykowski, P. T. Fox, R. J. Ingham, J. C. Ingham, D. A. Robin. A study of the reproducibility and etiology of diffusion anisotropy differences in developmental stuttering: a potential role for impaired myelination. (2010) NeuroImage, 52:1495–1504.
18. D. K. Jones, T. R. Knösche and R. Turner. White matter integrity, fiber count and other fallacies: the do’s and dont’s of diffusion MRI. (2013) NeuroImage, 73:239-254.
19. C. C. Chang, C. C. Chow, L. C. Telier, S. Vattikuti, S. M. Purcell, J. J .Lee. Second-generation PLINK: rising to the challenge of larger and richer datasets. (2015) GigaScience 4:7.
20. S. McCarthy, S. Das, W. Kretzschmar, et al., Haplotype Reference Consortium. A reference panel of 64,976 haplotypes for genotype imputation. Nature Genetics, 48:1279-1283.
21. P.R. Loh, P. Danecek, P. F. Palamara, et al. Reference-based phasing using the haplotype reference consortium panel. (2016) Nature Genetics, 48:1443-1448.
22. S. Das, L. Forer, S. Schonherr, et al. Next-generation genotype imputation service and methods. (2016) Nature Genetics, 48:1248-1287.
23. J. J .Corneveaux, A. J. Myers, A. N. Allen, et al. Association of CR1, CLU and PICALM with Alzheimer's disease in a cohort of clinically characterised and neuropathologically verified individuals. (2010) Human Molecular Genetics, 19:3295-3301.
24. L. Koelewijn, T. M. Lancaster, D. Linden, D. C. Dima, B. C. Routley, L. Magazzini, K. Barawi, L. Brindley, R. Adams, K. E. Tansey, A. Bompas, A. Tales, A. Bayer, K. D. Singh. Oscillatory hyperactivity and hyperconnectivity in young APOE-e4 carriers and hypoconnectivity in Alzheimer's disease. (2019) eLife, 8:e36011.
25. J.-D. Tournier, R. E. Smith, D. Raffelt, R. Tabbara, T. Dhollander, M. Pietsch, D. Christiaens, B. Jeurissen, C.-H. Yeh, A. Connelly. MRtrix3: A fast, flexible and open software framework for medical image processing and visualisation. (2019) NeuroImage, 202:116-37.
26. J.-D. Tournier, F. Calamante, A. Connelly. Improved probabilistic streamlines tractography by 2nd order integration over fibre orientation distributions. (2010) Proceedings of the International Society for Magnetic Resonance in Medicine, 1670.
27. R. E. Smith, J.-D. Tournier, F. Calamante, A. Connelly. Anatomically-constrained tractography: Improved diffusion MRI streamlines tractography through effective use of anatomical information. (2012) NeuroImage, 62:1924-1938.
28. R. E. Smith, J.-D. Tournier, F. Calamante, A. Connelly. SIFT2: Enabling dense quantitative assessment of brain white matter connectivity using streamlines tractography. (2015) NeuroImage, 119, 338-351
29. R. S. Desikan, F. Segonne, B. Fischl, B. T. Quinn, B. C. Dickerson, D. Blacker, R. L. Buckner, A. M. Dale, R. P. Maquire, B. T. Hyman, M. S. Albert, R. J. Killiany. (2006) An automated labeling system for subdividing the human cerebral cortex on MRI scans into gyral based regions of interest. NeuroImage (31): 968-980.
30. M. Rubinov and O. Sporns. Complex network measures of brain connectivity: uses and interpretations. (2010) NeuroImage. 52(3): 1059-1069.
31. Y. Benjamini and D. Yekutieli. The control of the false discovery rate in multiple testing under dependency. (2001) The Annals of Statistics, 29(4): 1165-1188.
32. C. Fennema-Notestine, M. S. Panizzon, W. R. Thompson, C. H. Chen, L. T. Eyler, B. Fischl, C. E. Franz, M. D. Grant, A. J. Jak, T. L. Jernigan, M. J. Lyons, M. C. Neale, L. J. Seidman, M.T. Tsuang, H. Xian, A. M. Dale, W. S. Kremen. Presence of ApoE ε4 allele associated with thinner frontal cortex in middle age. (2011) J Alzheimers Dis. 26(Suppl 3):49-60.
Figures