3307
High-Resolution Myelin Water Imaging Using MPnRAGE1Medical Physics, University of Wisconsin-Madison, Madison, WI, United States, 2Waisman Center, University of Wisconsin-Madison, Madison, WI, United States, 3Psychiatry, University of Wisconsin-Madison, Madison, WI, United States, 4Pediatrics, University of Wisconsin-Madison, Madison, WI, United States
Synopsis
Keywords: Quantitative Imaging, Brain, Myelin
A T1-only method to extract a quantitative myelin water fraction, utilizing a 3D radial k-space MPnRAGE sequence that reconstructs hundreds of different inversion time (TI) images in the same scan used for high-resolution T1-weighted morphometry was developed. To address high sensitivities to additive image noise of this complex model, a multi-pass fitting algorithm was prototyped that provides educated initial guesses and constraints on the underlying parameters.Introduction
The myelin sheath plays a critical role in brain communication and connectivity, helping to form efficient neural pathways that underlie integrated systems that ultimately give rise to higher order function. The ability to characterize myelin with imaging provides biomarkers for studying white matter development and neurodegenerative disease. Multicomponent analysis of relaxation time data, termed multicomponent relaxometry, has consistently reported at least two water compartments with distinct T1 and T2 relaxation times: a fast-relaxing water pool attributed to water trapped between the myelin sheath; and a slower-relaxing water pool attributed to intra-/extra-cellular water1,2. The fraction of signal from the myelin-bound water, termed the myelin water volume fraction (MWF), has been shown to strongly correlate with histological assessments of myelin content and provide improved myelin specificity3,4. However, to decompose the MR signal into the contributions from distinct water components, many measurements are needed. As such, many of the existing T2-, T1-, and steady-state-based myelin water imaging (MWI) techniques require >1mm in-plane resolution or thick slices to maintain clinically feasible acquisition times5.MPnRAGE (Magnetization Prepared with n Rapid Gradient Echoes) is a quantitative T1 (qT1) mapping technique capable of producing high-resolution (i.e., 1 mm3), self-navigated motion corrected qT1 maps in under 10 minutes6,7,8,9,10. Moreover, with over 300 measurements sampled along the inversion recovery (IR) curve, including measurements with inversion times as low as 10ms, extension of the MPnRAGE model to multicomponent relaxation may provide a unique framework for myelin water imaging.
Methods
Proposed method: The multicompartment MPnRAGE signal can be written as$$$S_{IR} = MWF \cdot S_{IR,F}(T1_F,IE_F,B1) + (1 - MWF) \cdot S_{IR,S}(T1_S,IE_S,B1)$$$
where MWF is the myelin water fraction and SIR,F and SIR,S are the MPnRAGE signal models for the fast and slow T1 compartments, respectively. SIR,S is multiplied by (1 – MWF) to impose the constraint that the volume fractions must sum to 1. Each T1 species also has its own inversion efficiency (IEF, IES). The six unknowns, MWF, T1F, IEF, T1S, IES, and B1 can be solved for through least squares minimization of the residual between the measured and model signals.
Compared to the three-unknown single-compartment model, the increased number of unknowns and complexity in the two-compartment model creates added sensitivity to noise in the fitting process. Previous studies have shown that a two-step fitting method can improve T1 fitting through a combination of smoothing IE and B1 maps and reducing the number of unknowns6,11,12,13. A schematic of the proposed fitting method is shown in Figure 1.
Simulations: Simulations using the lsqnonlin function in MATLAB (2021b, The MathWorks Inc., Natick, MA) informed the development of the multi-pass fitting method. 125 two-compartment signals with and without noise were simulated using the MPnRAGE signal model. The signals from each voxel were fit to the single-compartment model with three unknowns (T1,IE,B1) for the first pass and the two-compartment model with six unknowns for the second pass. The resulting IEF, IES, and B1 maps were smoothed and set as fixed values for the third pass with three unknowns (T1F,T1S,MWF).
In Vivo Fitting: The three-pass fitting method was applied to retrospective in vivo data: (1) Single compartment with three unknowns, (2) Two-compartment with six unknowns, (3) Two-compartment with three unknowns. Following each pass, the IE and B1 maps were smoothed with a 5x5x5 box filter before being used to initialize and constrain the following pass.
Results
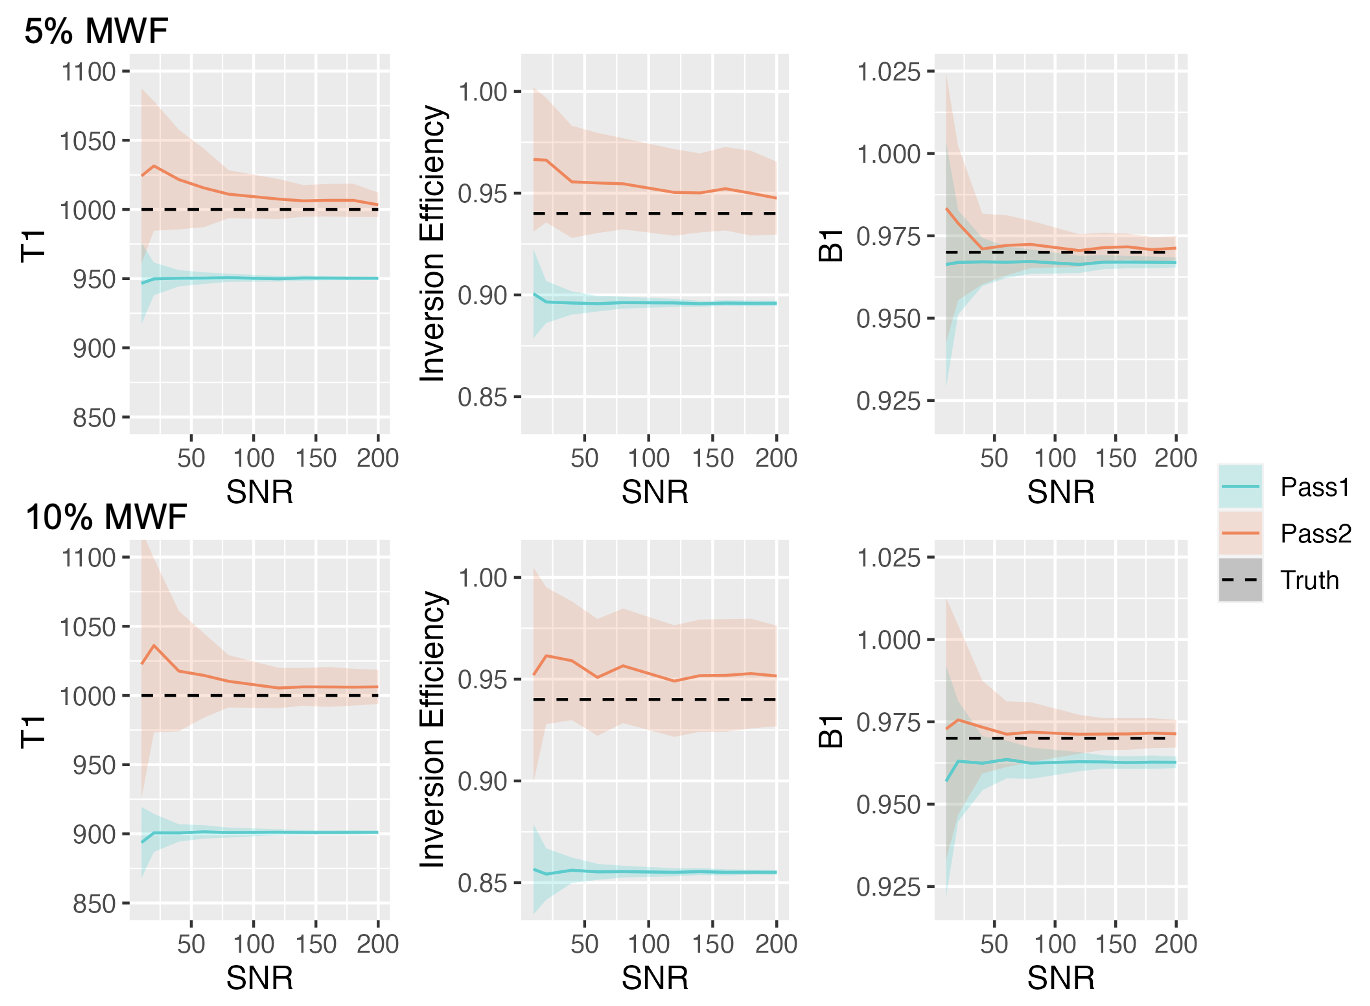
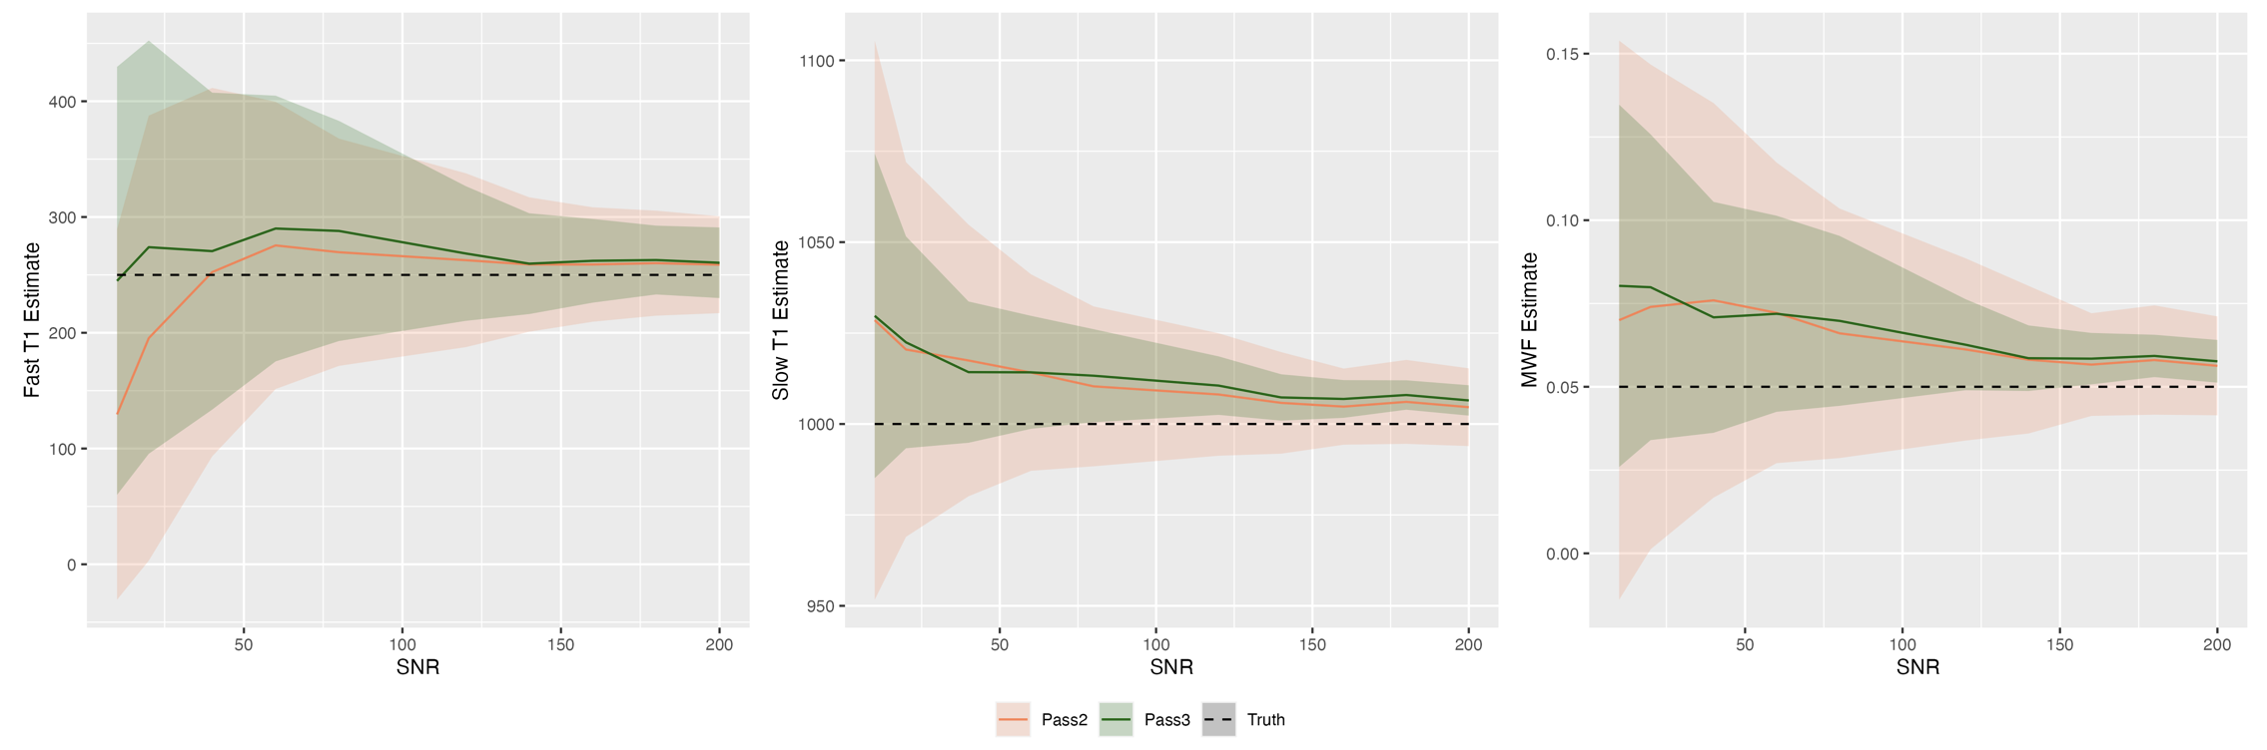
Simulations: Noiseless signals can be perfectly fit to the two-compartment model independent of algorithm initialization. Results of the first pass with 125 simulated voxels at both 5% and 10% MWF and varied SNR are shown in Figure 2. Since the signal is heavily dominated by the slow component, the estimated parameters of the single compartment fit provide close estimates to the slow component, although all values are slightly under-estimated. These results inform the following educated constraints for the ensuing two compartment fit: (i) T1S should be greater than the single compartment T1 estimate, and T1F should be lower. (ii) IES should be greater than the single compartment IE estimate, and IEF should be lower. (iii) The true B1 should be greater than the single compartment B1 estimate.Results of the second and third passes are shown in Figure 3. While the mean values for T1F, T1S, and MWF are similar, the standard deviation is reduced by eliminating IEF, IES, and B1 as unknowns.
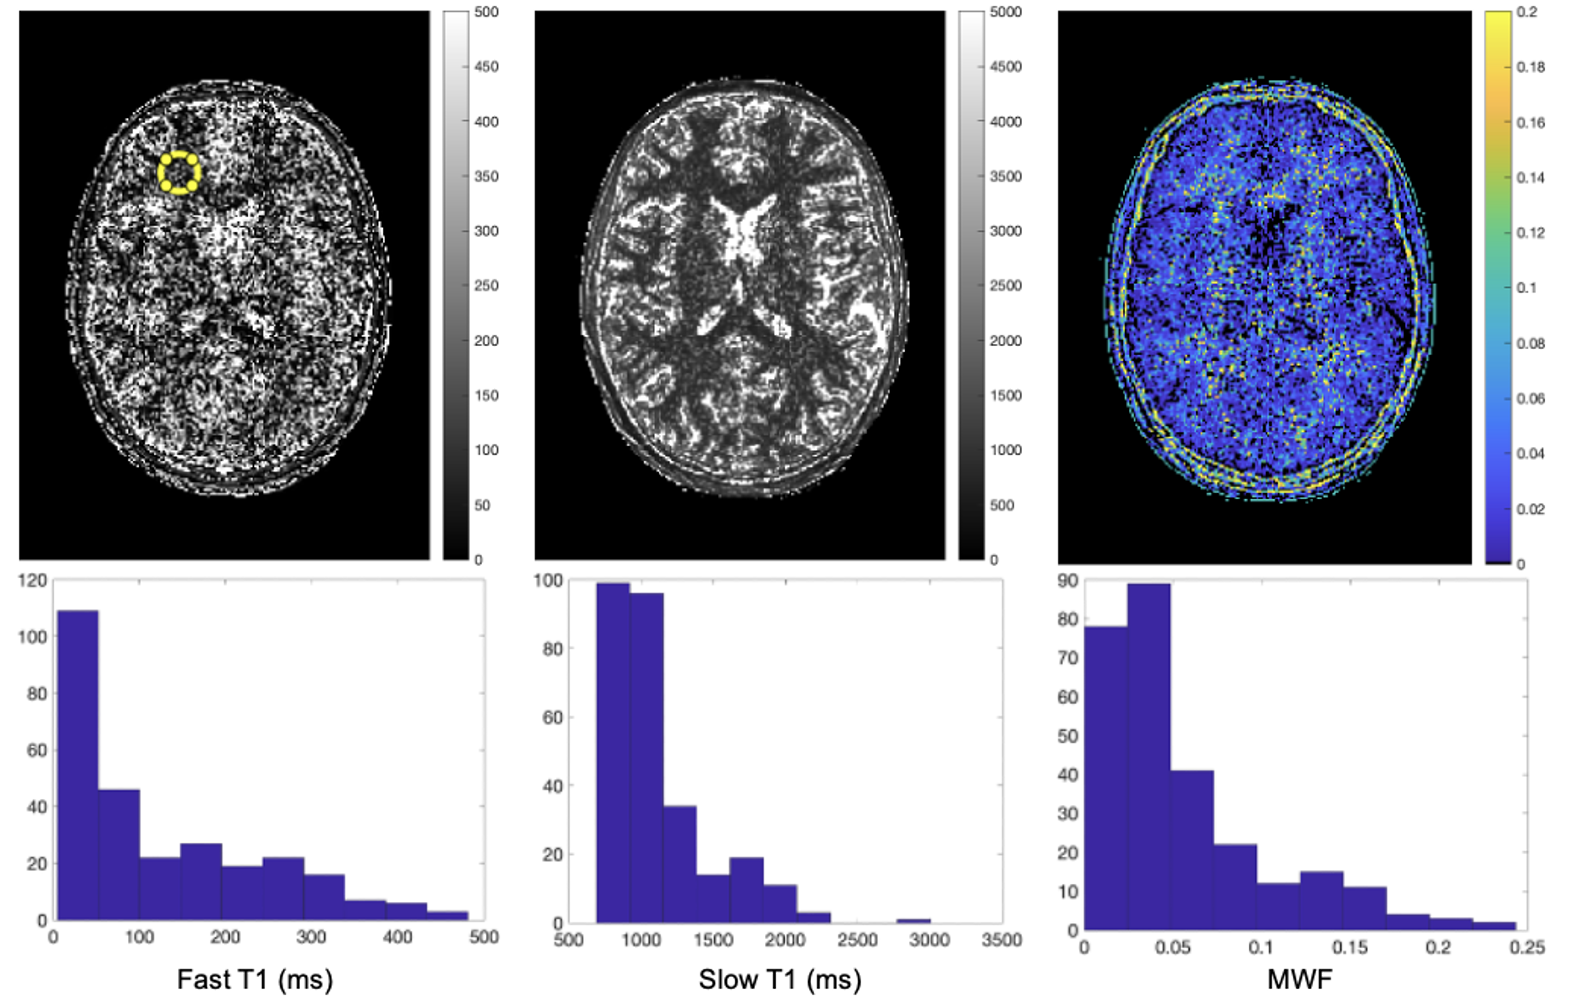
In Vivo Fitting: T1F, T1S, and MWF maps from the second pass are shown in Figure 4. Expected structure and values are apparent in both T1F and MWF maps. However, the fitting results of the second pass display the sensitivity to noise seen in simulations (Figures 2 and 3).
Discussion & Conclusion
The above results demonstrate that myelin water fraction may be derived from fitting the inversion recovery curves of the MPnRAGE pulse sequence to a two-compartment model. A multi-pass fitting technique has been developed, leveraging single-compartment fitting results and prior knowledge of smoothness to determine educated initial values and constraints for the two-compartment fit. Preliminary in vivo results demonstrate reasonable values and structure in the fast T1 and MWF maps but display sensitivity to noise. Further optimization of the fitting algorithms and MPnRAGE acquisition are necessary to improve performance.Acknowledgements
This work was supported by R00 MH11056 (Dr. Dean) from the National Institute of Mental Health; R34 DA0502458 (Dr. Alexander) from the National Institute of Drug Abuse; and 1R01 HD108868 (Dr. Alexander, Dr. Kecskemeti) from the Eunice Kennedy Shriver NICHD, National Institutes of Health. Infrastructure support was also provided, in part, by grant U54 HD090256 from the Eunice Kennedy Shriver NICHD, National Institutes of Health (Waisman Center).References
1. MacKay, A., Laule, C., Vavasour, I., Bjarnason, T., Kolind, S., & Mädler, B. (2006). Insights into brain microstructure from the T2 distribution. Magnetic resonance imaging, 24(4), 515–525. https://doi.org/10.1016/j.mri.2005.12.037
2. Whittall, K. P., MacKay, A. L., Graeb, D. A., Nugent, R. A., Li, D. K., & Paty, D. W. (1997). In vivo measurement of T2 distributions and water contents in normal human brain. Magnetic resonance in medicine, 37(1), 34–43. https://doi.org/10.1002/mrm.1910370107
3. Laule, C., Leung, E., Lis, D. K., Traboulsee, A. L., Paty, D. W., MacKay, A. L., & Moore, G. R. (2006). Myelin water imaging in multiple sclerosis: quantitative correlations with histopathology. Multiple sclerosis (Houndmills, Basingstoke, England), 12(6), 747–753. https://doi.org/10.1177/1352458506070928
4. Laule, C., Kozlowski, P., Leung, E., Li, D. K., Mackay, A. L., & Moore, G. R. (2008). Myelin water imaging of multiple sclerosis at 7 T: correlations with histopathology. NeuroImage, 40(4), 1575–1580. https://doi.org/10.1016/j.neuroimage.2007.12.008
5. Lee, J., Hyun, J. W., Lee, J., Choi, E. J., Shin, H. G., Min, K., Nam, Y., Kim, H. J., & Oh, S. H. (2021). So You Want to Image Myelin Using MRI: An Overview and Practical Guide for Myelin Water Imaging. Journal of magnetic resonance imaging : JMRI, 53(2), 360–373. https://doi.org/10.1002/jmri.27059
6. Kecskemeti, S., Samsonov, A., Hurley, S. A., Dean, D. C., Field, A., & Alexander, A. L. (2016). MPnRAGE: A technique to simultaneously acquire hundreds of differently contrasted MPRAGE images with applications to quantitative T1 mapping. Magnetic resonance in medicine, 75(3), 1040–1053. https://doi.org/10.1002/mrm.25674
7. Kecskemeti, S., Samsonov, A., Velikina, J., Field, A. S., Turski, P., Rowley, H., Lainhart, J. E., & Alexander, A. L. (2018). Robust Motion Correction Strategy for Structural MRI in Unsedated Children Demonstrated with Three-dimensional Radial MPnRAGE. Radiology, 289(2), 509–516. https://doi.org/10.1148/radiol.2018180180
8. Kecskemeti, S. R., & Alexander, A. L. (2020). Test-retest of automated segmentation with different motion correction strategies: A comparison of prospective versus retrospective methods. NeuroImage, 209, 116494. https://doi.org/10.1016/j.neuroimage.2019.116494
9. Kecskemeti, S., & Alexander, A. L. (2020). Three-dimensional motion-corrected T1 relaxometry with MPnRAGE. Magnetic resonance in medicine, 84(5), 2400–2411. https://doi.org/10.1002/mrm.28283
10. Kecskemeti, S., Freeman, A., Travers, B. G., & Alexander, A. L. (2021). FreeSurfer based cortical mapping and T1-relaxometry with MPnRAGE: Test-retest reliability with and without retrospective motion correction. NeuroImage, 242, 118447. https://doi.org/10.1016/j.neuroimage.2021.118447
11. Clare, S., & Jezzard, P. (2001). Rapid T(1) mapping using multislice echo planar imaging. Magnetic resonance in medicine, 45(4), 630–634. https://doi.org/10.1002/mrm.1085
12. Viles, J. H., Duggan, B. M., Zaborowski, E., Schwarzinger, S., Huntley, J. J., Kroon, G. J., Dyson, H. J., & Wright, P. E. (2001). Potential bias in NMR relaxation data introduced by peak intensity analysis and curve fitting methods. Journal of biomolecular NMR, 21(1), 1–9. https://doi.org/10.1023/a:1011966718826
13. Deichmann R. (2005). Fast high-resolution T1 mapping of the human brain. Magnetic resonance in medicine, 54(1), 20–27. https://doi.org/10.1002/mrm.20552
Figures
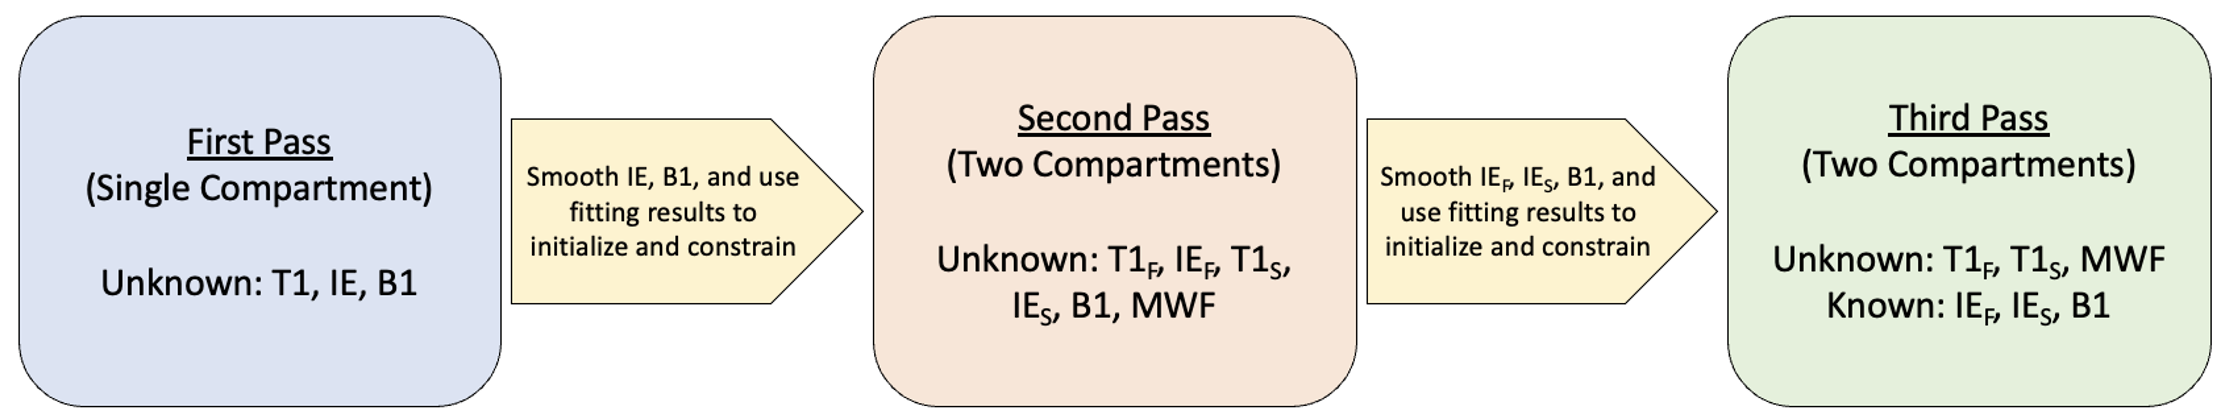
Figure 1: Schematic for the proposed multi-pass fitting method. Single-compartment fitting results will be smoothed and used to initialize and constrain the second pass, a two-compartment fit with six unknowns. The inversion efficiency and B1 maps from the second pass will be smoothed and fixed for the next pass to estimate T1F, T1S, and MWF.