3306
Mapping sodium relaxation parameters in brain using magnetic resonance fingerprinting at 7T1Department of Radiology, Center for Biomedical Imaging, New York University Grossman School of Medicine, New York, NY, United States, 2Department of Medicine, John A. Burns School of Medicine, University of Hawaii, Honolulu, HI, United States, 3Vilcek Institute for Graduate Biomedical Sciences, NYU Langone Health, New York, NY, United States, 4Centre for Advanced Imaging, The University of Queensland, Brisbane, QLD, Australia, 5ARC Training Centre for Innovation in Biomedical Imaging Technology, The University of Queensland, Brisbane, QLD, Australia
Synopsis
Keywords: MR Fingerprinting/Synthetic MR, Brain, Sodium, x - nuclei, relaxometry, 7 Tesla
We present a new MRF technique for simultaneous mapping of sodium T1, biexponential T2*, ion density, B+1 shift and B0 in the brain at 7T. This is accomplished using a 23 pulse MRF train combined with a UTE FLORET trajectory readout. Our technique is demonstrated in a 3 compartment phantom and in vivo across four healthy volunteers. Matching to a dictionary with over 800,000 signals produced parameter maps with good agreement to literature values. Flow and partial volume effects may interfere with matching T*2,short in CSF.
Introduction
The sodium ions (23Na+) produce the second strongest NMR signal in the human body1, however, low in vivo concentration of Na+ ions in brain tissue, and weak signal to noise ratio (SNR), make simultaneous quantitative evaluation of multiple 23Na+ parameters difficult1-3. Recent advances in sodium magnetic resonance fingerprinting (MRF) show promising results in the mapping of 23Na+ properties 3,4. In this work we present a new MRF technique for mapping sodium relaxation in the brain at 7T.Methods
We designed a fingerprinting pulse train optimized for tissue separation in the brain. The 23Na+ 3/2-spin dynamics were modeled using irreducible spherical tensor operators (ISTO) from an initial steady-state based on literature T1, T*2,long and T*2,short values 1,5. We set a length of 20 pulses for the fingerprinting train plus an initial 3-pulse composite 180° block used to improve RF homogeneity for the inversion pulse and to increase T1 sensitivity. We simultaneously optimized flip angle (θ) and phase angle (φ) using a genetic algorithm6. Our multipulse sequence used a 3D UTE spiral FLORET (Fermat looped, orthogonally encoded trajectories)3, 7 (Figure 1) for k-space sampling. The dictionary was constructed using ISTO dynamics to simulate the sodium system propagated under the evolution of the optimized 23-pulse train.We collected data in a 3 - compartment phantom (Table1) and 4 healthy volunteers (1 female, mean age = 32 ± 2 years) in accordance with institutional requirements. Experiments were performed at 7 Tesla (MAGNETOM, Siemens, Erlangen, Germany) using a 16 channel Tx/Rx dual tuned head coil developed in house8. A total of 8 averages were acquired at 5 mm isotropic resolution, FOV = 320 mm, TE = 0.2 ms, TR = 702 ms. For each ADC acquisition the sodium excitation rectangular pulse length was 0.8 ms. Delays (τ) between the 90° - 180° - 90° pulses in the composite block were 7.5 ms, then 15 ms throughout the rest of the pulse train. The FLORET trajectory consisted of three hubs at 45°, 100 interleaves/hub.
Images were reconstructed using gridding9. Complex images were denoised using random matrix theory10-12. We used the Pearson correlation to determine the best signal match between the data and dictionary. Because of the dictionary size, and due to the low SNR of the sodium images, more than one match could correlate to a single pixel. To account for this, we included signal matches for the highest 20 correlations per pixel and constructed the final maps as correlation-weighted averages.
Results and Discussion
We chose pixels from regions of interest from a single slice in the brain and phantom for statistical analysis. Pixels from the brain were selected by segmentation and coregistration of a proton MP2RAGE dataset13. The resulting phantom maps are shown in Figure 2. Table 1 compares relaxation measurements for the phantom using three different techniques. Table 2 provides mean relaxation times matched across the volunteer cohort. Parameter maps for a single volunteer are shown in Figure 3.
Compared to previous measurements on a similar phantom by Gilles et al3., and FLORET saturation and inversion recovery experiments done in house, sodium MRF tends to produce shorter relaxation times (Table 1). T*2,short ranges were most similar across methods, as these components are least effected by the pulse amplitude and phase variation.
We see areas of inhomogeneity in the B1+ shift and B0 maps shown in Figure 2. Looking at the T*2,long maps, areas of signal amplification or attenuation align with imperfections in the B1+ shift map. Mismatch between the dictionary and image is seen as an artifact through the center of the fluid compartment appearing in both relaxation and sodium density maps and overlapping with the mapped B0 inhomogeneity.
Literature reported relaxation times for CSF and brain tissue are between 15 – 35 ms for T1, 15 – 49 ms for T*2,long and between 0.8 and 7 ms for T*2,short 2,4. T1 times in CSF are generally reported between 55 ms and 65 ms which overlap with a monoexponential T*22,4. Relaxation time averages in the brain measured across our volunteer set (Table 2) fit within the ranges of previously reported values, with the exception of T*2,short in CSF. The dictionary mismatch for T*2,short in the CSF was consistent across volunteers and represented the greatest deviation from average relaxation time by ±10.3 ms. Matching for T*2,short across volunteers for GM and WM, however, represented the lowest deviations from average, 6.9 ±1 ms and 6.8 ± 2.2 ms, respectively.
Conclusion
We developed a sodium MRF technique to evaluate parameters in the brain at 7T. Studies across four healthy volunteers produced relaxation values within the range of literature reported values. Our parametric maps are calculated from comprehensive matching to a dictionary accounting for wide ranges of relaxation, chemical shift and field variance. CSF was matched lower than reported in literature which inspires further investigation into correction techniques for flow artifacts and partial volume effectsAcknowledgements
This research was supported by the NIH/NIBIB grant R01 EB026456, and performed under the rubric of the Center for Advanced Imaging Innovation and Research, a NIBIB Biomedical Technology Resource Center (P41 EB017183).References
1. Madelin G, & Regatte R R. Biomedical applications of sodium MRI in vivo. Journal of Magn. Reson. Imag., 2013; 38: 511-529.
2. Madelin G, Lee JS, Regatte RR, Jerschow A. Sodium MRI: Methods and applications. Prog Nucl Magn Reson Spectrosc. 2014; 79: 14-47.
3. Gilles, A., Nagel, A.M. & Madelin, G. Multipulse sodium magnetic resonance imaging for multicompartment quantification: Proof-of-concept. Sci Rep. 2017; 7: 17435
4. Kratzer, FJ, Flassbeck, S, Schmitter, S, et al. 3D sodium (23Na) magnetic resonance fingerprinting for time-efficient relaxometric mapping. Magn Reson Med. 2021; 86: 2412– 2425.
5. Syeda, W., Blunck, Y., Kolbe, S., Cleary, J.O., Johnston, L.A. A continuum of T2* components: flexible fast fraction mapping in sodium MRI. Magn. Reson. Med., 2019; 81 pp. 3854-3864
6. Katoch, S., Chauhan, S.S. & Kumar, V. A review on genetic algorithm: past, present, and future. Multimed Tools Appl. 2021; 80: 8091–8126.
7. Pipe JG, Zwart NR, Aboussouan EA, Robison RK, Devaraj A, Johnson KO. A new design and rationale for 3D orthogonally oversampled k-space trajectories. Magn Reson Med. 2011; 66(5): 1303-11.
8. Wang, B, Zhang, B., Yu, Z., Ianniello C., Lakshmanan K., Paska, J., Madelin, G., Cloos, M. & Brown, R. A radially interleaved sodium and proton coil array for brain MRI at 7T. NMR Biomed. 2021; e4608.
9. Zwart NR, Johnson KO, Pipe JG. Efficient sample density estimation by combining gridding and an optimized kernel. Magn Reson Med. 2012; 67(3): 701-10.
10. Veraart J, Novikov DS, Christiaens D, Ades-Aron B, Sijbers J, Fieremans E. Denoising of diffusion MRI using random matrix theory. Neuroimage 2016; 142: 394-406.
11. Lemberskiy G, Baete S, Veraart J, Shepherd TM, Fieremans E, Novikov DS. Achieving sub-mm clinical diffusion MRI resolution by removing noise during reconstruction using random matrix theory. In Proceedings 27nd Scientific Meeting #0770, International Society for Magnetic Resonance in Medicine, Montreal, Canada, 2019 2019.
12. Lemberskiy G, Baete S, Veraart J, Shepherd TM, Fieremans E, Novikov DS. MRI below the noise floor. In Proceedings 28nd Scientific Meeting #3451, International Society for Magnetic Resonance in Medicine, Melbourne, Australia, 2020 2020.
13. Rodriguez, G.G., Yu, Z., O′Donnell, L.F. et al. Repeatability of simultaneous 3D 1H MRF/23Na MRI in brain at 7 T. Sci Rep. 2022; 12: 14156
Figures
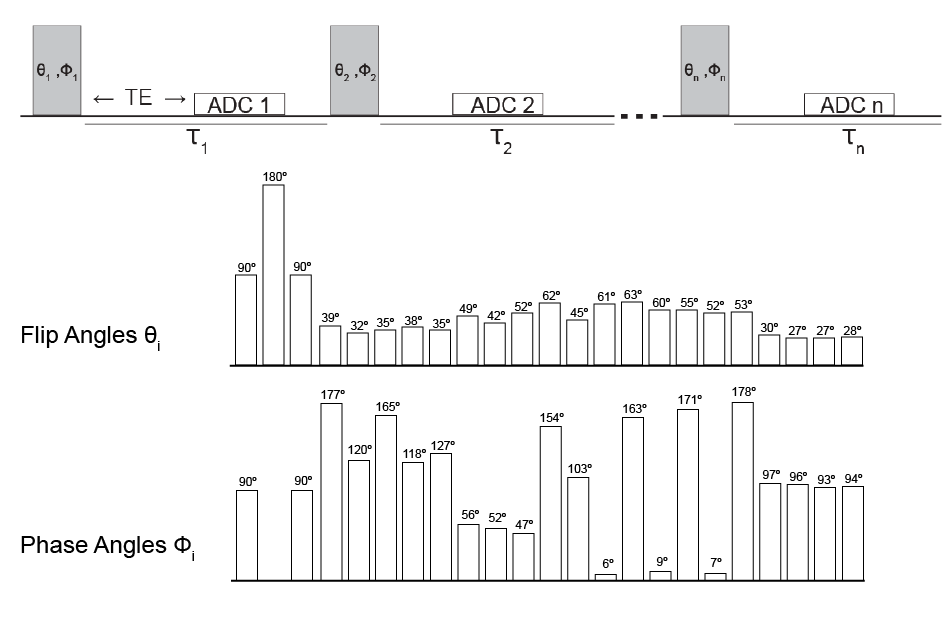
Figure 1. Optimized pulse sequence for 23Na-MRF. The FA and PA trains were optimized to give the greatest separation between GM and WM signals. The acquisition parameters were 5 mm isotropic, FOV = 320 mm, TE = 0.2 ms, TR = 702 ms, Tau 1 = Tau 2 = 7.5 ms, Tau 3 … Tau 23 = 15 ms. The FLORET trajectory parameters were 3 hubs at 45° with 100 interleaves/hub.
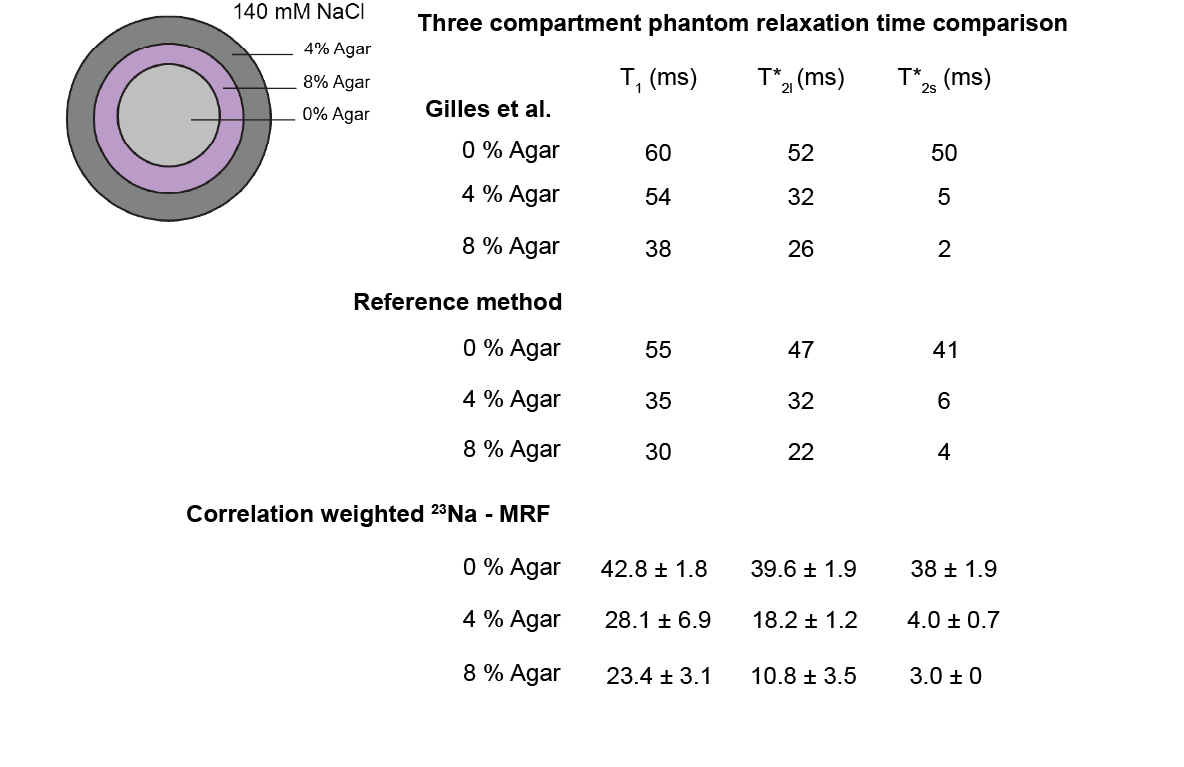
Table 1. Comparison of relaxation times measured for the 3 compartment phantom. Gilles et al. used a similar phantom (fluid, agar 4% and 8%, 140 mM sodium) for a previous study3, the result from that work is presented at the top of the table. The middle table includes values from measuring T1 and T2* using FLORET saturation and inversion recovery at 7T. The third section are the results from measuring relaxation using the proposed MRF method.
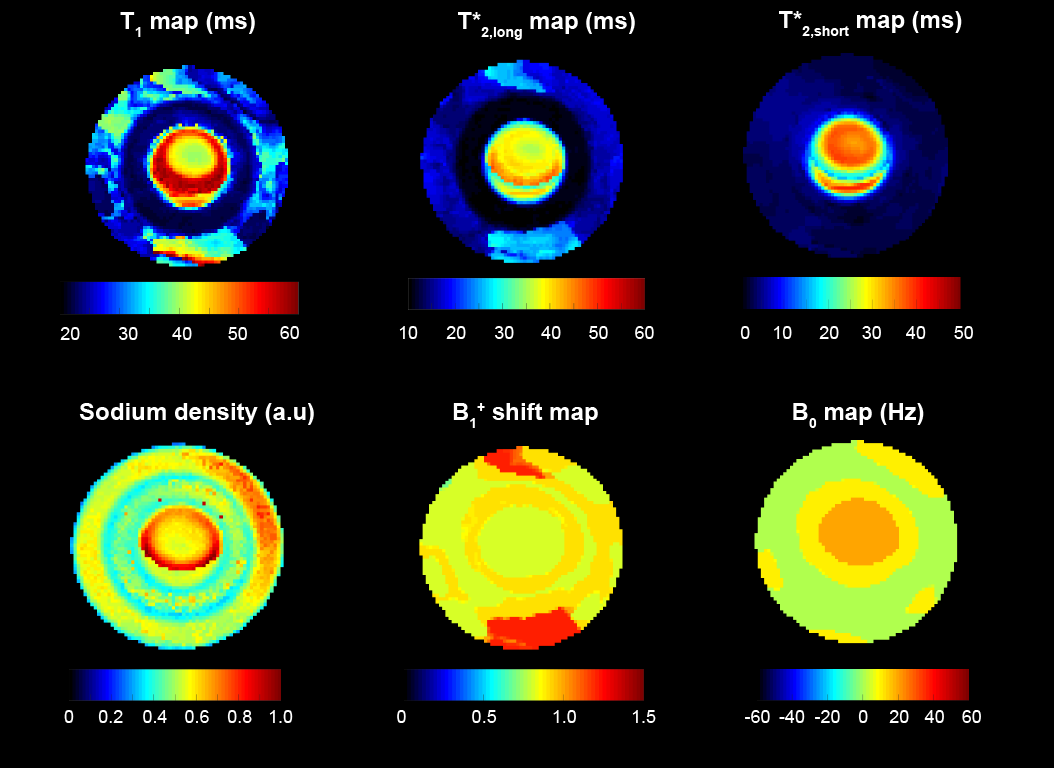
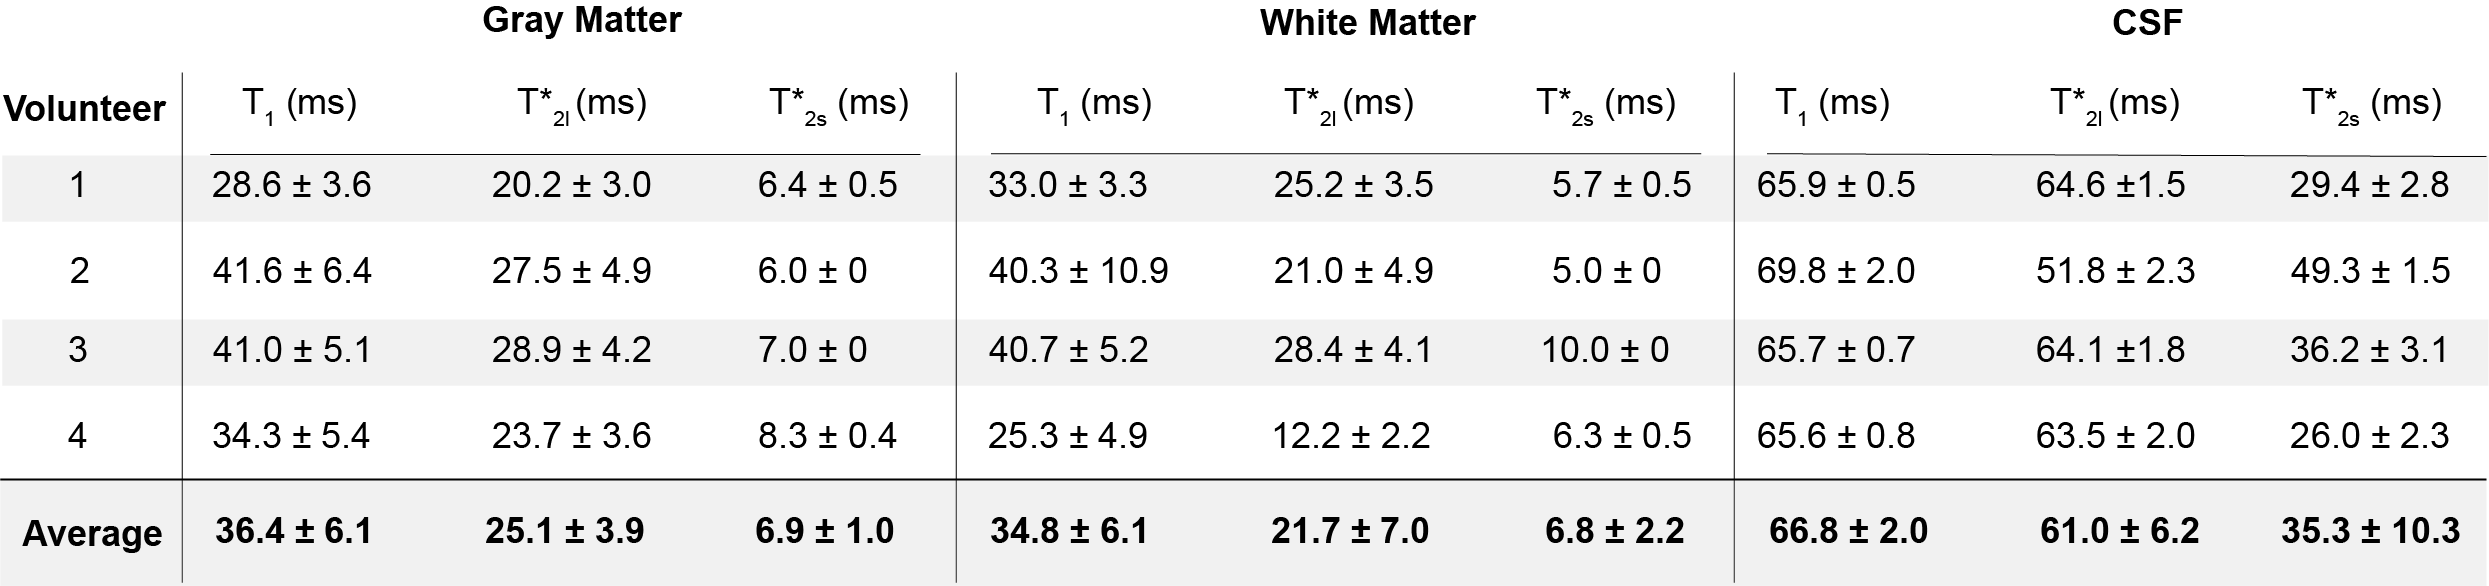
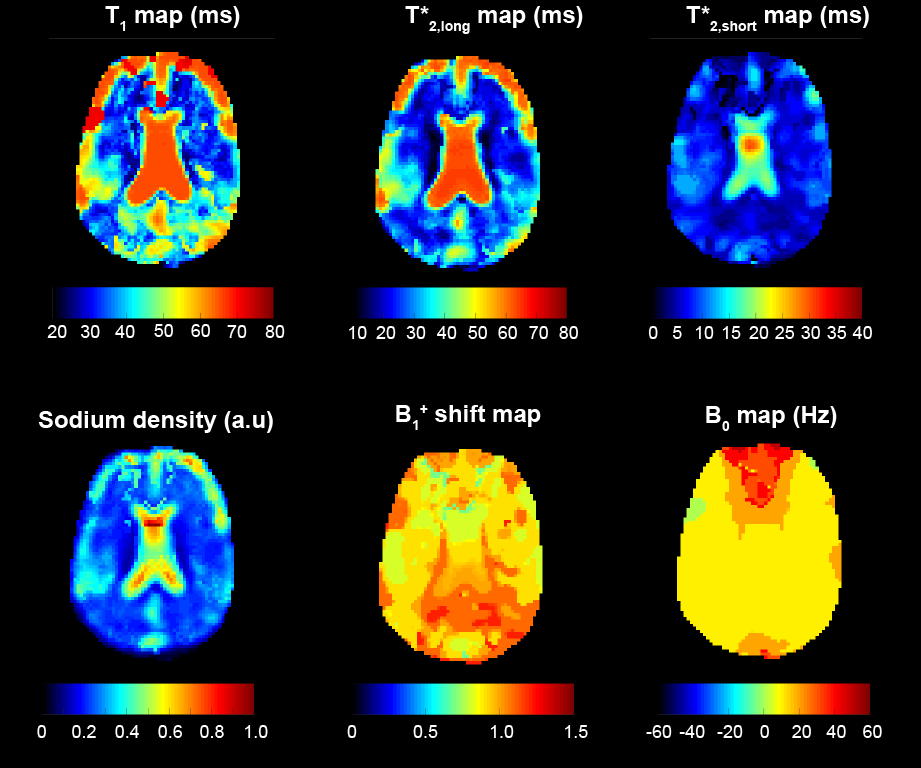
Figure 3. Parameter maps for a single volunteer. For acquisition parameters, see Figure 1. The dictionary parameters were equivalent to those for the phantom measurements given in Figure 2.