3304
Clinical deployment of novel quantitative neuro-image analysis techniques using containerisation technology1Lysholm Department of Neuroradiology, National Hospital for Neurology and Neurosurgery, University College London Hospitals NHS Foundation Trust, London, United Kingdom, 2Department of Brain Repair and Rehabilitation, UCL Institute of Neurology, University College London, London, United Kingdom, 3Centre for Medical Image Computing, Department of Computer Science, University College London, London, United Kingdom, 4Centre for Microscopy, Characterisation, and Analysis, University of Western Australia, Perth, Australia, 5Advanced Research Computing Centre, University College London, London, United Kingdom, 6Department of Clinical and Experimental Epilepsy, UCL QS Institute of Neurology, London, United Kingdom, 7Department of Radiology and Nuclear Medicine, Amsterdam UMC, Amsterdam, Netherlands
Synopsis
Keywords: Data Analysis, Software Tools, Containerisation
The challenges encountered in development and clinical deployment of quantitative neuroradiological software techniques for in-house use can be overcome to some degree, through the application of a multi-disciplinary approach, and the use of containerisation. However, full life-cycle support including post-market surveillance presents a more significant obstacle.Introduction
Translation of any technology from the research to the clinical domain is notoriously challenging and medical device software is no exception. The Quantitative Neuroradiology Initiative (QNI)1 was established as a model framework to facilitate the transition of model-based artificial intelligence/machine learning and other model-based image quantification software from the research domain into hospital neuroradiology workflows. Tools to support neuroradiology reporting are developed under this framework and delivered as containerised packages using Docker2. These containerised applications are then deployed and run using an in-house software, the QNI Central Engine (QNI-CE), that translates the analysis into an integrated, DICOM based, radiological workflow.Methods
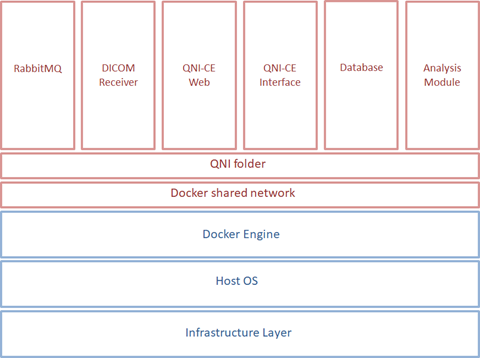
The QNI project is supported by a multi-discipline team of hospital-based neuroradiologists and clinical scientists and university-based medical imaging computing scientists and software developers. MRI biomarkers addressing radiological needs are identified in the clinical domain, and techniques for their quantification and validation pursued in the research domain before a tool is implemented for evaluation and deployment in clinical practice. From a regulatory perspective, deploying medical device software (whether developed externally or in-house), needs a careful multi-disciplinary approach, with robust risk assessment undertaken under a quality management system (QMS). There are long-term support issues to be considered: research activity developing software rarely factors in life-cycle management responsibilities and best-practice in academia does not commonly equate to development under a QMS. There are also challenges in the choice of software platform and data formats between the two domains: MRI research data is normally processed in NIfTI format using Linux based tools whereas in the clinical domain DICOM data is typically stored and accessed from Windows servers or PCs.We address these challenges by using containerisation technology, specifically Docker2. This allows our analysis tools to be built for a Linux environment and then deployed via a Docker engine with minimal external dependencies rather than being reliant on a specific operating system that might not be available within a hospital’s IT infrastructure. Analysis modules are configured and run using our QNI Central Engine (QNI-CE), a Python application integrating the analysis modules with a DICOM workflow, brokering data exchange and analysis execution. Figure 1 shows the containers used by QNI-CE.
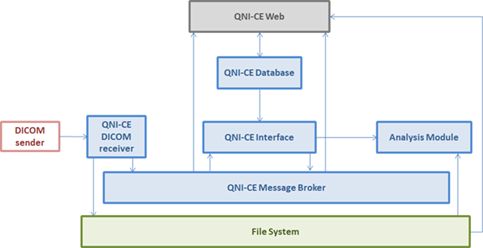
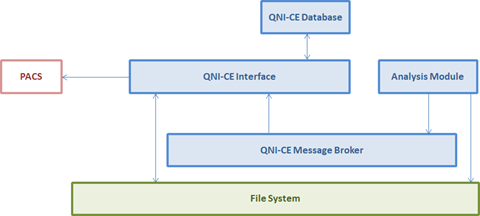
Image series are pulled or pushed from PACS to QNI-CE and results are returned as DICOM series associated with the original MR study. Figures 2 and 3 show how the different QNI-CE containers interact when the system is receiving (Figure 2) and then sending back to PACS once analysis is complete (Figure 3).
The QNI-CE software was developed in-house under a QMS, with the technical file (including risk management documentation) written alongside the software development and testing processes. In-line image quality control is currently supported as a manual process: fully automated QC is a work in progress.
Results
Our first use-case is a tool providing neuroradiologists with a quantitative visual report of hippocampal volume and T2 relaxation time in epilepsy patients5,6, available at their PACS reporting workstations. This has supported radiology reports for 142 patients over 16 months. To date, there have been 2 cases where the system has failed to generate reports correctly: the first was due to a disk space issue whereby the messaging service was unable to run correctly thus preventing the input DICOM series from being processed and highlighting the need for such tools to be run on fully support infrastructure; the second was where the DICOM report could not be read from PACS – further investigation suggested that this was due to an error in the send operation causing the report to become corrupted.Further applications are under development to support reporting across other neurological indications: the QNI-CE has been developed to support single- and multi-modal MRI data for both cross-sectional and longitudinal analyses.
Conclusion
A multi-disciplinary approach to the development and life-cycle management of novel software, combined with the use of technology such as Docker, offers a way to move prototype analysis pipelines into clinical practice. Regulatory concerns can be partially addressed by developing software under an appropriate QMS. However, long term support can still present a challenge, as does conformance to clinical IT system legislation and medical device regulations.Acknowledgements
This work was supported by the UCLH NIHR Biomedical Research Centre and the UCL-Wellcome Institutional Strategic Support Fund.References
1. Goodkin O, Pemberton H, Vos SB, Prados F, Sudre CH, Moggridge J, et al.The Quantitative Neuroradiology Initiative Framework: Application to Dementia. Br J Radiology. Sep 2019;92(1101):20190365
2. Docker. https://www.docker.com. Accessed October, 2022
3. RabbitMQ. https://www.rabbitmq.com. Accessed October, 2022
4. PostgreSQL. https://www.postgresql.org. Accessed October, 2022
5. Vos SB, Winston GP, Goodkin O, Pemberton HG, Barkhof F, Prados F, et al. Hippocampal profiling: Localized magnetic resonance imaging volumetry and T2 relaxometry for hippocampal sclerosis. Epilepsia. Feb 2020;61(2):297–309.
6. Goodkin O, Pemberton HG, Vos SB, Prados F, Das RK, Moggridge J, et al. Clinical evaluation of automated quantitative MRI reports for assessment of hippocampal sclerosis. Eur Radiology. Jan 2020;31(1):34-44
Figures