3298
Increasing sampling efficiency using Yarnball sampling in 3D fast spin echo with long echo trains – TurboYarn1Biomedical Engineering, University of Alberta, Edmonton, AB, Canada
Synopsis
Keywords: Pulse Sequence Design, Brain
An efficient k-space sampling strategy using 3D Yarnball was used in long echo train FSE (TurboYarn). As TurboYarn samples many lines worth of k-space in each readout, fully sampled isotropic 1 mm brain scans were acquired in 40 s. TurboYarn was compared to a time-equivalent, 4x under-sampled 3D FSE sequence in brain of three healthy subjects. Resulting images showed excellent GM/WM contrast for TurboYarn, with CNRs higher than 3D FSE. As each readout samples k-space centre, further work will investigate TurboYarn motion robustness, with additional SNR improvements via trajectory and flip angle train optimizations.Introduction
3D fast spin echo (FSE) imaging (1,2) provides isotropic high-resolution clinical images and allows selection of various contrasts (3,4). Generally, data is acquired in a Cartesian manner with differing amounts of sampling reduction (e.g. (5)) to reduce the acquisition time, while view-ordering schemes allow reduction of blurring due to T2 decay (6–8). To increase FSE sampling efficiency for very rapid imaging, this work investigates the implementation of a 3D Yarnball (9), which samples much more than one line of k-space per acquisition. Fully sampled “TurboYarn” was compared to 4x under-sampled, radial-ordered 3D FSE for the creation of 1 mm isotropic T2-weighted images in ~40 second scan time.Methods
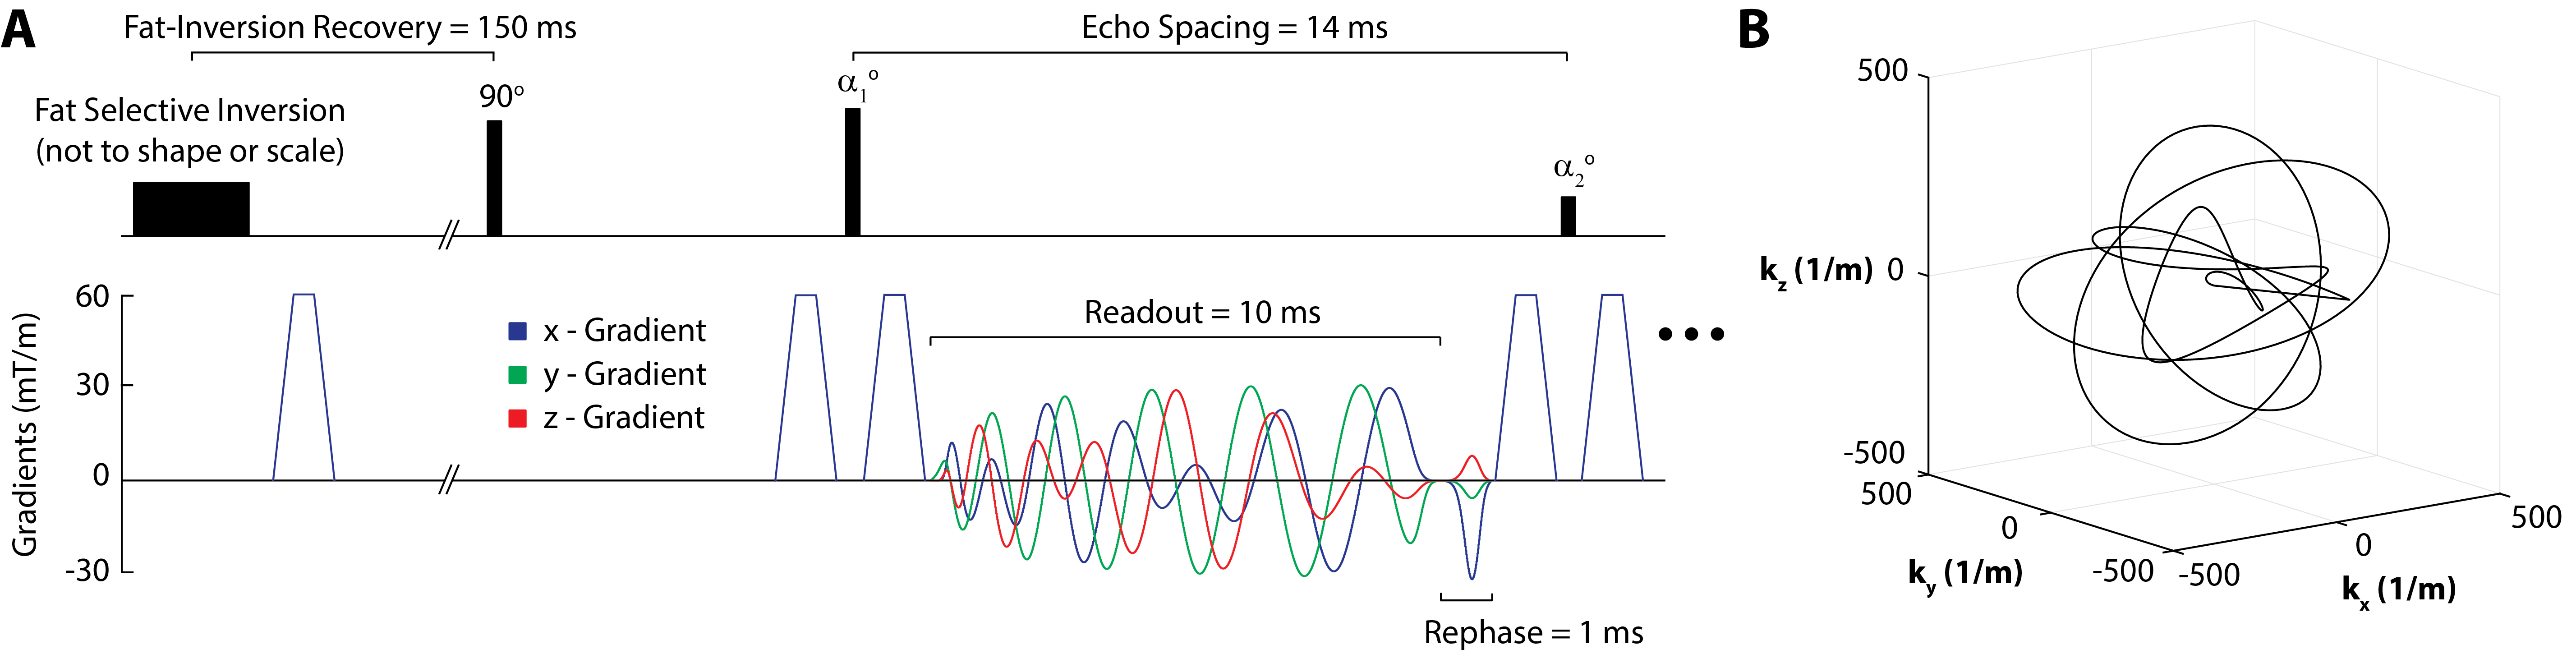
In 3D FSE with long echo trains, flip angle evolution in conjunction with TE (acquisition of the center of k-space) and TR is used to produce the desired contrast between tissues. In the case of TurboYarn, as the center of k-space is sampled during each acquisition, a flip angle train producing a constant decay curve for white matter (WM, T2 = 68 ms, T1 = 900 ms (10)) was calculated using a steady-state Bloch equation simulator (11,12).A total of 2178 Yarnball trajectories of 10 ms duration fully sampled k-space to 1 mm3 (kmax = 500 1/m) isotropic, following methodology of (9) (Figure 1). However, here, gradients and gradient moments were subsequently zeroed following acquisition, yielding an echo spacing of 14 ms with the inclusion of crusher gradients. Fat signal was minimized using Spectral Presaturation with Inversion Recovery (SPIR, (13)). For this initial investigation of TurboYarn, k-space centre sampling (at the trajectory start) does not coincide with the centre of the spin echo, and thus, this implementation additionally possesses some T2* weighting.
Two TurboYarn sequences with train lengths (ETL) of 44 (TR = 1 s) and 119 (TR = 2 s) were constructed, resulting in acquisition times of 56 s and 40 s, respectively, to investigate signal and contrast characteristics. Corresponding 1 mm3 isotropic non-selective 3D FSE sequences (short and long TR) for comparison had common parameters of 3.5 ms echo spacing, 2x phase- and 2x slice-direction GRAPPA acceleration, and matrix size of 232x256x160. The 1 s TR sequence used a TE = 303 ms and a 256 ETL, while the longer TR sequence (TR = 2 s) used a TE = 589 ms and a 512 ETL. Flip angles were calculated using a control angle technique (8) with the EPG framework (14). While generally not utilized in vivo due to inferior SNR, the scan time was held at 40 s for both sequences to compare to the fully sampled 40 s TurboYarn sequence.
All experiments were performed on healthy volunteers (ages 43, 45 and 61) providing informed consent, using a Siemens Prisma 3 T with an 80 mT/m gradient set, and a 64-channel head and neck array.
Results
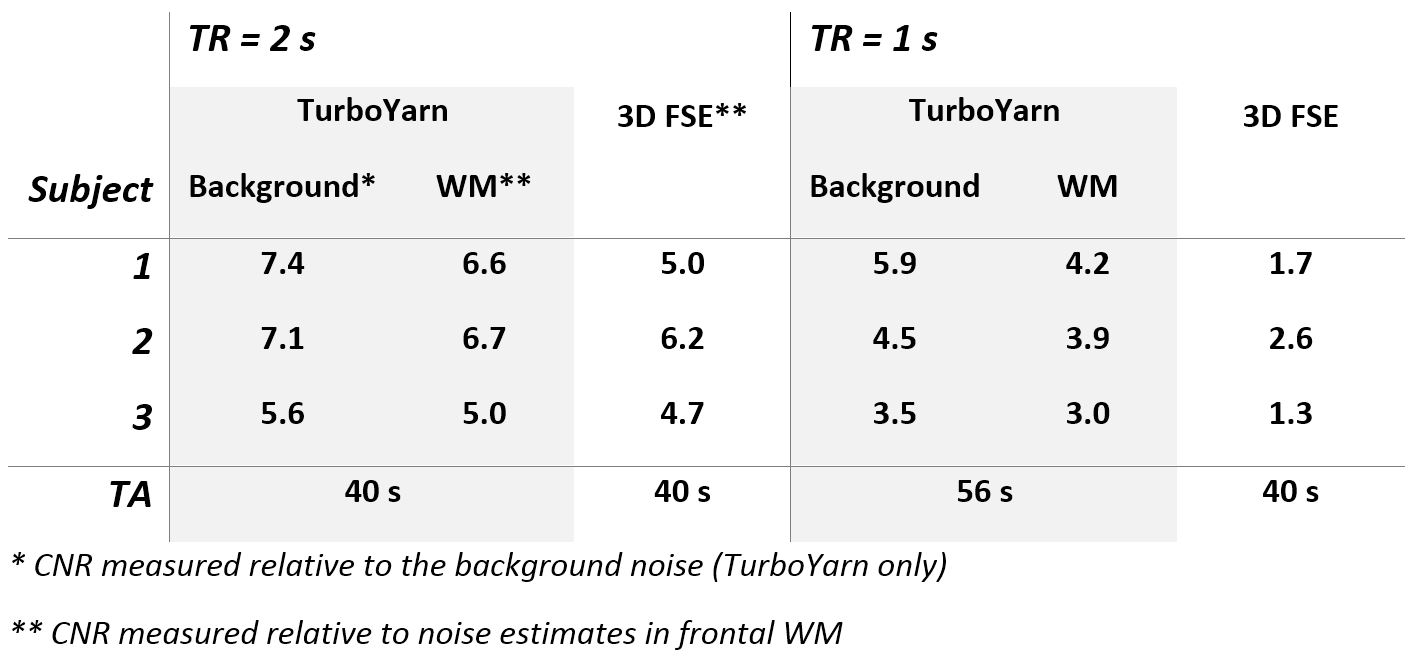
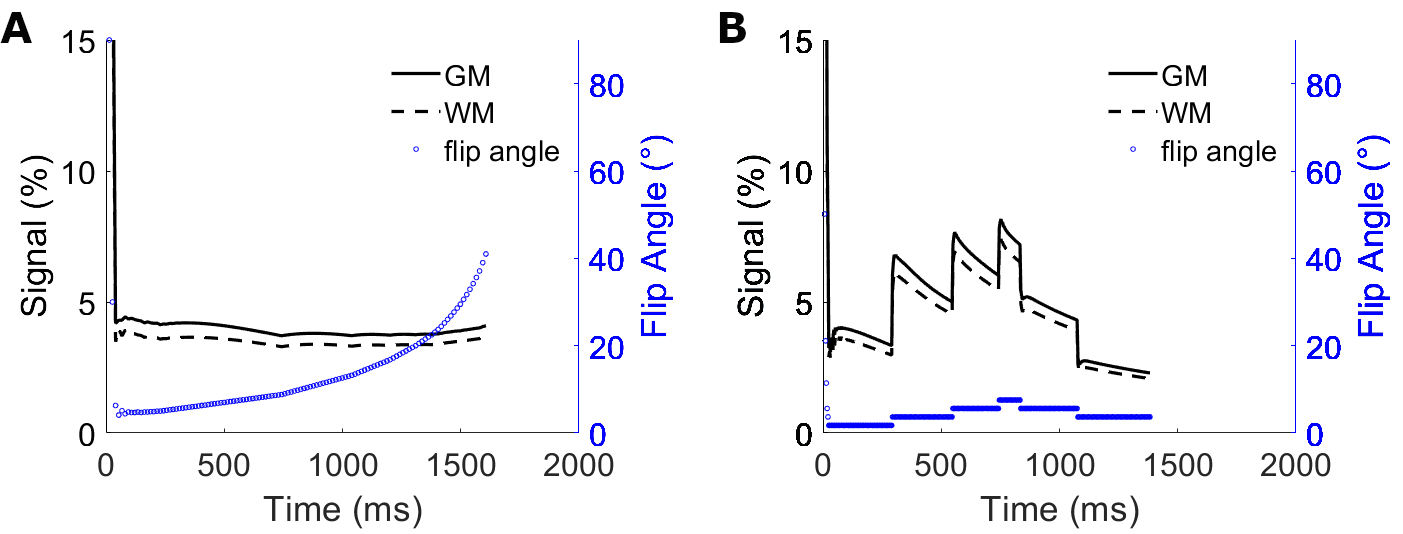
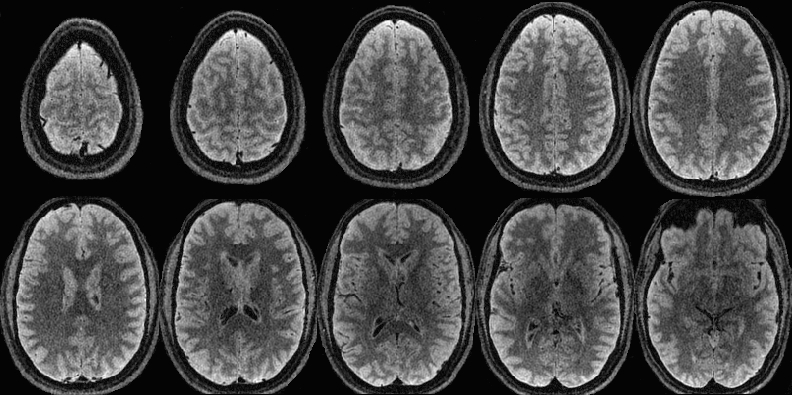
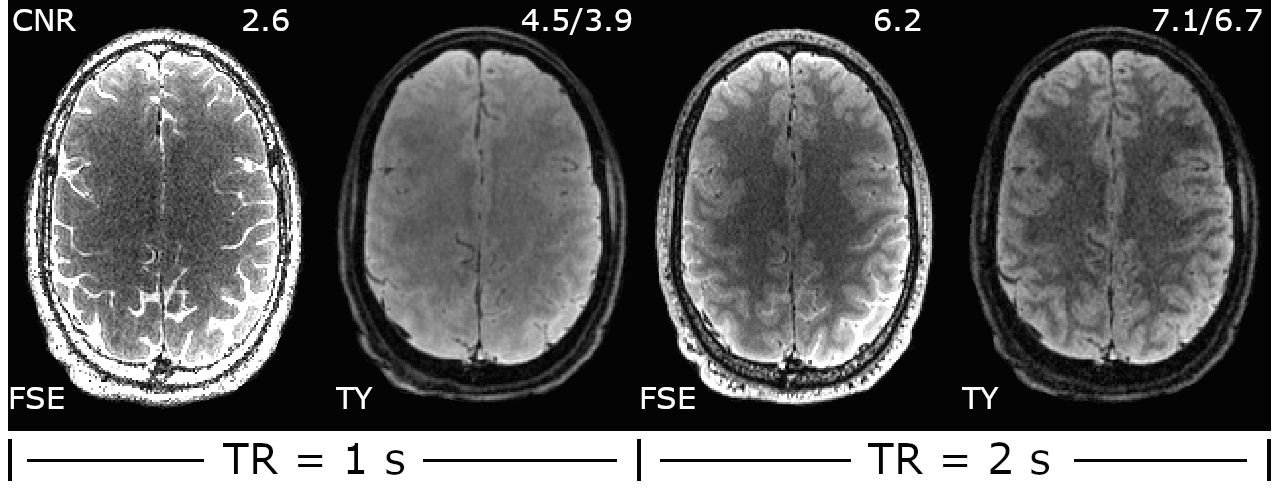
Simulated decay curves for under-sampled 3D FSE and TurboYarn along with flip angles for the 2 s TR sequences are illustrated in Figure 2. Designed constant signal is achieved with TurboYarn for both grey matter (GM) and WM, with average WM being 12% less than GM across the train. At the effective TE of 589 ms, 3D FSE WM and GM signal difference is similar at 11%. Images at different axial locations for the TR = 2 s TurboYarn sequence are shown in Figure 3 for subject #1. All images are presented raw without bias correction. Qualitative visual contrast between GM and WM is excellent, with demonstrative images from subject #2 shown in Figure 4. Background noise had an expected Rayleigh distribution (i.e. no constant offset) for TurboYarn, but not under-sampled 3D FSE. Thus, contrast-to-noise (CNR) was calculated from background noise only for TurboYarn, and alternatively from noise estimates in frontal WM regions for both sequences (Table 1). The largest CNR difference between comparative TurboYarn and FSE cases occurs for TR = 1 s. Fat and CSF are saturated for TurboYarn, but dominate images for FSE at TR = 1 s, though GM/WM contrast is visually low for both. All cases show increased CNR when longer trains are used (TR = 2 s), with TurboYarn showing superior CNR over 3D FSE in each comparison. At TR = 2 s, both FSE and TurboYarn display excellent GM/WM contrast, with slight improvements in the TurboYarn images.Discussion
This work investigated a 3D Yarnball readout to efficiently sample k-space and improve rapid imaging within a fast spin echo scheme at acquisition times of 40 s. TurboYarn yielded higher CNR values than comparable 3D FSE measurements and produced excellent GM/WM visual contrast for the TR = 2 s (119 ETL) variant. Future work will implement wind in-out Yarnball to coincide k-space centre sampling with the spin echo centre for increased signal and true T2 contrast, improve SNR via further trajectory and flip angle developments and explore motion effects compared to 3D FSE. As TurboYarn samples the center of k-space during each acquisition, coherent motion artifacts should decrease in TurboYarn images. The combination of robustness to motion and efficient k-space sampling with tailored contrast depending on flip angle evolution make TurboYarn a promising alternative in rapid imaging.Acknowledgements
The authors are grateful for funding support from the Natural Sciences and Engineering Council Canada (NSERC, #RGPIN-2017-04006) and the Canadian Institutes of Health Research (CIHR, #PS 180473).References
1. Hennig J, Nauerth A, Friedburg H. RARE imaging: A fast imaging method for clinical MR. Magn. Reson. Med. 1986;3:823–833 doi: 10.1002/mrm.1910030602.
2. Weigel M, Hennig J. Contrast behavior and relaxation effects of conventional and hyperecho-turbo spin echo sequences at 1.5 and 3 T. Magn. Reson. Med. 2006;55:826–835 doi: 10.1002/mrm.20816.
3. Mugler JP. Optimized three-dimensional fast-spin-echo MRI. J. Magn. Reson. Imaging 2014;39:745–767 doi: 10.1002/jmri.24542.
4. Busse RF, Hariharan H, Vu A, Brittain JH. Fast spin echo sequences with very long echo trains: Design of variable refocusing flip angle schedules and generation of clinicalT2 contrast. Magn. Reson. Med. 2006;55:1030–1037 doi: 10.1002/mrm.20863.
5. Keerthivasan MB, Saranathan M, Johnson K, et al. An efficient 3D stack-of-stars turbo spin echo pulse sequence for simultaneous T2-weighted imaging and T2 mapping. Magn. Reson. Med. 2019;82:326–341 doi: 10.1002/mrm.27737.
6. Winkelmann S, Schaeffter T, Koehler T, Eggers H, Doessel O. An optimal radial profile order based on the golden ratio for time-resolved MRI. IEEE Trans. Med. Imaging 2007;26:68–76 doi: 10.1109/TMI.2006.885337.
7. Theilmann RJ, Gmitro AF, Altbach MI, Trouard TP. View-ordering in radial fast spin-echo imaging. Magn. Reson. Med. 2004;51:768–774 doi: 10.1002/MRM.20031.
8. Busse RF, Brau ACS, Vu A, et al. Effects of refocusing flip angle modulation and view ordering in 3D fast spin echo. Magn. Reson. Med. 2008;60:640–649 doi: 10.1002/MRM.21680.
9. Stobbe RW, Beaulieu C. Three-dimensional Yarnball k-space acquisition for accelerated MRI. Magn. Reson. Med. 2021;85:1840–1854 doi: 10.1002/MRM.28536.
10. Bojorquez JZ, Bricq S, Acquitter C, Brunotte F, Walker PM, Lalande A. What are normal relaxation times of tissues at 3 T? Magn. Reson. Imaging 2017;35:69–80 doi: 10.1016/J.MRI.2016.08.021.
11. McPhee KC, Wilman AH. T2 quantification from only proton density and T2-weighted MRI by modelling actual refocusing angles. Neuroimage 2015;118:642–650 doi: 10.1016/j.neuroimage.2015.05.079.
12. Snyder J, McPhee KC, Wilman AH. T 2 quantification in brain using 3D fast spin-echo imaging with long echo trains. Magn. Reson. Med. 2022;87:2145–2160 doi: 10.1002/MRM.29113.
13. Kaldoudi E, Williams SCR, Barker GJ, Tofts PS. A chemical shift selective inversion recovery sequence for fat-suppressed MRI: Theory and experimental validation. Magn. Reson. Imaging 1993;11:341–355 doi: 10.1016/0730-725X(93)90067-N.
14. Weigel M. Extended phase graphs: Dephasing, RF pulses, and echoes - Pure and simple. J. Magn. Reson. Imaging 2015;41:266–295 doi: 10.1002/jmri.24619.
Figures