3296
Feasibility of whole-brain functional MRI with 1-mm isotropic resolution at 3T1Biomedical Engineering, UNC at Chapel Hill, Chapel Hill, NC, United States, 2Biomedical Research Imaging Center, UNC at Chapel Hill, Chapel Hill, NC, United States, 3Radiology, UNC at Chapel Hill, Chapel Hill, NC, United States, 4Psychiatry, Harvard Medical School, Boston, MA, United States, 5Psychology & Neuroscience, UNC at Chapel Hill, Chapel Hill, NC, United States
Synopsis
Keywords: Data Acquisition, Neuro
fMRI with ultrahigh resolution has typically been acquired at 7T in order to overcome the inherently low SNR at 3T. However, 7T scanners are inaccessible to the majority of investigators. In this study, we developed new acquisition and reconstruction approaches and employed the denoising method NORDIC to improve the resolution of 3T fMRI to 1 mm isotropic with whole-brain coverage and volumetric scan time of 2 seconds. Our results showed improved tSNR and low spatial blurring. The detection capability of resting-state networks was comparable to that of 7T. BOLD activations in cortical and subcortical regions were observed in task-based fMRI.Introduction
Whereas the 2-mm resolution in HCP protocol demonstrated the successes in precise functional mapping1, fMRI with ultrahigh resolution (≤ 1 mm) for investigation of fine-scale structures is of great interest and still under pursuit. To date, most of the ultrahigh-resolution fMRI acquisitions were acquired at 7T for higher signal-to-noise ratio (SNR). However, 7T scanners are inaccessible to the majority of investigators. In this study, we 1) improved the spatial resolution of 3T fMRI to 1 mm isotropic with whole-brain coverage and volumetric scan time of 2 seconds, and 2) examined the feasibility comprehensively. Specifically, we developed new approaches for acquisitions and reconstructions to improve the acceleration capability and employed the NORDIC denoising method2 to improve SNR. The detection sensitivity of resting-state networks at 3T was compared with the sensitivity at 7T. Finally, we evaluated BOLD activations in cortical and subcortical regions during episodic memory tasks.Method
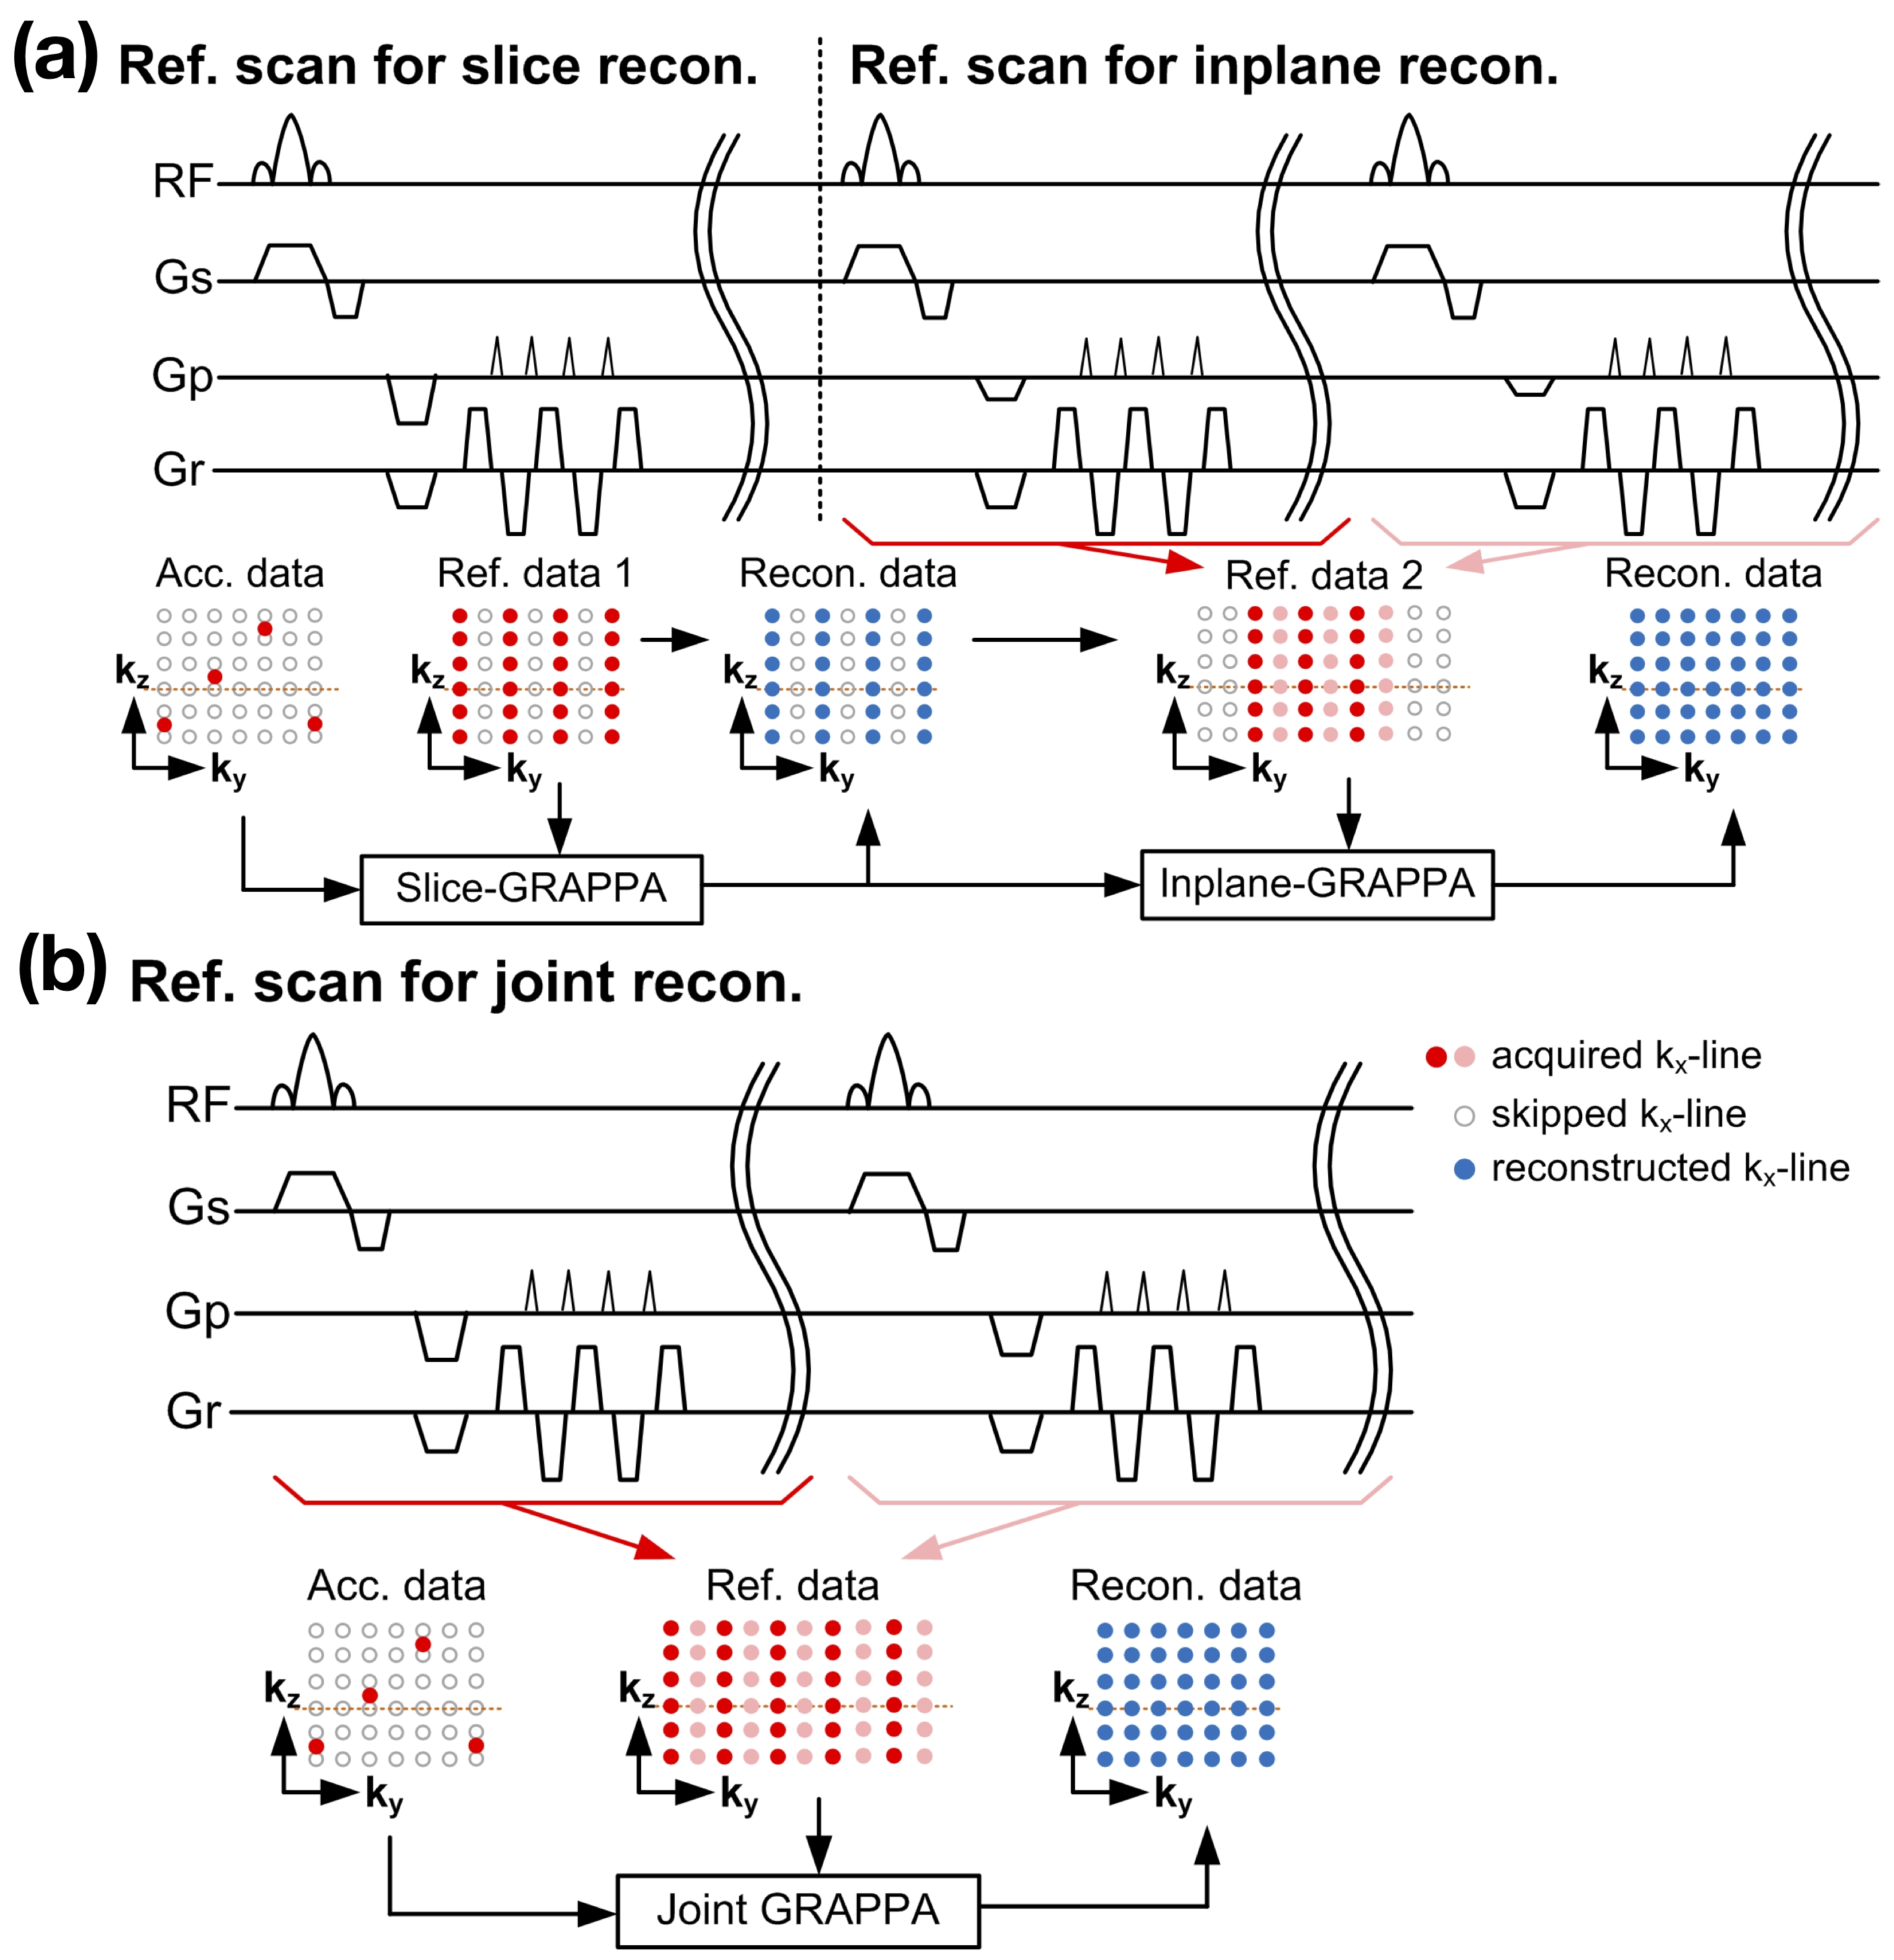
In conventional SMS acquisitions with both inplane and slice accelerations, the accelerated image was reconstructed in two sequential steps as shown in Figure 1a. The reconstruction error in the first reconstruction step may propagate to, and be enhanced by, the next step. In this study, we combined the two reference scans for slice and inplane reconstructions into one. This allowed the accelerated images to be reconstructed in one step as shown in Figure 1b, thereby lowering the g-factor penalty and increasing the image fidelity. The kx lines skipped by partial-Fourier acquisition was reconstructed using the projection-onto-convex-set (POCS) method. The spatial blurring was measured by the full-width-half-magnitude (FWHM) of the noise kernel3.Thirty-four healthy adults with ages ranging from 18 to 80 years were recruited for 3T experiments. Four datasets were excluded due to serious head movement. MR images were acquired using a 3T Prisma scanner (Siemens Healthcare, Erlangen, Germany) with the following parameters: SMS factor = 6, in-plane acceleration rate = 2, TR = 2 seconds, FOV = 176×176×126 (R-L×H-F×A-P) mm3, number of axial slices = 126, TE = 32 ms. One 10-minute resting-state scan and six 5.4-minute task-based scans were acquired. The in-scanner task was a continuous recognition version of the Mnemonic Similarity Task4. To compare with the publicly-available multiband fMRI sequence distributed by Center for Magnetic Resonance Research (CMRR), we also collected the fMRI with similar parameters above except: FOV = 192×192×126 (R-L×H-F×A-P) mm3.Results
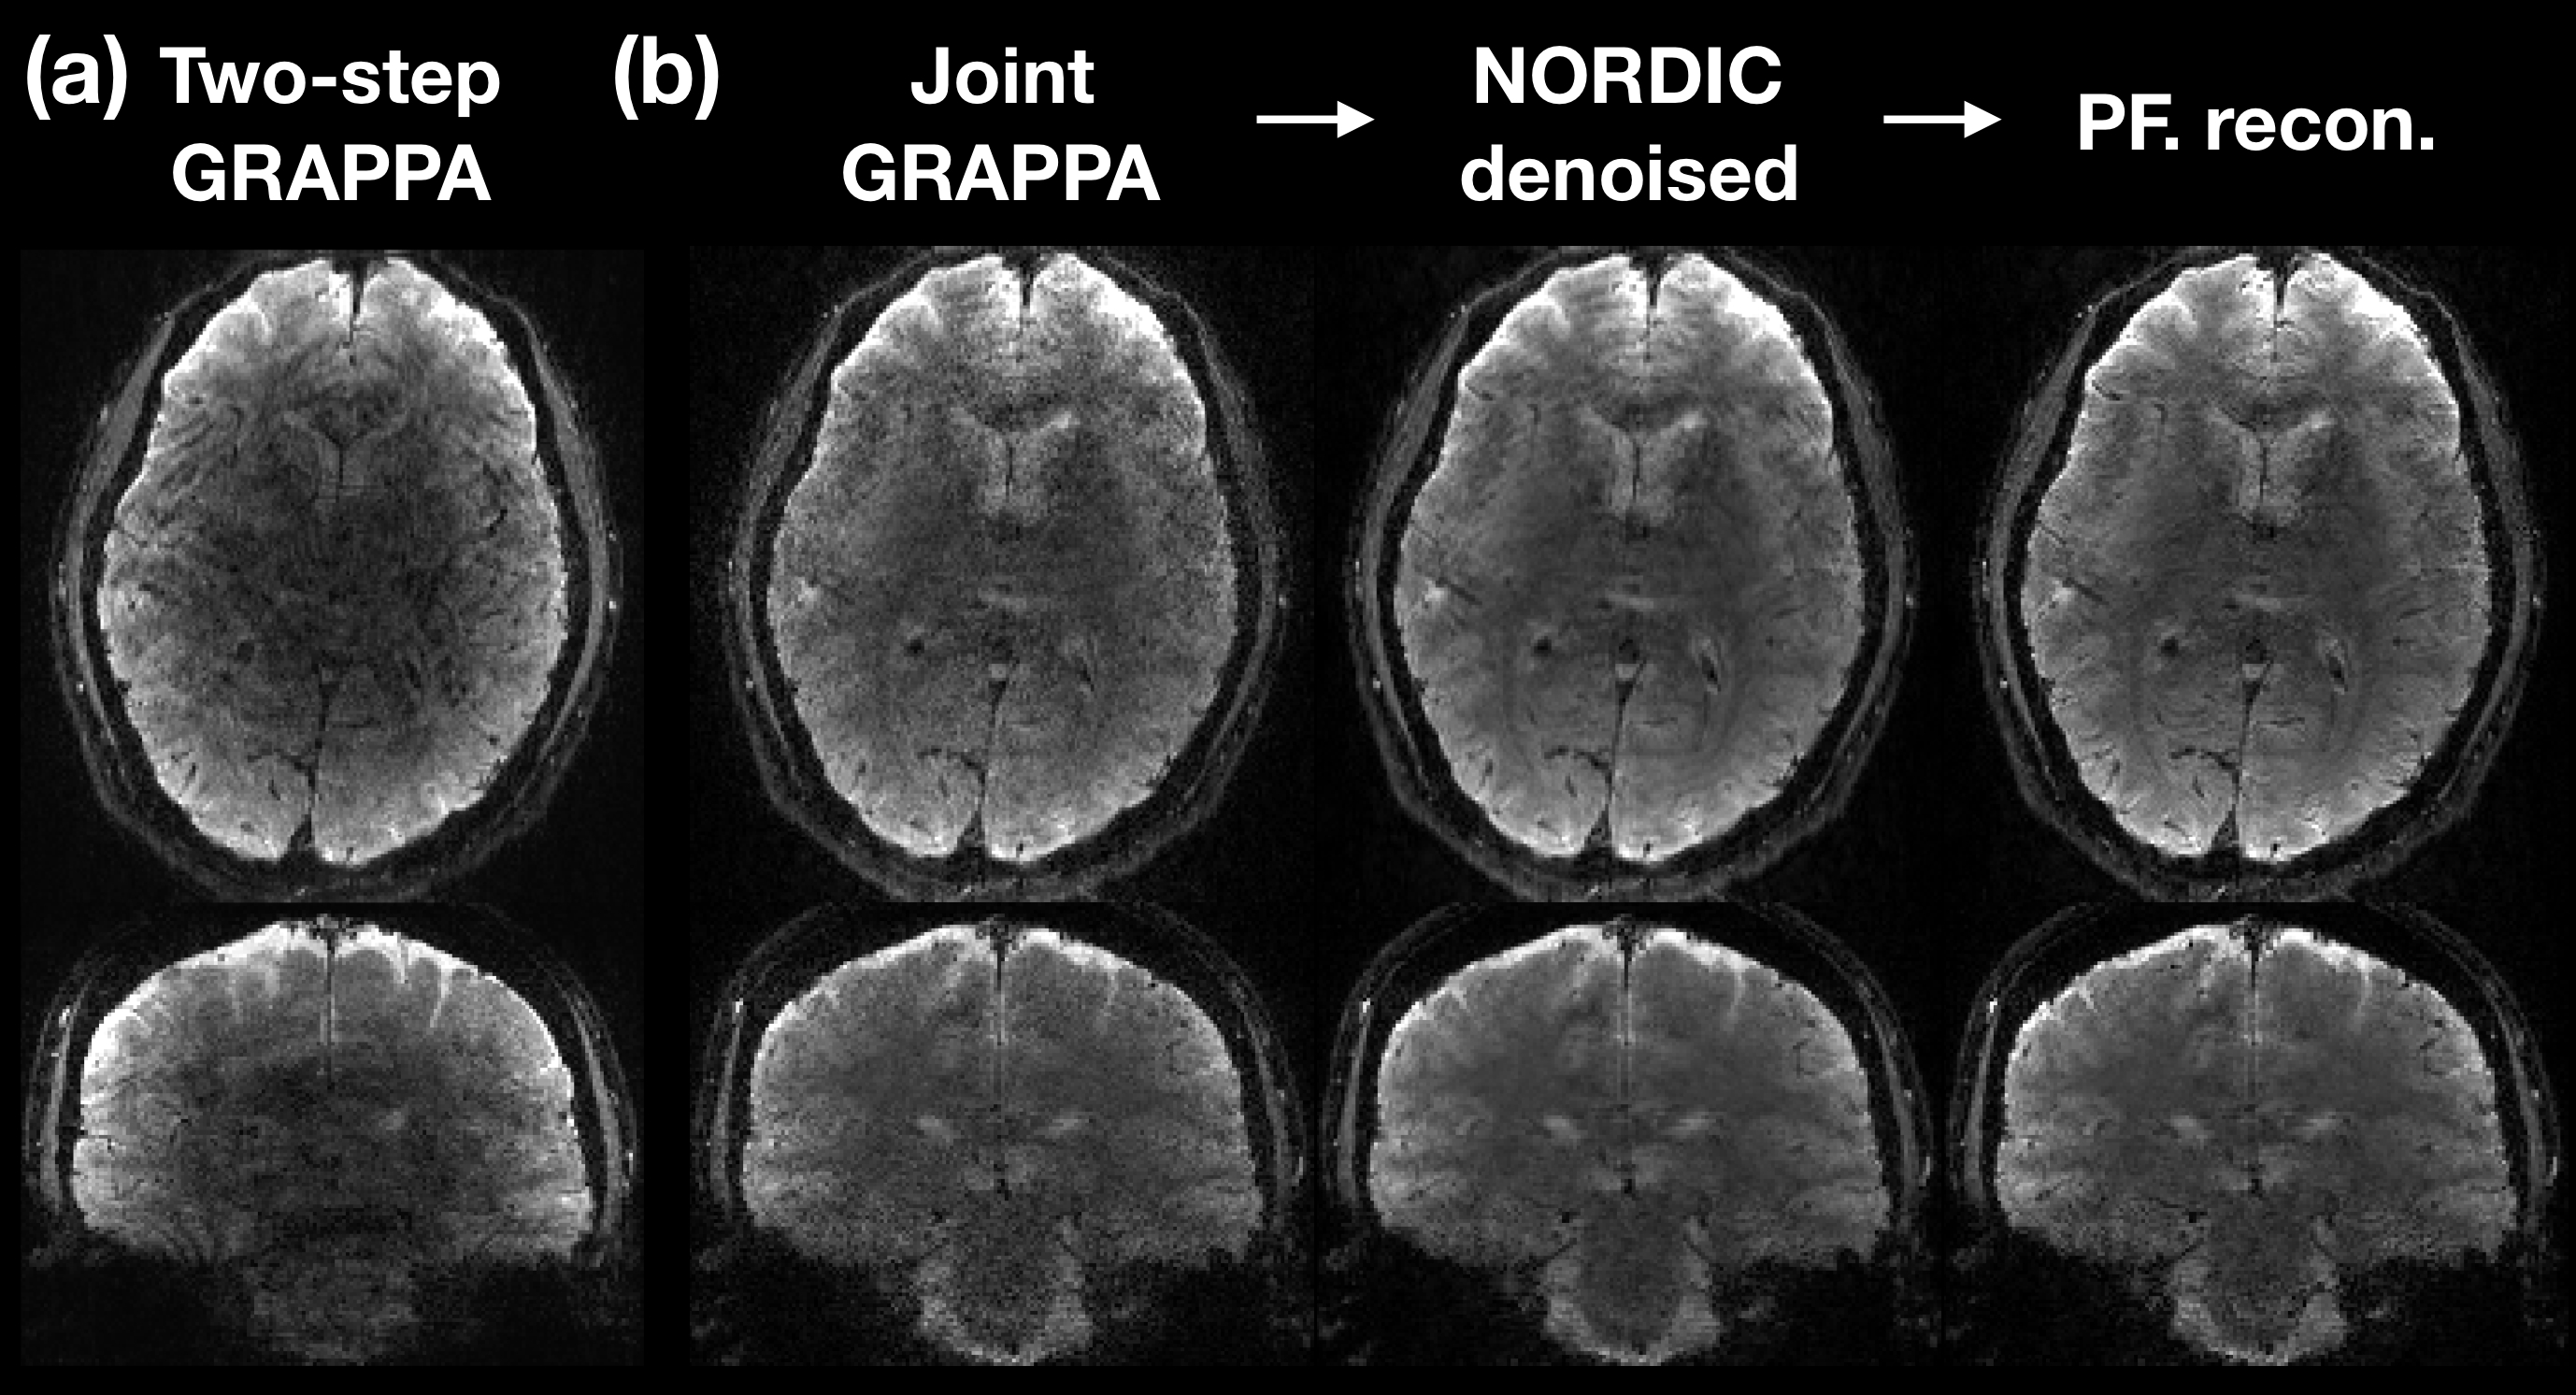
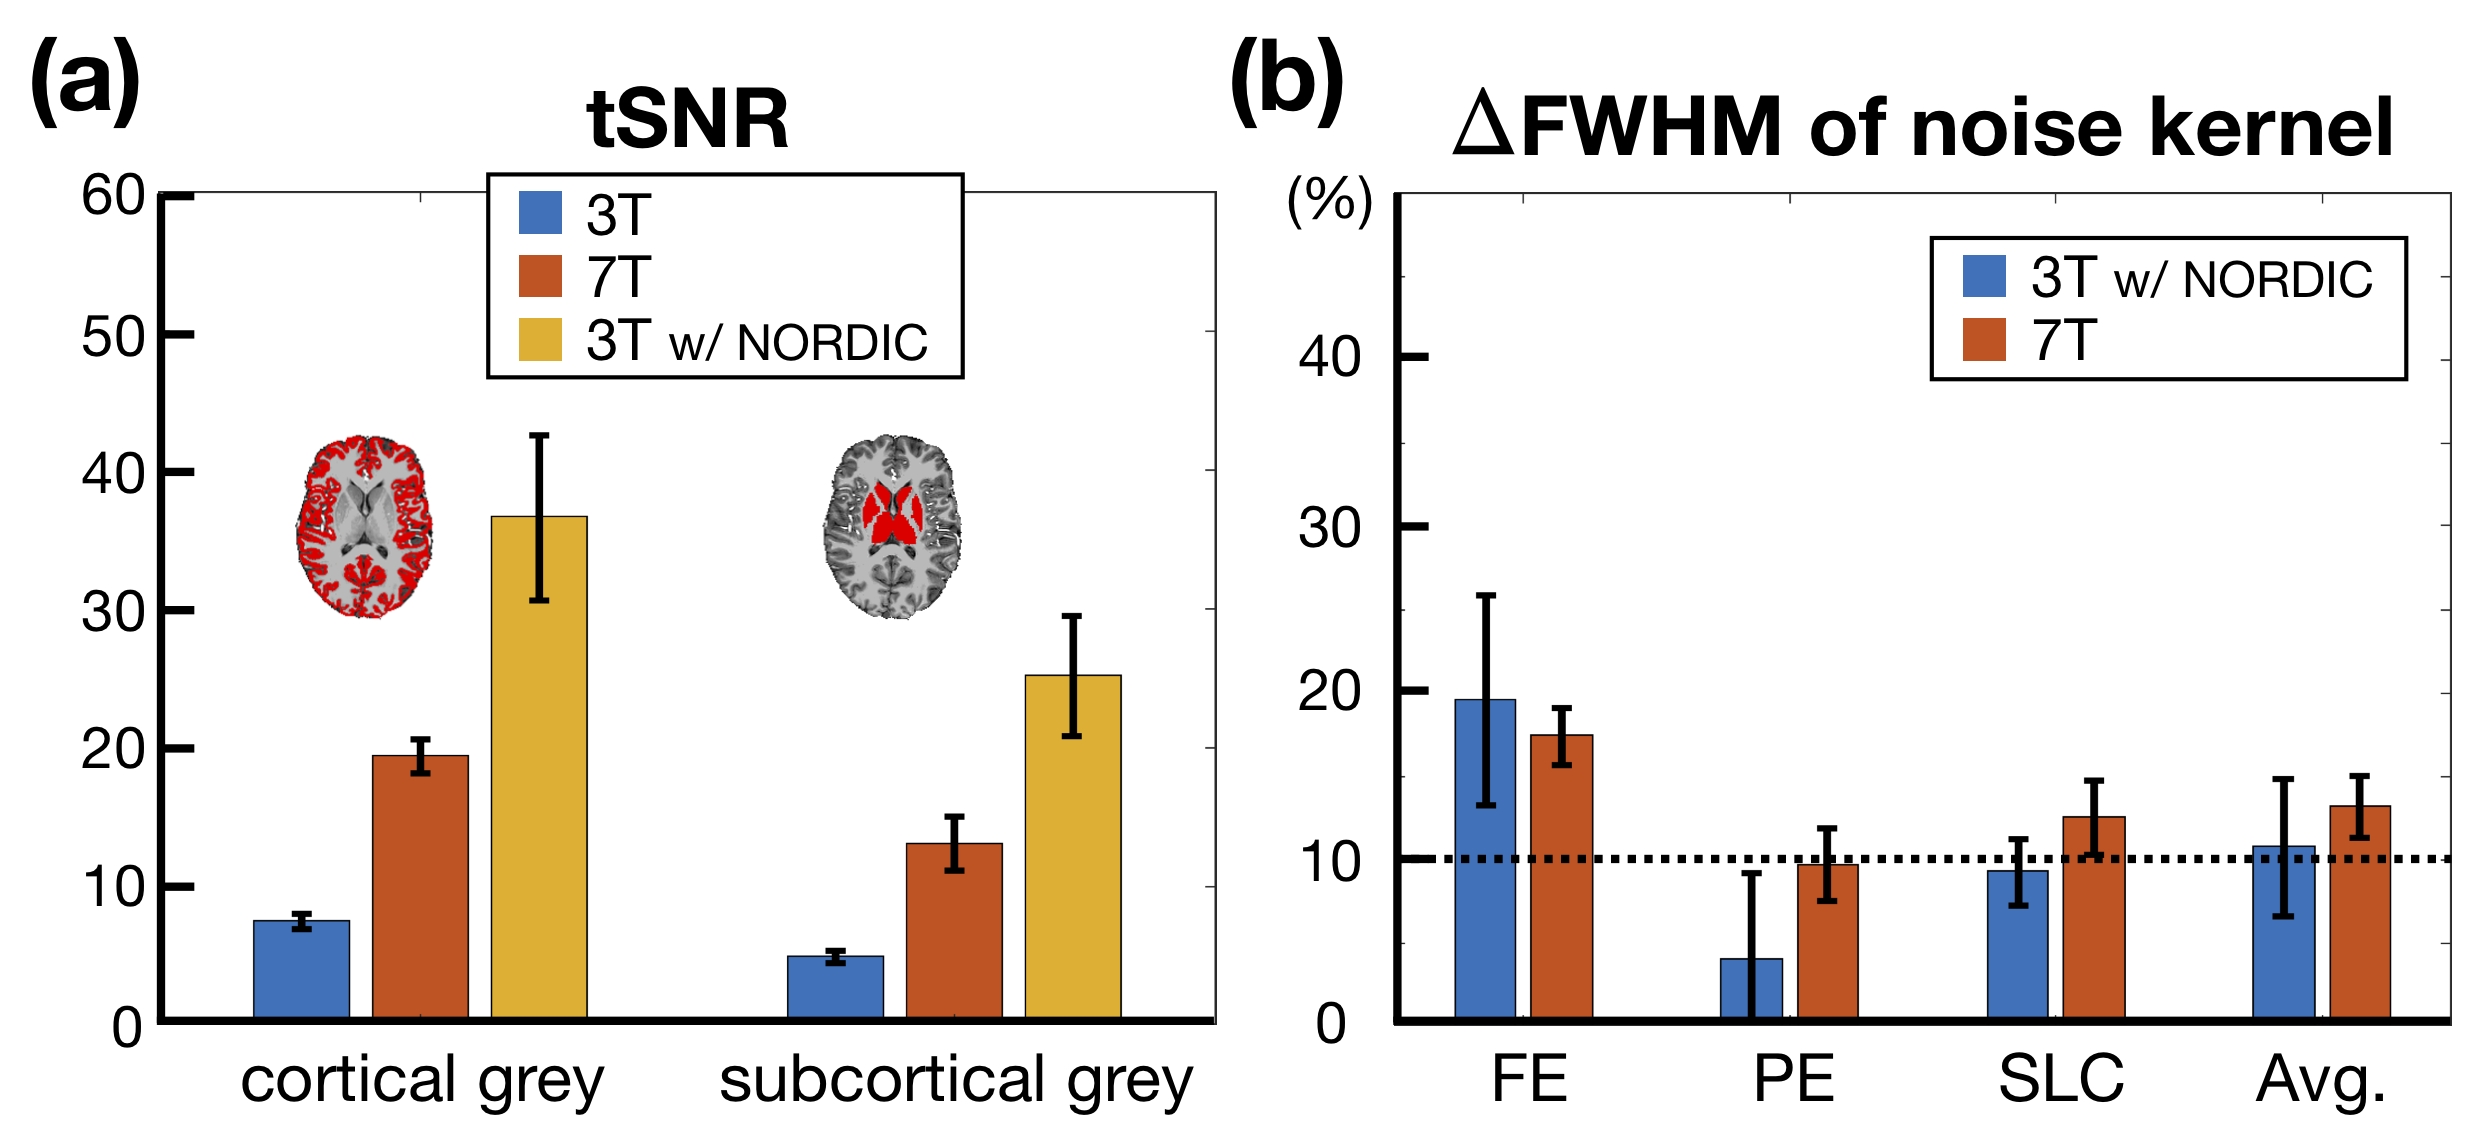
Figure 4a and the left panel of Figure 4b showed that the joint GRAPPA demonstrated fewer artifacts and higher signal intensity around the subcortical regions than the two-step GRAPPA reconstruction. After NORDIC denoising and POCS reconstruction, the image became less grainy and had reduced ringing artifacts as shown in the middle and right panels of Figure 4b.For the group-level quantitative analysis, we examined tSNR and spatial blurring as shown in Figure 3. After NORDIC denoising, the tSNR of 3T was enhanced from 7.5 to 36.6 and significantly higher than that of 7T (p < 0.001). The results in subcortical grey matter were likewise. Meanwhile, the averaged point spread functions across dimensions remained as ~10% and showed no significant difference compared to 7T (p = 0.17). Our results indicated that the enhancement of tSNR by NORDIC did not compromise the spatial resolution.
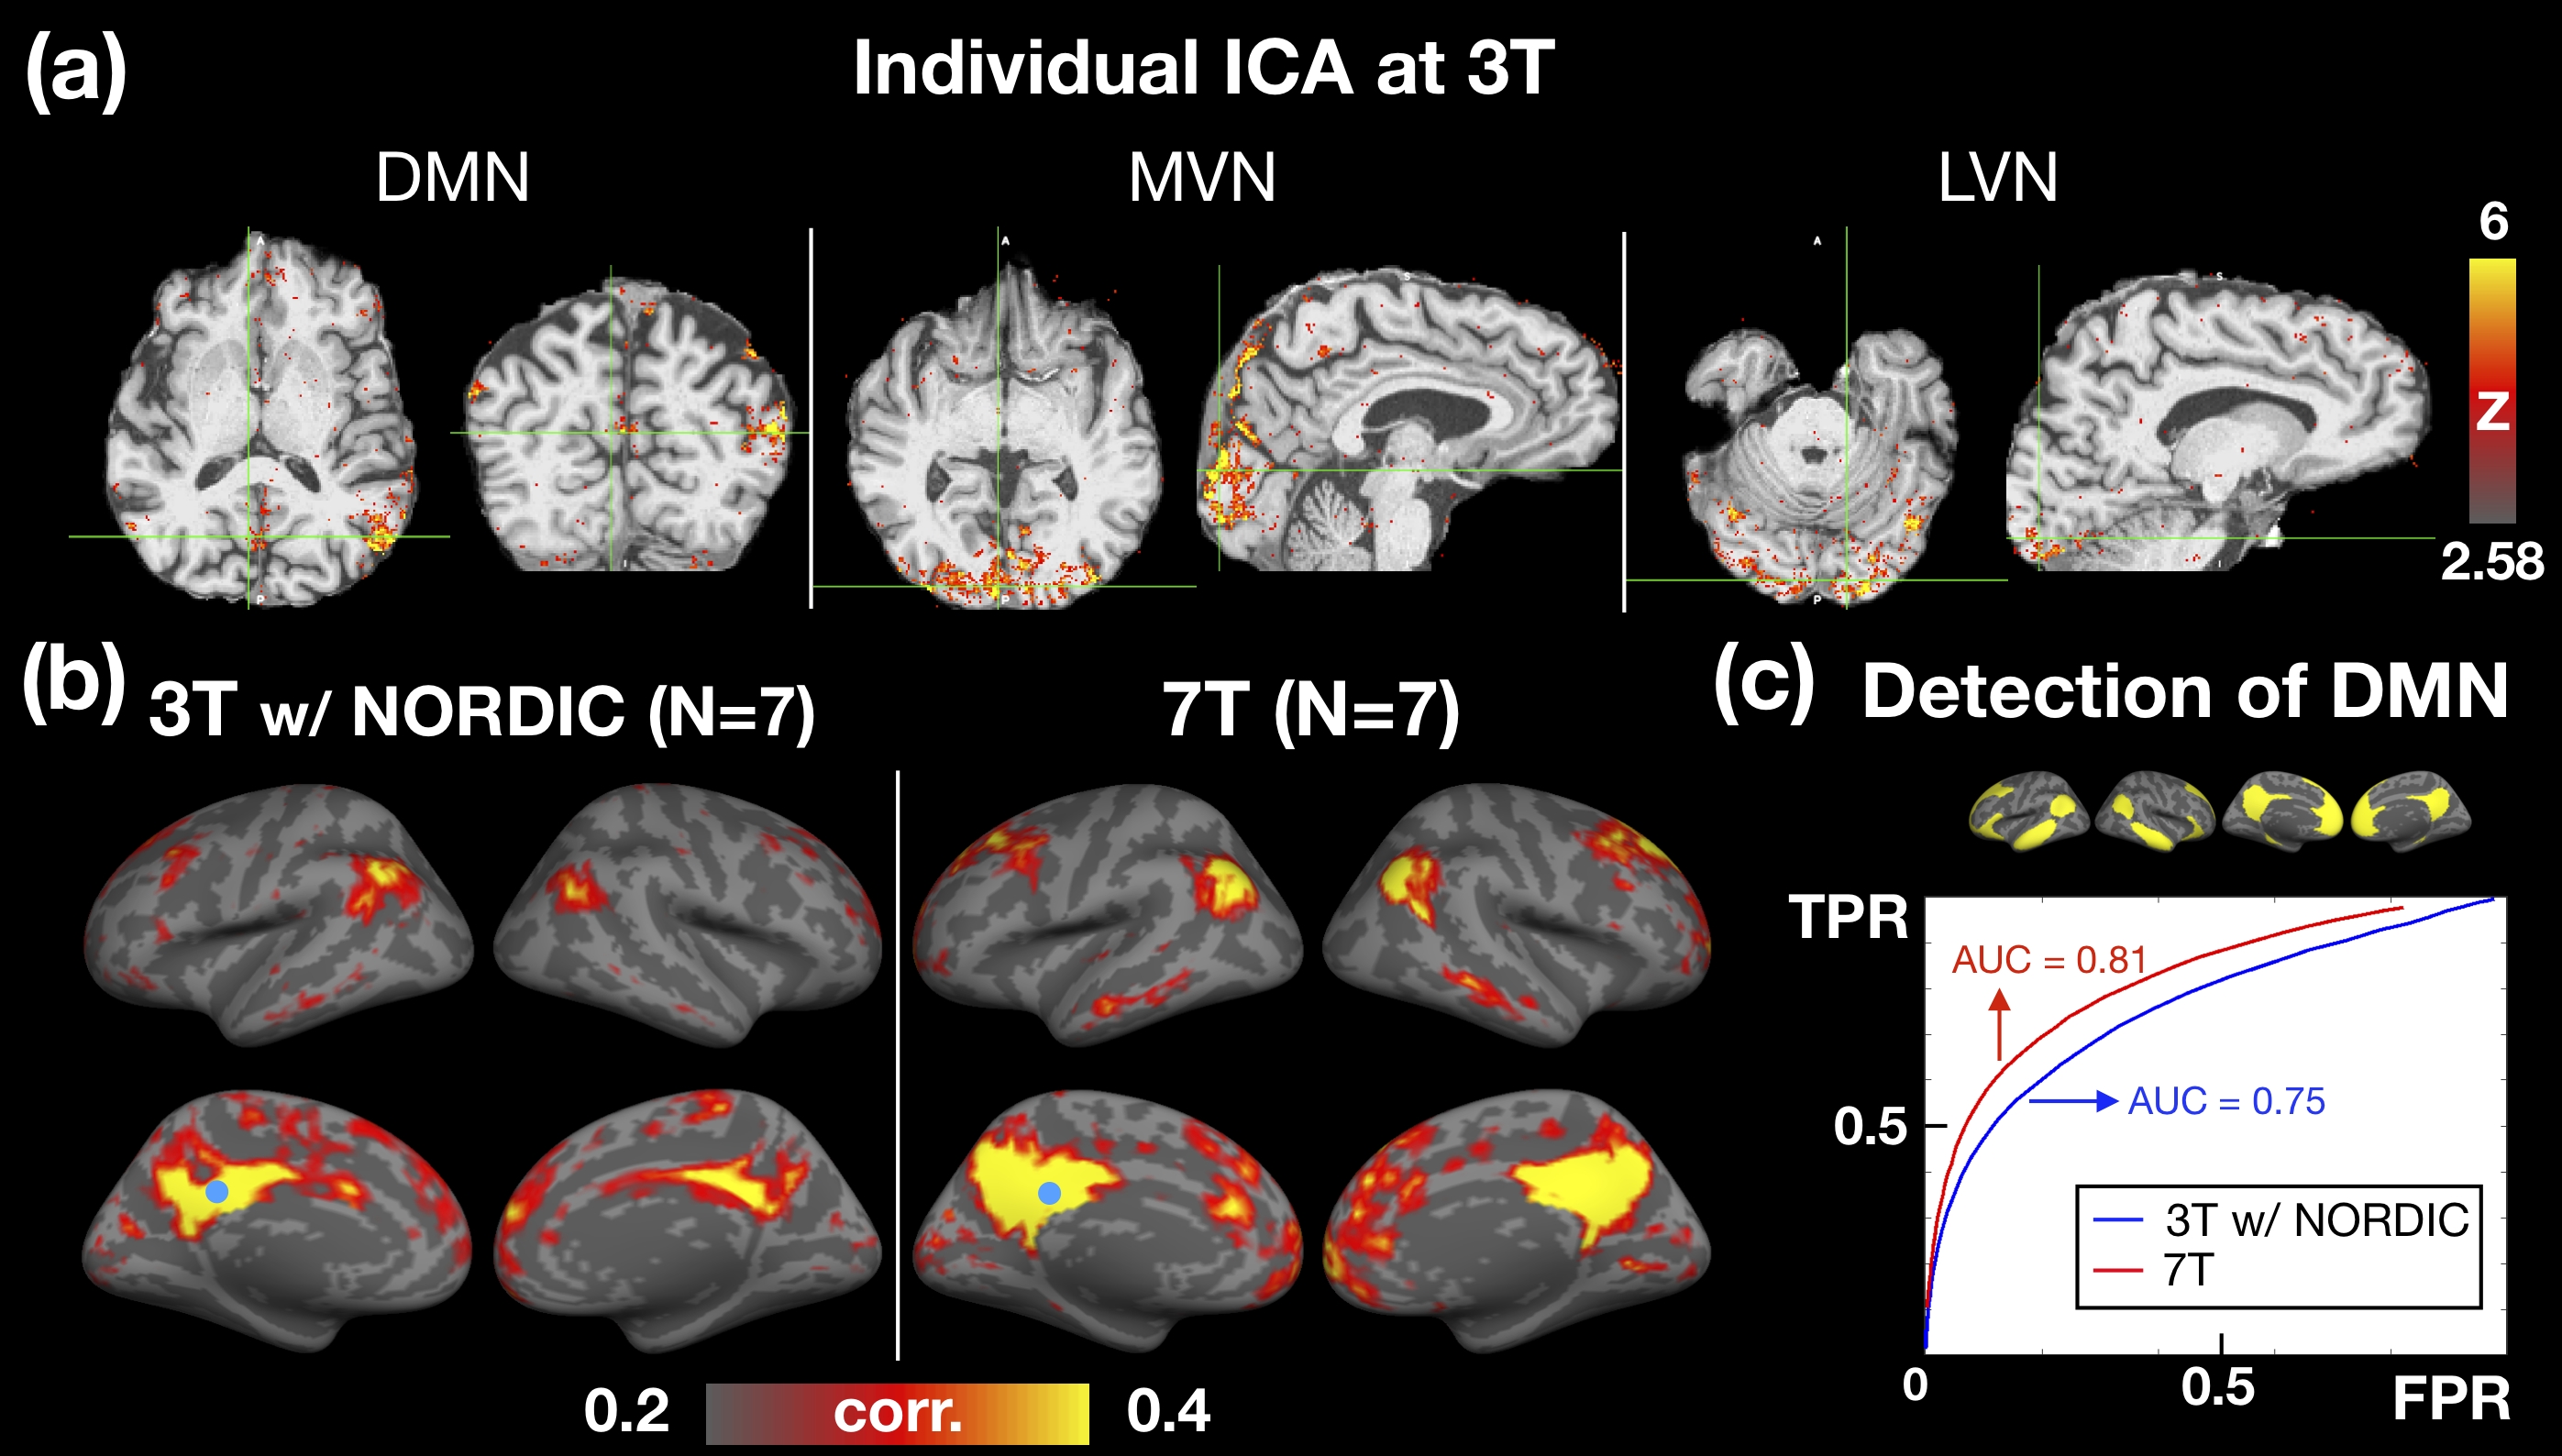
Next, we examined the detection capability of resting state networks at 3T. For a single individual, Figure 4a demonstrated the detection capability of resting-state networks by ICA. For group level (N=7), the seed-based FC analysis was performed on both 3T and 7T datasets for comparison as shown in Figure 4b. The detection capability of DMN was further characterized using receiver operating characteristic (ROC) and quantified by the area under ROC curve (AUC), as shown in Figure 4c. The AUC of 3T with NORDIC showed only 7.4% reduction from that of 7T. Our results suggested the 1-mm resolution fMRI at 3T was able to detect RSNs even with a small number of participants.
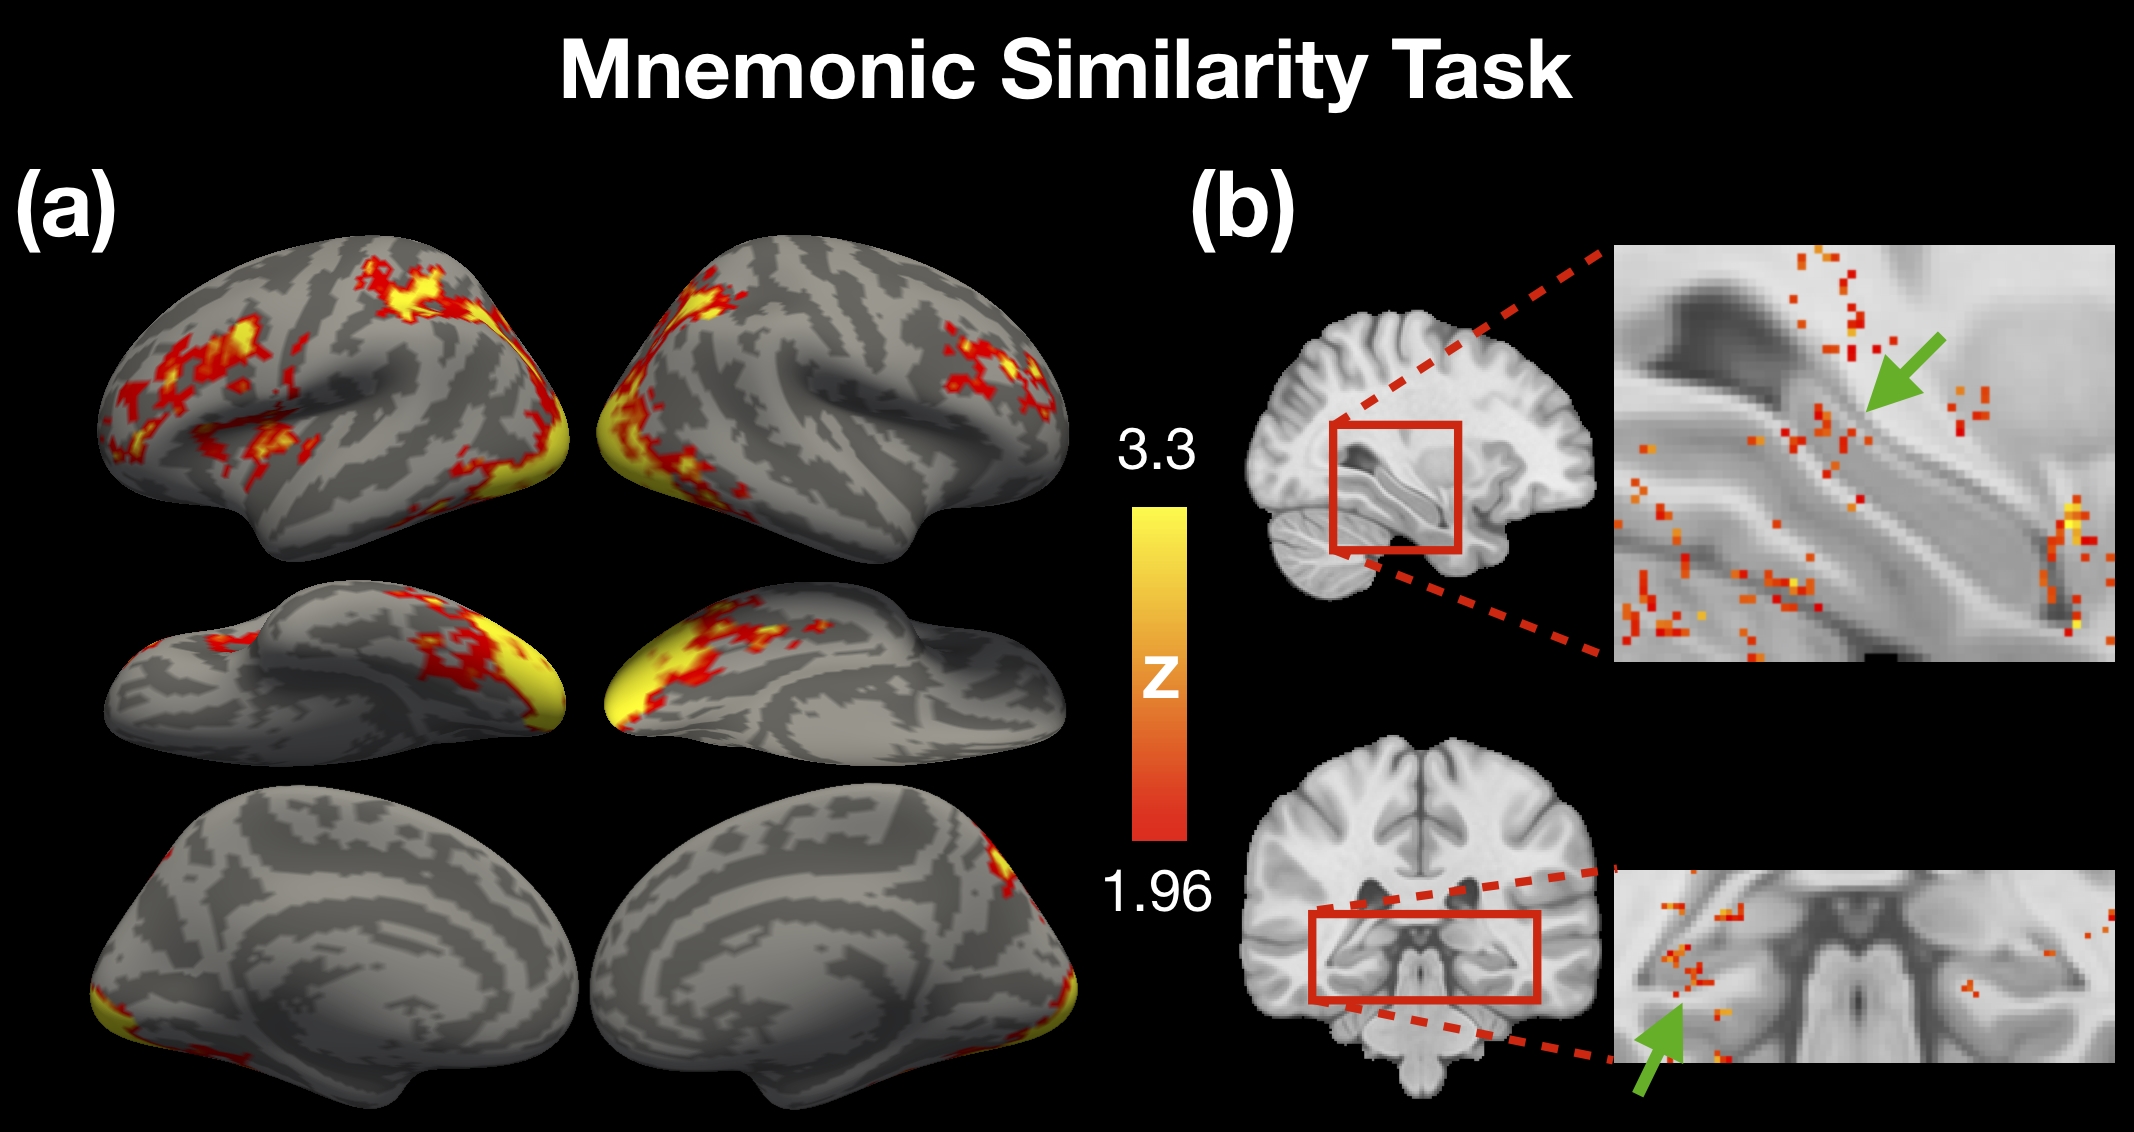
For task-based fMRI, we employed an object recognition memory task to elicit cortical and subcortical activations. The results in Figure 5a demonstrate the typical BOLD activations as reported in prior episodic memory studies5–7. Figure 5b demonstrates the subcortical activations which was previously reported to be associated with memory retrieval8,9. Our results of evoked BOLD responses suggested that the 1-mm fMRI at 3T was able to detect the BOLD activations in both cortical and subcortical regions.
Discussion
This study improved the spatial resolution of fMRI at 3T to 1 mm isotropic with whole-brain coverage and TR of 2s. Compared with the publicly-available multiband sequence, the quality of image reconstruction was substantially improved by the newly-designed acquisition and reconstruction methods. Our results demonstrated significantly improved tSNR with low spatial blurring. The resting-state fMRI at 3T demonstrated typical RSNs in both individual and group levels. The detection capability of RSNs at 3T, measured by AUC, was reduced by only 7.4% compared to that of 7T without NORDIC. In the task-based fMRI, our 3T data demonstrated the BOLD sensitivity in both cortical and subcortical regions with reasonable sample size. With the demonstrated sensitivity and low spatial blurring, our imaging methods on 3T holds great promises in providing better imaging features for the connectomic studies involving fine-scale subcortical structures.Acknowledgements
This work was supported in part by NIH grant R21AG060324.
References
1. Van Essen, D. C. et al. The WU-Minn Human Connectome Project: An overview. NeuroImage 80, 62–79 (2013).
2. Vizioli, L. et al. Lowering the thermal noise barrier in functional brain mapping with magnetic resonance imaging. Nat. Commun. 12, 5181 (2021).
3. Huber, L. R. et al. LayNii: A software suite for layer-fMRI. Neuroimage 237, 118091 (2021).
4. Stark, S. M., Kirwan, C. B. & Stark, C. E. L. Mnemonic Similarity Task: A Tool for Assessing Hippocampal Integrity. Trends Cogn. Sci. 23, 938–951 (2019).
5. Grady, C. L., McIntosh, A. R. & Craik, F. I. M. Age-related differences in the functional connectivity of the hippocampus during memory encoding. Hippocampus 13, 572–586 (2003).
6. Uncapher, M. R. & Wagner, A. D. Posterior parietal cortex and episodic encoding: Insights from fMRI subsequent memory effects and dual-attention theory. Neurobiol. Learn. Mem. 91, 139–154 (2009).
7. Wing, E. A., Ritchey, M. & Cabeza, R. Reinstatement of Individual Past Events Revealed by the Similarity of Distributed Activation Patterns during Encoding and Retrieval. J. Cogn. Neurosci. 27, 679–691 (2015).
8. Giovanello, K. S. & Dew, I. T. Z. Relational Memory and its Relevance to Aging. in The Wiley Handbook on the Cognitive Neuroscience of Memory (eds. Addis, D. R., Barense, M. & Duarte, A.) 371–392 (John Wiley & Sons, Ltd, 2015). doi:10.1002/9781118332634.ch18.
9. Kim, H. Neural activity that predicts subsequent memory and forgetting: A meta-analysis of 74 fMRI studies. NeuroImage 54, 2446–2461 (2011).
Figures