3294
Feasibility and Improved Specificity of Brain Lipid Imaging at 7 Tesla using Transient Nuclear Overhauser Effect (tNOE)1Radiology, University of Pennsylvania, Philadelphia, PA, United States
Synopsis
Keywords: Data Acquisition, Brain, Lipid imaging
Brain lipid imaging using steady-state nuclear Overhauser effect (ssNOE), though a traditionally popular approach, suffers from multiple confounding non-NOE specific sources, including direct saturation, magnetization transfer (MT), and relevant chemical exchange species. B0, B1+- dependent data are also needed to correct for the effect of (B0, B1+)- inhomogeneities¸ leading to other issues such as patient tolerability due to substantially increased scan time. Here, we demonstrate the feasibility of brain lipid mapping using an easily implementable transient NOE (tNOE) approach for the first time. Advantages include improved specificity, faster scan time and robust quantification with minimal confounding contributions.Introduction
The Nuclear Overhauser Effect (NOE) is the transfer of nuclear spin polarization from one spin-active nuclei (e.g., 1H, 13C, 15NS) population to another dipolar coupled spin-active nuclei via cross-relaxation or via relayed exchange. In recent years, the saturation based steady state nuclear Overhauser effect (ssNOE) has become a popular choice for brain lipid imaging [1][2][3][4][5][6][7]. However, ssNOE is known to suffer from multiple confounding non-NOE specific sources, including direct saturation, magnetization transfer (MT), relevant chemical exchange (CE) species. B0, B1+- dependent data are also needed to correct for the effect of (B0, B1+)- inhomogeneities¸ leading to other issues such as patient tolerability due to substantially increased scan time. Here, we demonstrate the feasibility of brain lipid mapping using an easily implementable transient NOE (tNOE) approach for the first time. Advantages include improved specificity, faster scan time, and robust quantification with minimal confounding contributions from bulk water and MT.Methods
All Imaging experiments were performed on a 7T MRI scanner (Terra, Siemens Medical Systems, Erlangen, Germany) using a Siemens’ single channel transmit/32-channel receive proton head phased-array volume coil. All pulse sequences consisted of a magnetization preparation module followed by a single-shot TurboFLASH (tfl) readout with centric phase-encoding order (Fig. 1): tfl-TR 3.5ms, tfl-TE 1.47ms, BW 550 Hz/pixel.tNOE Imaging: The magnetization preparation module included a Frequency selective inversion recovery (FSIR) pulse (two options: Sinc pulse with band-width-time-product (BWTP) 1.2; Hyperbolic Secant adiabatic pulse with BWTP 12.8).
ssNOE imaging: The magnetization preparation module included a 30x100ms long Hanning-windowed saturation pulse train (100ms pulse duration, 99% duty cycle, B1rms of 0.725 μT).
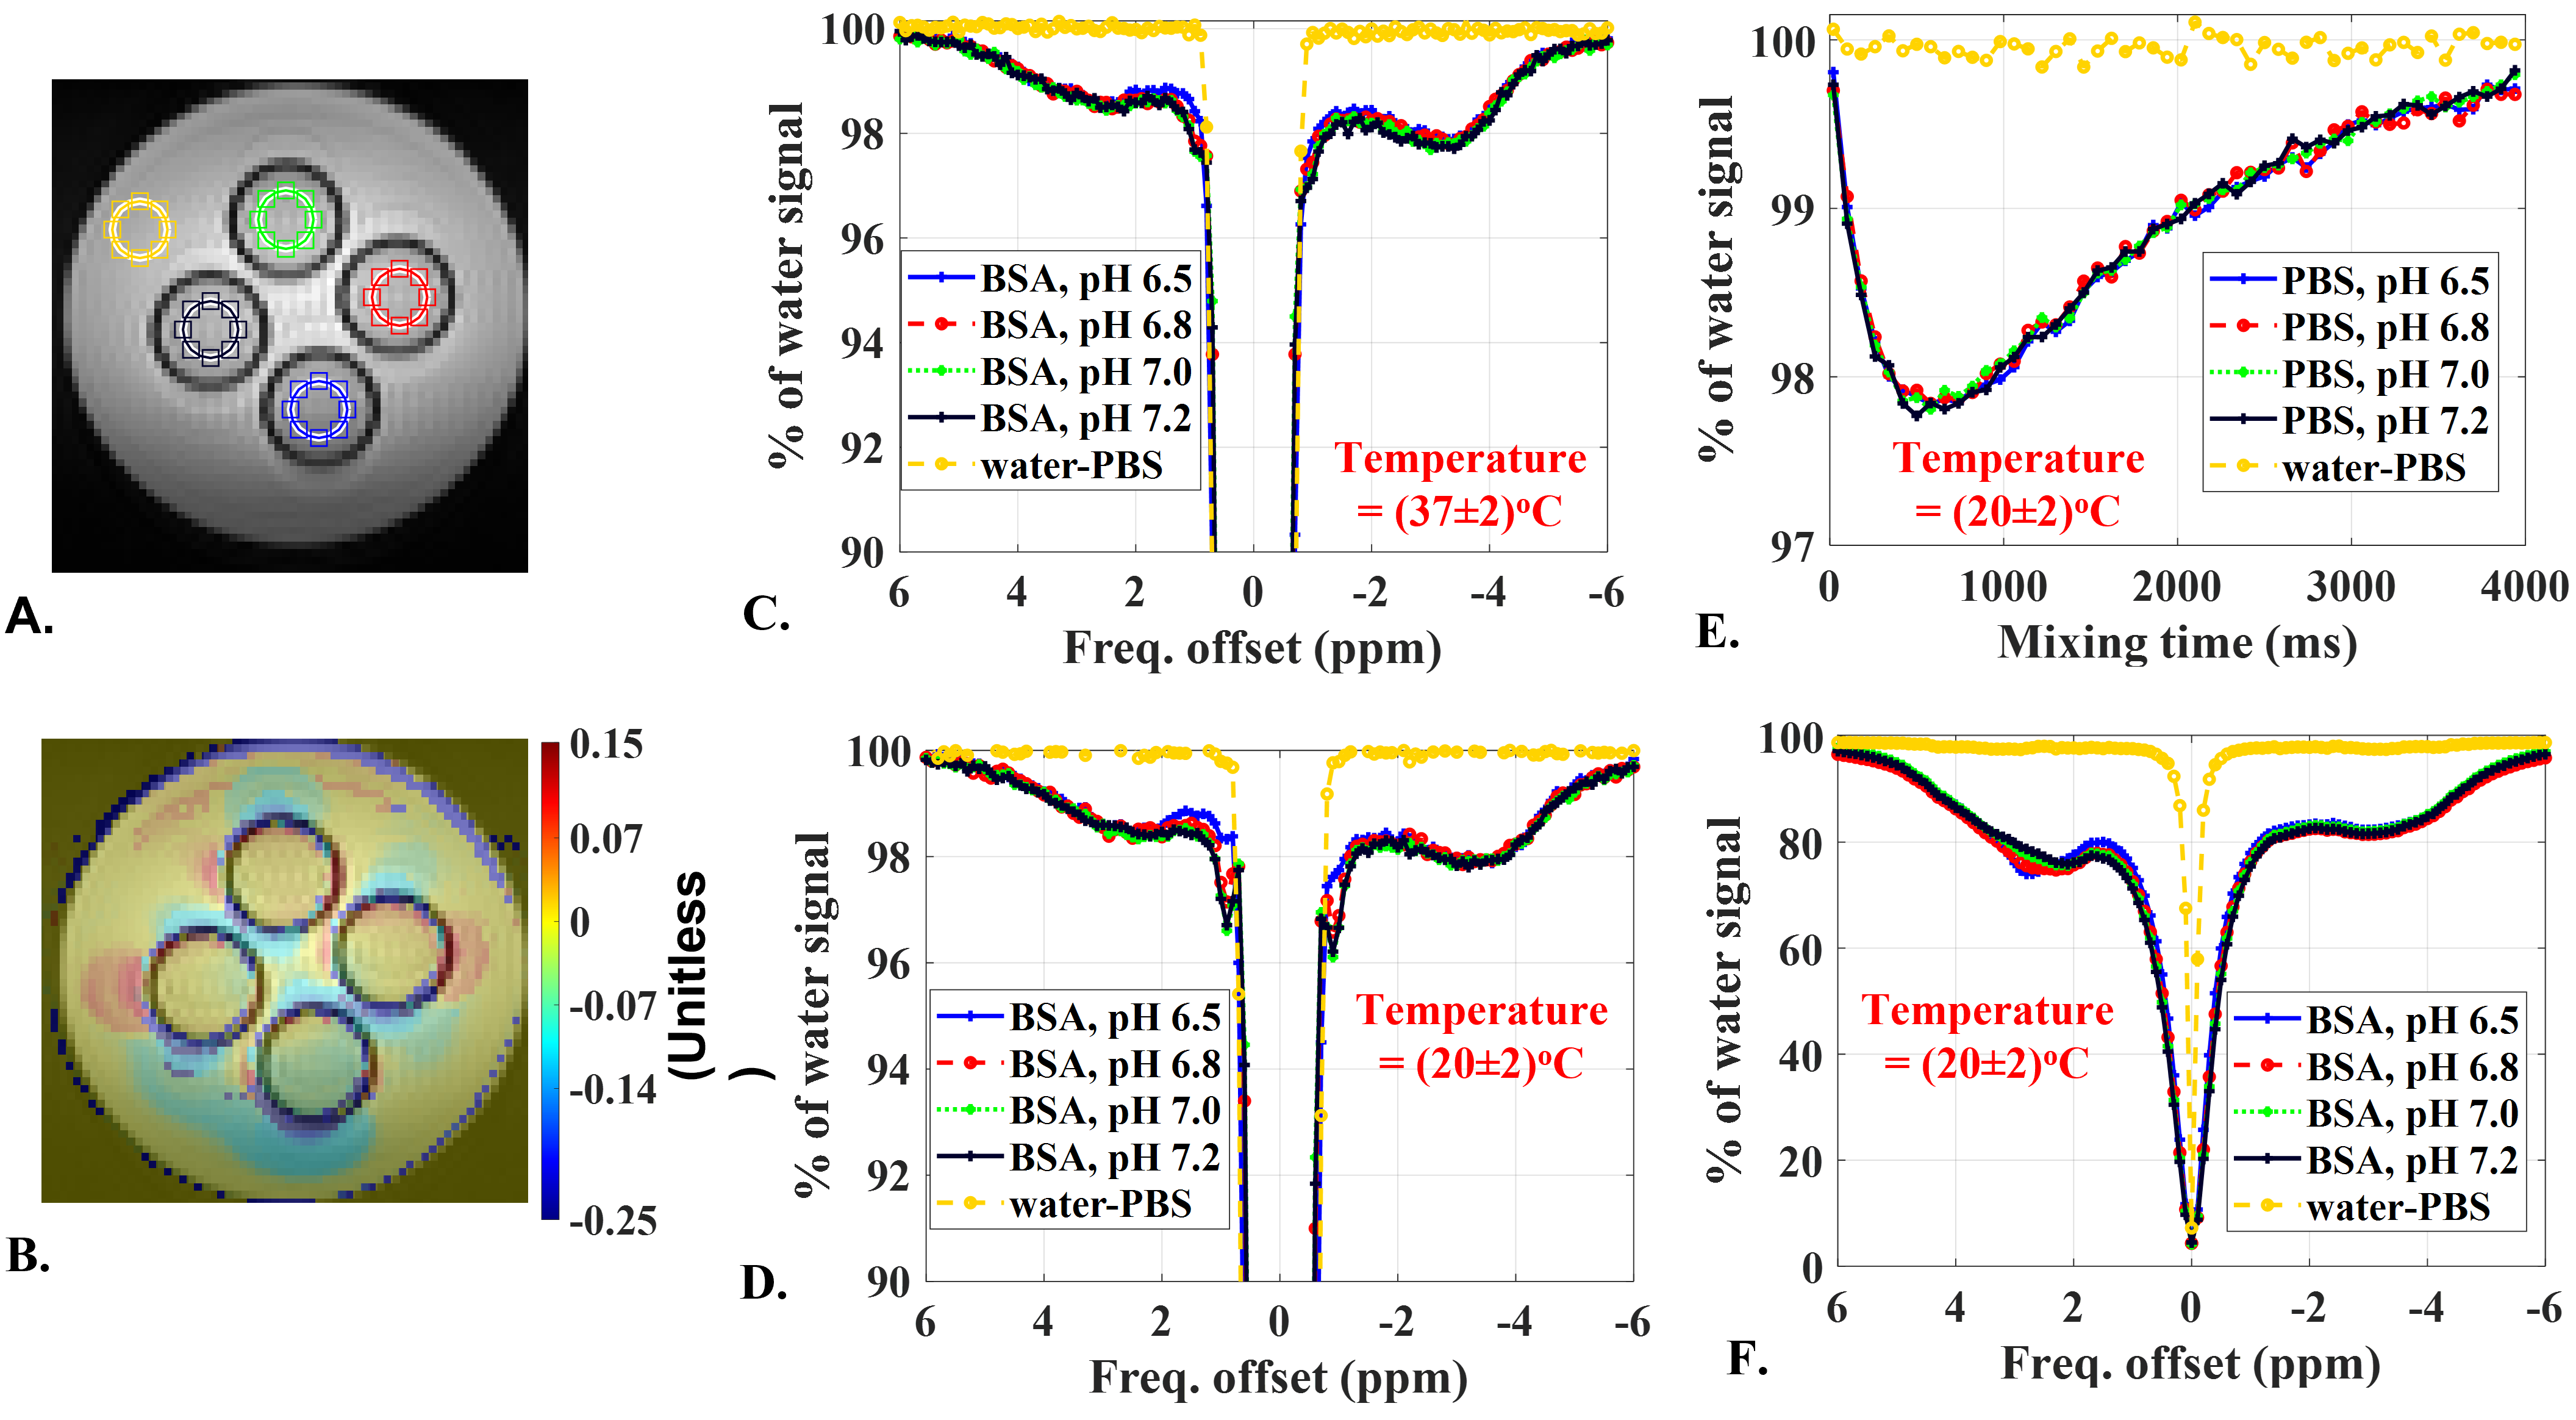
In vitro Study: To examine the temperature and pH dependence of NOE quantification within the physiological limits, in vitro set up consisting of four NMR tubes containing 20% (by weight/volume) BSA samples at pH = 6.5, 6.8, 7.0, 7.4 was used. These tubes were immersed in phosphate buffer saline (PBS) solution. FSIR spectra, mixing time dependent tNOE data and ssNOE data were acquired. Common imaging parameters were: resolution 1x1 mm2; matrix size 100x100; thickness 15 mm; FOV phase = 100%; averages 4; rBW 550 Hz/pixel. TR = 10 seconds; tfl-TE 1.62 ms; tfl-TR 3.5 ms; tfl-FA 4o.
Human study: Three healthy human volunteers (3 males, aged 27, 24, 43, years old) participated in local Institutional Review Board approved study protocol. The study included acquiring FSIR spectra, mixing time dependent tNOE data. We also acquired tNOE and ssNOE data from one participant for comparison purpose. The common imaging parameter included: resolution 1.875x1.875 mm2; matrix size 128x128; thickness 10 mm; FOV phase 100%; averages 4; rBW 550 Hz/pixel, TR 6s. The MTR asymmetry for ssNOE and tNOE signal at frequency offset of Δω, was calculated as:
$$ NOE_{MTR}(\Delta \omega) = 100\times\frac{M_{FSIR}(-100 ppm) - M_{FSIR}(\Delta \omega) }{ M_{FSIR}(-100 ppm) } $$
Where MFSIR(Δω) is tNOE intensity at frequency offset Δω. MFSIR at -100 ppm was taken as the reference image.
Results
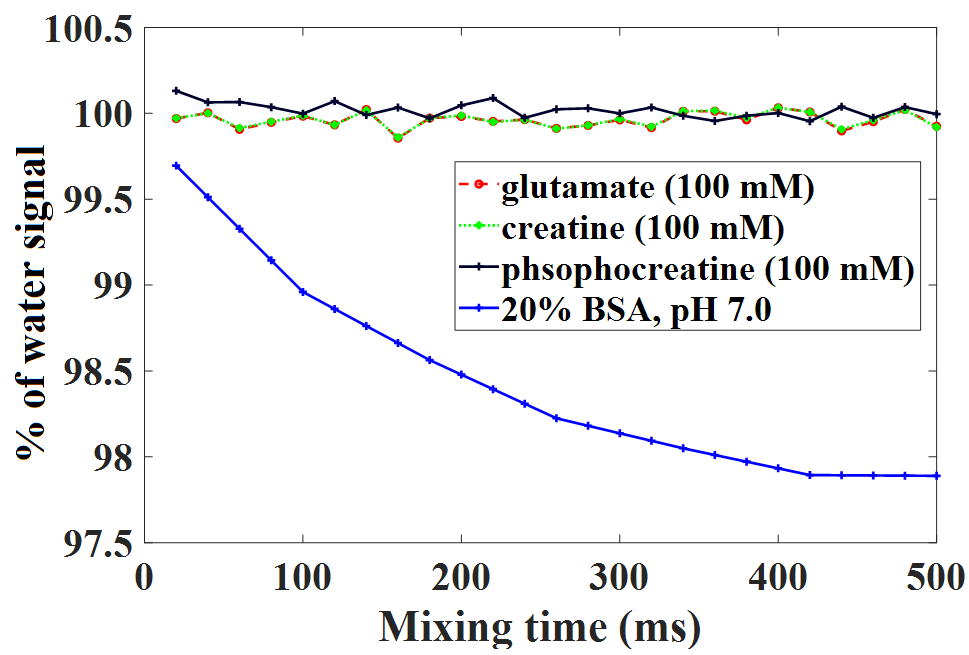
Fig. 2 depicts results from tNOE and ssNOE experiments of in vitro setup consisting of four BSA samples at pHs 6.5, 6.8, 7.0, 7.4. NOE contributions up the field of water peak showed no appreciable temperature dependence (Fig. 2C, 2D) and no appreciable pH dependence for both tNOE (Fig. 2C, 2D) and ssNOE (Fig. 2F) experiments. There were no appreciable FSIR signals beyond ±10 ppm, indicating that MT contribution from the bound water pool to cross-relaxation is also not significant for BSA phantoms. For the up field of the water peak, the ssNOE contributions (approximately 18%) were found to be much higher than corresponding tNOE signals (roughly 2% drop).Further, CE species, such as Glutamate (100 mM, pH 7.0), creatine (100 mM, pH 7.0) and phosphocreatine (100 mM, pH 7.0) did not show appreciable contributions to tNOE signals (Fig. 3).
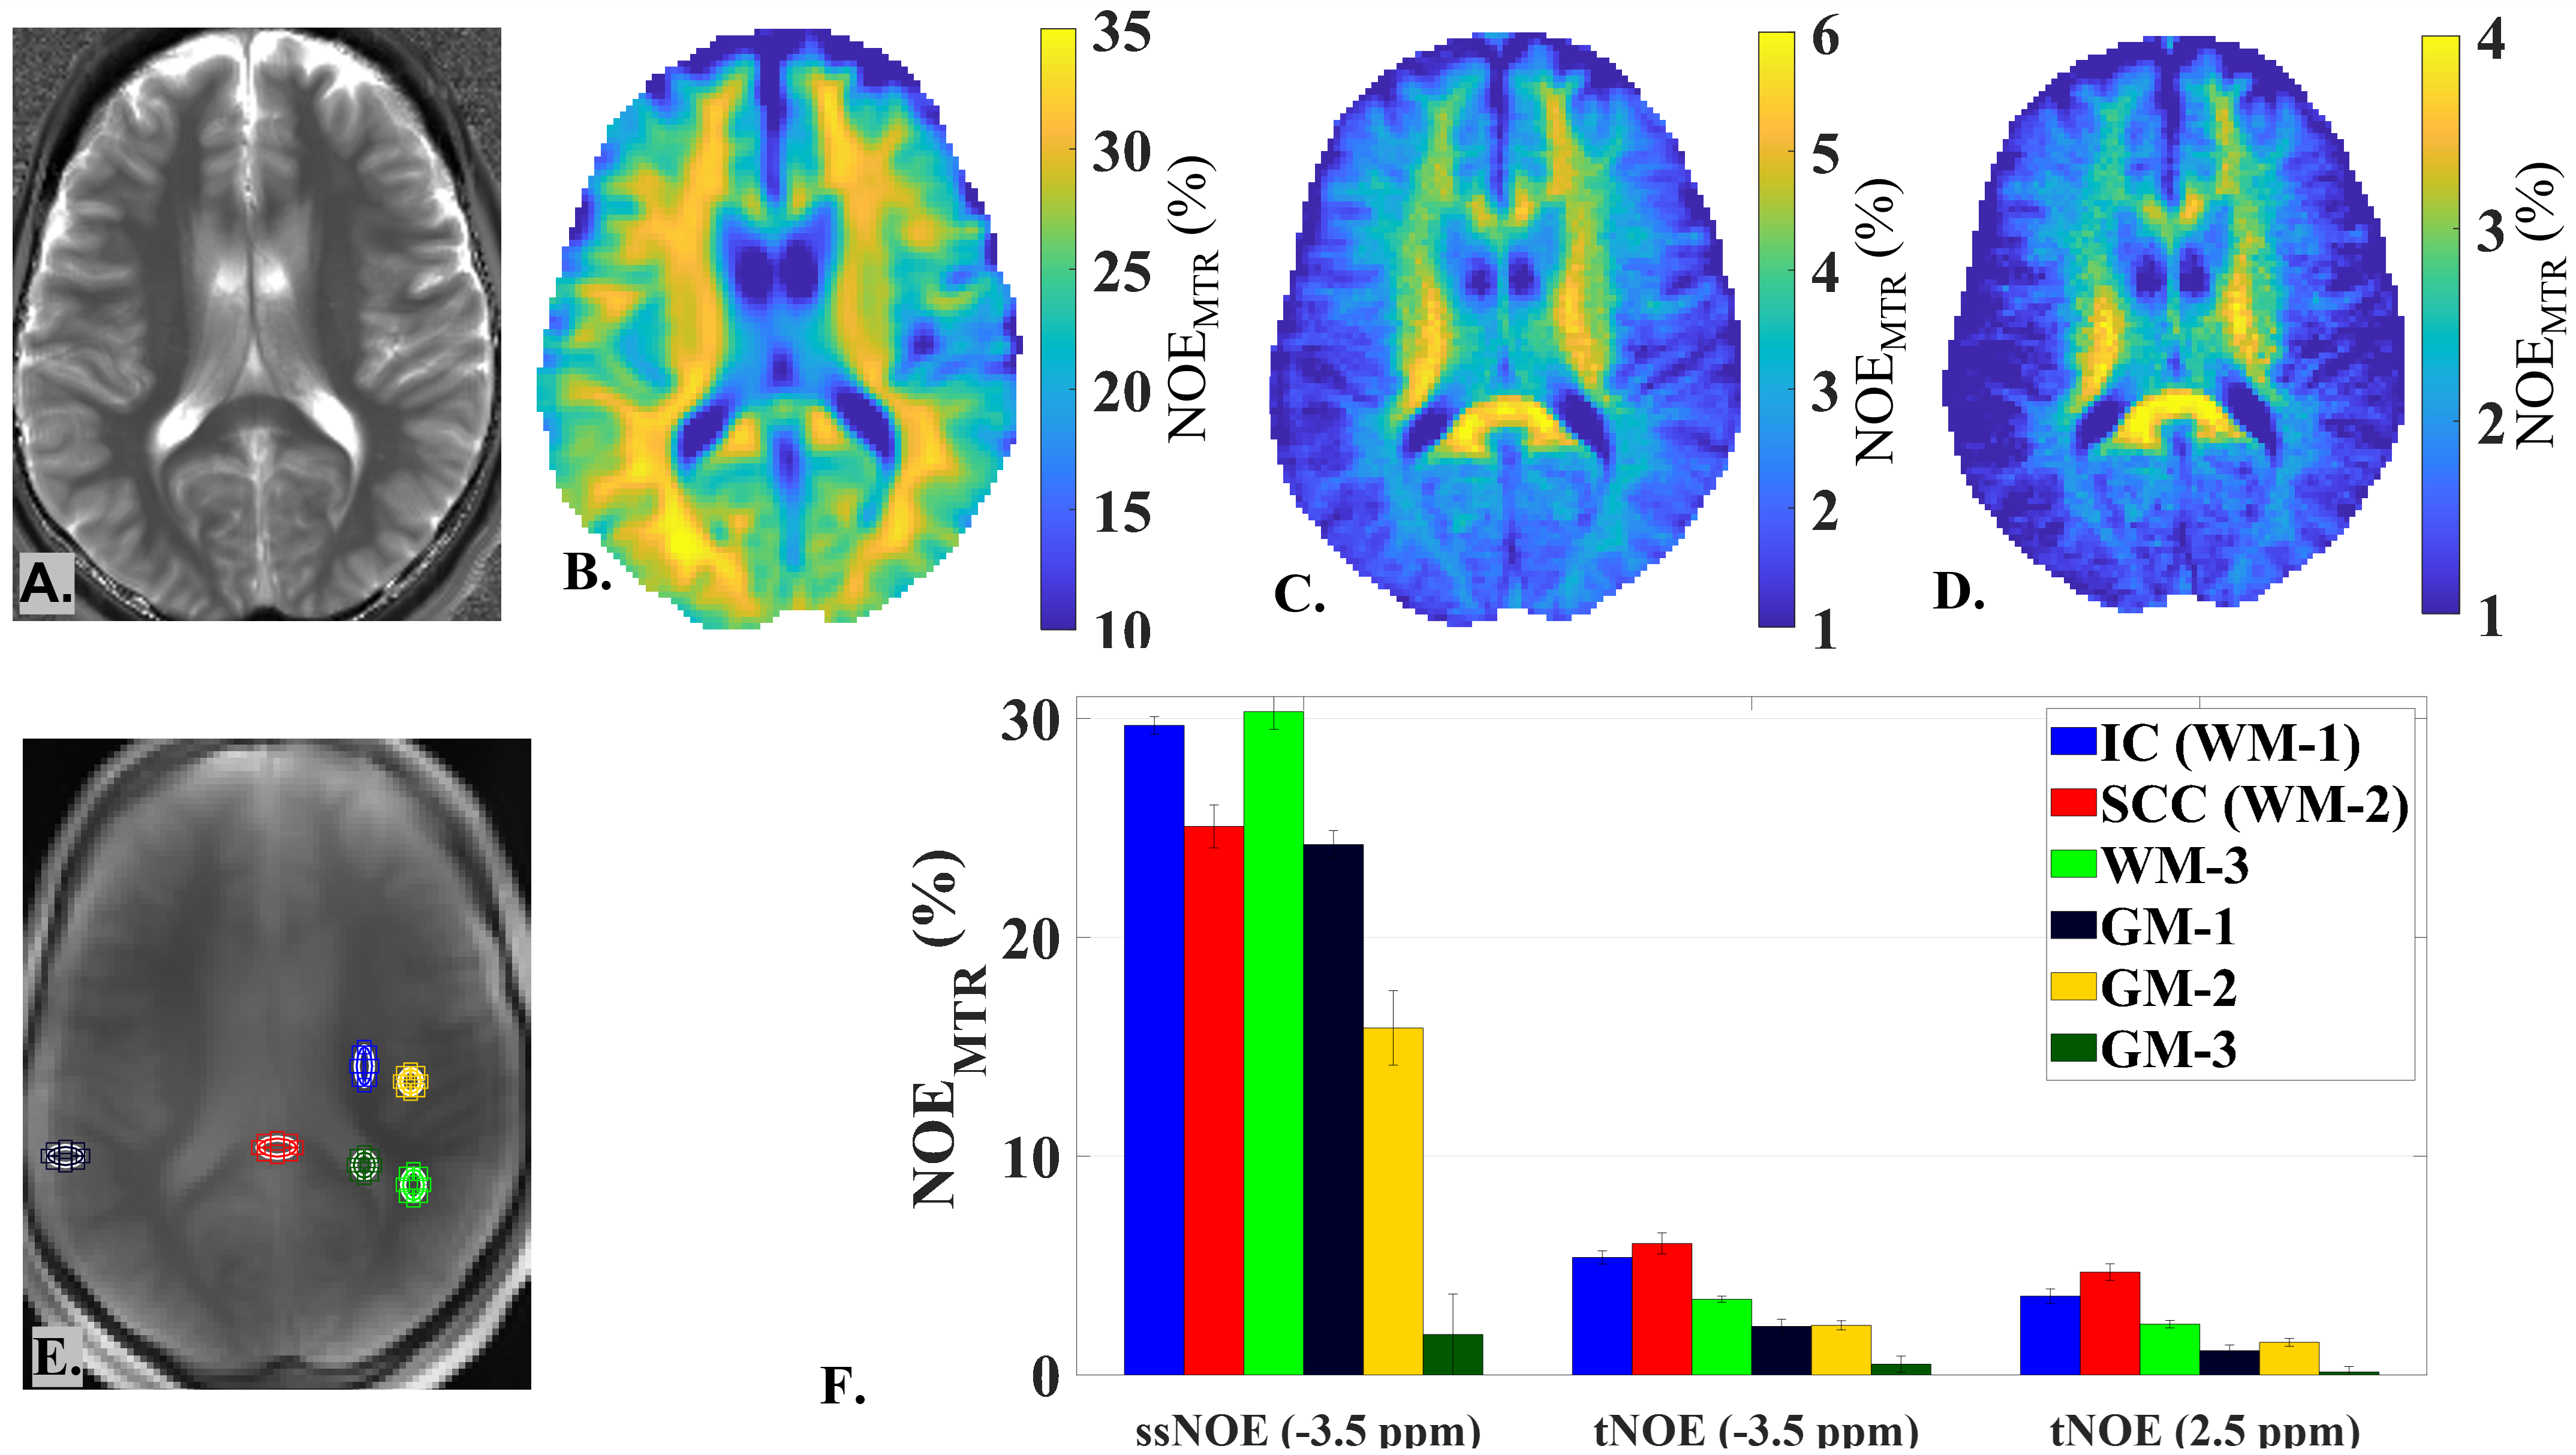
Compared to ssNOE map (-3.5 ppm relative to water peak) (Fig. 4.B), the tNOEMTR map at the same peak location showed better WM (white matter)-GM (gray matter)-CSF (cerebrospinal fluid) contrasts and captured the regional variabilities in WM more faithfully, showing higher NOE-values for parts of WM, such as posterior limb of internal capsule (IC), genu and splenium of corpus callosum (CC) (Fig. 4.C, Fig. 4.D). For the tNOEMTR map (at +2.5 ppm relative to water peak) (Fig. 4.D), we detected the WM-GM-CSF contrasts similar to the tNOEMTR map (at -3.5 ppm relative to water peak) (Fig. 4.C), albeit with reduced contributions.
Discussion
For the MTR asymmetry calculation, tNOE data acquisition for a single 2D slice was ~3x faster than comparable ssNOE data acquisition. It also provides aromatic (down field) and aliphatic (upfield) NOE without the contamination from the bulk water pool and CE effects. Given that tNOE is inversion-based and the MT comes from a very broad spectrum, the MT contribution to tNOE is also substantially reduced. Also, the FSIR was implemented using transmit B1-robust adiabatic pulse. As tNOEMTR calculation involves taking ratio of two tNOE weighted images, it does not require any correction for receive B1 inhomogeneities. The regional variations seen in tNOE map are consistent with the myelination pattern reported in literatures [8] [9][10][11][12][13][14][15][16][17][18][19][20][21].Conclusion
The proposed brain lipid imaging method has been shown to have improved specificity, faster scan time, and robust quantification with minimal confounding contributions.Acknowledgements
Research reported in this publication was supported by the National Institute of Biomedical Imaging and Bioengineering of the National Institutes of Health under award Number P41EB029460.References
[1] C. K. Jones et al., “Nuclear Overhauser enhancement (NOE) imaging in the human brain at 7T,” Neuroimage, vol. 77, pp. 114–124, 2013, doi: 10.1016/j.neuroimage.2013.03.047.
[2] M. Zaiss et al., “Relaxation-compensated CEST-MRI of the human brain at 7T: Unbiased insight into NOE and amide signal changes in human glioblastoma,” Neuroimage, vol. 112, pp. 180–188, 2015, doi: 10.1016/j.neuroimage.2015.02.040.
[3] X.-Y. Zhang et al., “MR Imaging of a Novel NOE-mediated Magnetization Transfer with Water in Rat Brain at 9.4 T,” Magn Reson Med., vol. 78, no. 2, pp. 588–597, 2017, doi: 10.1002/mrm.26396.MR.
[4] Xiao-Yong Zhang et al., “Accuracy in the Quantification of Chemical Exchange Saturation Transfer (CEST) and relayed Nuclear Overhauser Enhancement (rNOE) saturation transfer effects,” NMR Biomed., vol. 30, no. 7, 2017, doi: 10.1002/nbm.3716.
[5] Z. Zu, “Ratiometric NOE(−1.6) contrast in brain tumors,” NMR Biomed., vol. 31, no. 12, pp. 1–10, 2018, doi: 10.1002/nbm.4017.
[6] T. Kim, W. Shin, and S.-G. Kim, “Fast Magnetization Transfer and Apparent T1 Imaging with a Short Saturation Pulse using with and without Inversion Preparation,” vol. 71, no. 3, pp. 1264–1271, 2014, doi: 10.1002/mrm.24756.Fast.
[7] H. Mehrabian, K. L. Desmond, H. Soliman, A. Sahgal, and G. J. Stanisz, “Differentiation between radiation necrosis and tumor progression using chemical exchange saturation transfer,” Clin. Cancer Res., vol. 23, no. 14, pp. 3667–3675, 2017, doi: 10.1158/1078-0432.CCR-16-2265.
[8] A. J. Barkovich, G. Lyon, and P. Evrard, “Formation, maturation, and disorders of white matter,” Am. J. Neuroradiol., vol. 13, no. 2, pp. 447–461, 1992.
[9] J. Blaauw and L. C. Meiners, “The splenium of the corpus callosum: embryology, anatomy, function and imaging with pathophysiological hypothesis,” Neuroradiology, vol. 62, no. 5, pp. 563–585, 2020, doi: 10.1007/s00234-019-02357-z.
[10] D. Kumar, T. D. Nguyen, S. a Gauthier, and A. Raj, “Bayesian algorithm using spatial priors for multiexponential T(2) relaxometry from multiecho spin echo MRI.,” Magn. Reson. Med., vol. 68, no. 5, pp. 1536–43, Nov. 2012, doi: 10.1002/mrm.24170.
[11] D. Kumar et al., “Using 3D spatial correlations to improve the noise robustness of multi component analysis of 3D multi echo quantitative T2 relaxometry data,” Neuroimage, vol. 178, pp. 583–601, Sep. 2018, doi: 10.1016/j.neuroimage.2018.05.026.
[12] T. Prasloski, B. Mädler, Q.-S. Xiang, A. MacKay, and C. Jones, “Applications of stimulated echo correction to multicomponent T2 analysis,” Magn. Reson. Med., vol. 67, no. 6, pp. 1803–1814, Jun. 2012, doi: 10.1002/mrm.23157.
[13] T. Prasloski et al., “Rapid whole cerebrum myelin water imaging using a 3D GRASE sequence.,” Neuroimage, vol. 63, no. 1, pp. 533–9, Oct. 2012, doi: 10.1016/j.neuroimage.2012.06.064.
[14] A. I. Schmid et al., “Exercising calf muscle T2* changes correlate with pH, PCr recovery and maximum oxidative phosphorylation,” NMR Biomed., vol. 27, no. 5, pp. 553–560, 2014, doi: 10.1002/nbm.3092.
[15] S. M. Meyers et al., “Reproducibility of myelin water fraction analysis: a comparison of region of interest and voxel-based analysis methods.,” Magn. Reson. Imaging, vol. 27, no. 8, pp. 1096–103, Oct. 2009, doi: 10.1016/j.mri.2009.02.001.
[16] H. Liu et al., “Myelin Water Atlas: A Template for Myelin Distribution in the Brain,” J. Neuroimaging, vol. 29, no. 6, pp. 699–706, 2019, doi: 10.1111/jon.12657.
[17] M. Ganzetti, N. Wenderoth, and D. Mantini, “Whole brain myelin mapping using T1- and T2-weighted MR imaging data,” Front. Hum. Neurosci., vol. 8, no. SEP, pp. 1–14, 2014, doi: 10.3389/fnhum.2014.00671.
[18] H. Zhang, T. Schneider, C. A. Wheeler-Kingshott, and D. C. Alexander, “NODDI: Practical in vivo neurite orientation dispersion and density imaging of the human brain,” Neuroimage, vol. 61, no. 4, pp. 1000–1016, 2012, doi: 10.1016/j.neuroimage.2012.03.072.
[19] F. Grussu et al., “Neurite dispersion: a new marker of multiple sclerosis spinal cord pathology?,” Ann. Clin. Transl. Neurol., vol. 4, no. 9, pp. 663–679, 2017, doi: 10.1002/acn3.445.
[20] D. Sone, “Neurite orientation and dispersion density imaging: Clinical utility, efficacy, and role in therapy,” Reports Med. Imaging, vol. 12, pp. 17–29, 2019, doi: 10.2147/RMI.S194083.
[21] F. Aboitiz, A. B. Scheibel, R. S. Fisher, and E. Zaidel, “Fiber composition of the human corpus callosum,” Brain Res., vol. 598, no. 1–2, pp. 143–153, 1992, doi: 10.1016/0006-8993(92)90178-C.
Figures
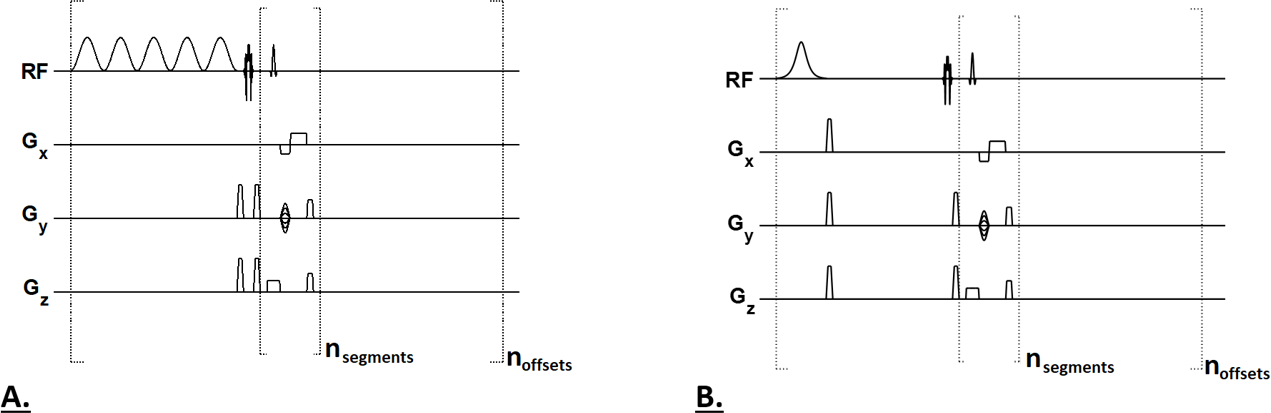
Fig. 1.A: For a ssNOE sequence, a frequency selective saturation pulse train (B1rms of 0.725 μT, duration 3s) was followed by a single-shot TurboFLASH (tfl) readout with centric phase-encoding order. 1.B: For a tNOE sequence, a frequency selective inversion (FSIR) pulse was followed by mixing time (TI), which was then followed by a single-shot TurboFLASH (tfl) readout with centric phase-encoding order. A chemical shift–selective (CHESS) fat-saturation pulse was applied immediately before image readout for both sequences.