3291
Feasibility of Mapping Intracellular NAD Content in Entire Human Brain at 7T1Center for Magnetic Resonance Research, Department of Radiology, University of Minnesota, Minneapolis, MN, United States, 2Siemens Medical Solutions USA, Inc., Urbana, IL, United States, 3Beckman Institute for Advanced Science and Technology, University of Illinois at Urbana-Champaign, Urbana, IL, United States, 4National Center for Supercomputing Applications, University of Illinois at Urbana-Champaign, Urbana, IL, United States, 5Department of Electrical and Computer Engineering, University of Illinois at Urbana-Champaign, Urbana, IL, United States
Synopsis
Keywords: Quantitative Imaging, Metabolism, Human Brain NAD Imaging
Nicotinamide adenine dinucleotide (NAD) is an important molecule critical for cellular metabolism and signaling. The cerebral NAD concentration is only at submillimolar level, and thus, difficult to measure and imaging in vivo. In this study, we utilize 3D 31P MRSI-based NAD assay in combination with a SPICE-based signal processing method to evaluate the feasibility for non-invasively mapping the NAD contents in healthy human brains at 7T. The results suggest that by taking advantage of ultrahigh field scanner and advanced post-processing, it is possible to obtain whole-brain NAD maps with NAD measurements consistent with the literature reported values.INTRODUCTION
Nicotinamide adenine dinucleotide (NAD) can be found in all living cells in oxidized (NAD+) and/or reduced (NADH) form. It acts as a coenzyme in various cellular redox reactions, and also serves as a substrate for different NAD+-consuming enzymes; thus, NAD plays important roles in cellular metabolism and signaling 1-3. The NAD concentration of human brains is at submillimolar level and difficult to measure in-situ. Recently developed in vivo 31P MRS-based NAD assay allows non-invasive measurement of intracellular NAD contents and redox ratio in human visual cortex 4,5. However, intracellular NAD level in various brain regions has not been systematically investigated due to technical challenges. In this study, we evaluated the feasibility of mapping NAD in the entire human brain by leveraging ultrahigh field 3D 31P MRS imaging (MRSI) in combination with an advanced SPICE-based post-processing approach to greatly enhance the sensitivity of 31P MRSI-based NAD assay at 7T.METHODS
In vivo 31P MRSI acquisition: Four healthy volunteers participated in this study using a study protocol approved by University of Minnesota IRB. In vivo 31P MRSI data were acquired using a 90-cm bore 7T Magnex magnet with a Varian INOVA console. A 1H/31P double-tuned TEM volume coil with quadrature driving was used. Three dimensional (3D) 31P chemical shift imaging (CSI) was acquired using a Fourier series window imaging technique 6 with spectral bandwidth=5000Hz, flip angle=45°, FOV=20×20×22cm3, matrix size=15×15×13, TR=0.5s, cylindrical voxel with 2.4cc nominal voxel size and total acquisition time of 51 minutes.SPICE-based data processing and analysis: The data processing pipeline includes: (a) correction of frequency variations; (b) denoising using a subspace-based method; and (c) model-based spectral quantification. First, to remove the frequency variations in the 31P-MRSI signals caused by field inhomogeneity, the resonance frequency of PCr in each voxel was estimated using HSVD and aligned to 0 ppm 7. Then the 31P-MRSI signals were denoised using subspace modeling as proposed in the SPICE method 8-10. More specifically, based on the partial separability model 8, the 31P-MRSI signals (denoted as $$$\rho(x,t)$$$) can be represented using a low-rank subspace model as:
$$\rho(x,t)=\sum^{L}_{l=1}u_l(x)v_l(t)$$
where $$$\{v_l(t)\}, \{u_l(x)\}, L$$$ denote the basis functions, corresponding spatial coefficients and the model order, respectively. The basis functions could be estimated and learned from training data 10, but they were estimated from the data itself to preserve signals features. Denoising was performed by solving the following optimization problem:
$$\hat{U}=\textrm{arg }\textrm{min}_U{\parallel}\rho_r-UV{\parallel}+\lambda{\parallel}WU{\parallel}_2^2$$
where $$$U$$$ and $$$V$$$ are the matrix forms of $$$\{u_l(x)\}$$$ and $$$\{v_l(t)\}$$$, respectively. $$$\rho_r$$$ is the original MRSI signals, and $$$W$$$ is the total variation operator. With the estimated $$$\hat{U}$$$, the denoised MRSI signals were generated as $$$\rho_d=\hat{U}V$$$. Spectral quantification was performed using a time-domain fitting method using a basis set including resonance structures of all the measurable 31P metabolites 11,12. After spectral fitting, the concentrations of metabolites were calculated using γ-ATP as an internal reference:
$$C_m=\frac{C_{{\gamma}ATP}}{N_m}\frac{E_{{\gamma}ATP}}{E_m}\frac{S_m}{S_{{\gamma}ATP}}$$
where $$$C,S,E,N$$$ are the concentration, fitted signals intensity, T1 saturation factor, and number of 31P spins in each metabolite, respectively. $$$C_{{\gamma}ATP}$$$ was set as 2.8 mM 5.
RESULTS
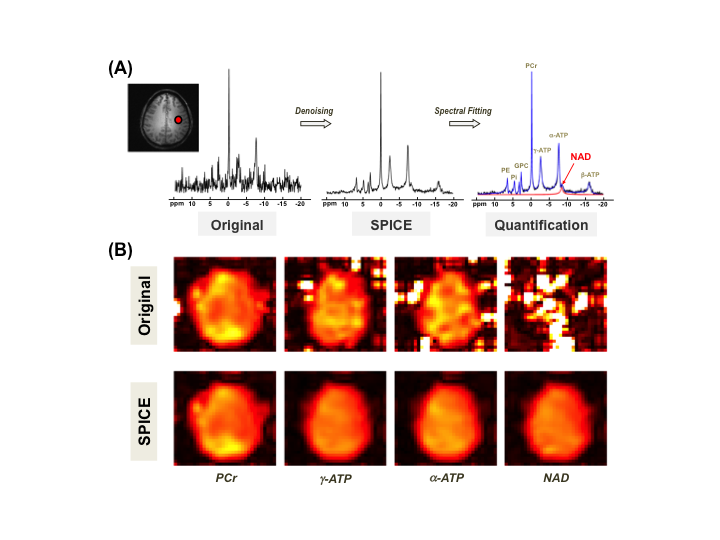
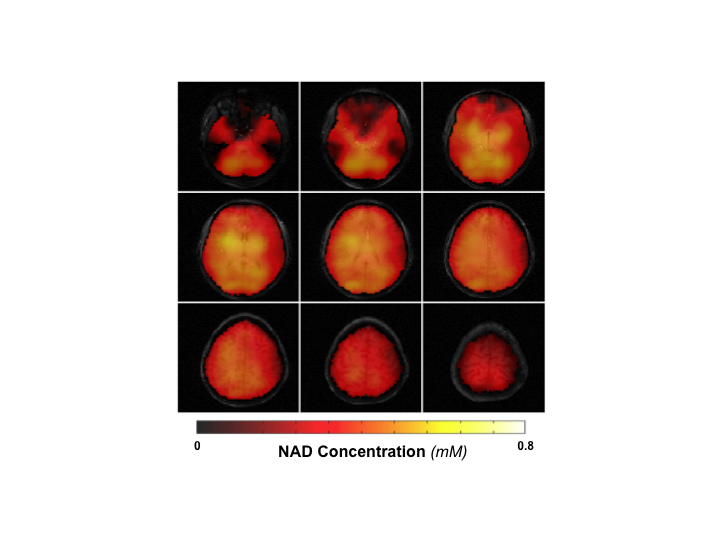
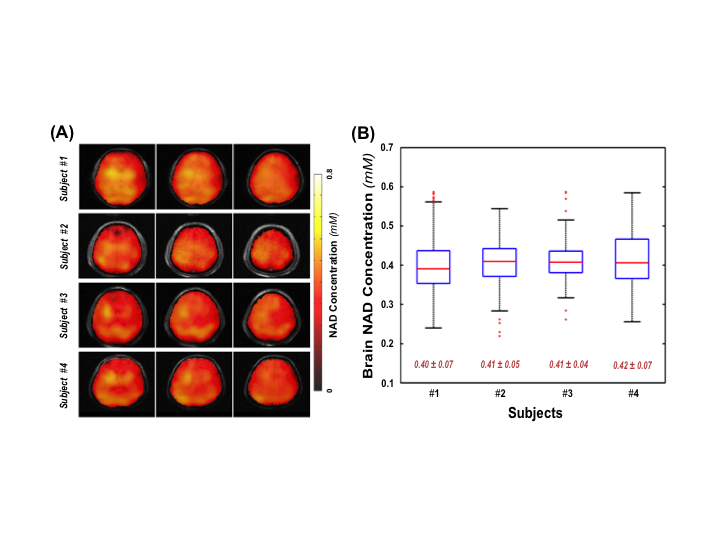
Figure 1A shows the typical 31P spectra of a single voxel extracted from a 3D 31P-CSI before and after applying the SPICE-based processing method that achieves several-fold (≥3×) noise reduction and preserves the true signal of phosphorous metabolites for spectral fitting and quantification. Figure 1B displays representative metabolite maps of phosphocreatine (PCr), γ- and α-ATP, as well as total NAD before and after SPICE processing, indicating that the quality of the maps is greatly improved, especially for low-concentration metabolites such as NAD. Figure 2 shows the concentration maps of NAD covering the entire human brain of a representative subject, suggesting that intracellular NAD concentrations appear to have a relatively homogeneous distribution, with a slightly higher level in midbrain or thalamic regions. Similar observations in other three subjects are shown in Fig. 3A. Figure 3B plots the actual NAD concentration levels across subjects (≈ 0.41mM), which were consistent among all four subjects studied to date.DISCUSSION and CONCLUSION
Using a double-tuned 1H/31P head volume coil at 7T, we were able to obtain 3D 31P MRSI covering entire human brain with reasonably high sensitivity and spatial resolution. However, for small metabolite signals such as NAD, it is still very challenging to image and quantify NAD due to limited signal-to-noise ratio (SNR) in individual CSI voxels. In this study, we applied the subspace-based approach to process the original 7T 31P MRSI data and achieved over 3-fold noise reduction, which made it possible for the first time to quantify and map low-level NAD contents of the entire human brain. We found that the brain NAD concentration and its spatial distribution were consistent among different subjects, and the averaged whole-brain NAD levels were in good agreement with the reported values obtained from human occipital region with sufficiently high 31P SNR and without applying any denoising method 5.In conclusion, by combining the ultrahigh-field 3D 31P MRSI with an advanced post-processing method, we demonstrate the feasibility of whole-brain NAD mapping in healthy human at 7T. This approach would allow non-invasive monitoring of cerebral NAD and its changes in different brain regions under various brain conditions.
Acknowledgements
NIH Grants: U01EB026978, R01 CA240953, NS118330, P41 EB027061.References
1. Ziegler M. New functions of a long-known molecule. Emerging roles of NAD in cellular signaling. Eur. J. Biochem. 2000;267(6):1550–64.
2. Belenky P, Bogan KL, and Brenner C. NAD+ metabolism in health and disease. Trends in Biochemical Sciences. 2007;32(1):12–19.
3. Verdin E. NAD⁺ in aging, metabolism, and neurodegeneration. Science. 2015;350(6265):1208–1213.
4. Lu M, Zhu XH, Zhang Y, and Chen W. Intracellular redox state revealed by in vivo 31P MRS measurement of NAD+ and NADH contents in brains. Magn Reson Med. 2014;71(6):1959-72.
5. Zhu XH, Lu M, Lee BY, Ugurbil K, and Chen W. In vivo NAD assay reveals the intracellular NAD contents and redox state in healthy human brain and their age dependences. Proc Natl Acad Sci U S A. 2015;112(9):2876-81.
6. K. Hendrich, et al. Spectroscopic imaging of circular voxels with a two-dimensional Fourier-series window technique. J Magn Reson B. 1994;105(3):225-32.
7. Barkhuijsen H, de Beer R, and van Ormondt D. Improved algorithm for noniterative time-domain model fitting to exponentially damped magnetic resonance signals. J. Magn. Reson, 1987;73(3):553–557.
8. Liang Z-P. Spatiotemporal imaging with partially separable functions. in 4th IEEE International Symposium on Biomedical Imaging: From Nano to Macro - Proceedings, 2007, pp. 988–991.
9. Lam F and Liang Z-P. A subspace approach to high-resolution spectroscopic imaging. Magn. Reson. Med. 2014;71(4):1349–1357.
10. Lam F, Li Y, Guo R, Clifford B, and Liang Z-P. Ultrafast magnetic resonance spectroscopic imaging using SPICE with learned subspaces. Magn. Reson. Med. 2020;83(2):377–390.
11. Li Y, Lam F, Clifford B, and Liang Z-P. A subspace approach to spectral quantification for MR spectroscopic imaging. IEEE Trans. Biomed. Eng., 2017;64(10):2486–2489.
12. Ratiney H et al., Time-domain semi-parametric estimation based on a metabolite basis set. NMR Biomed. 2005;18(1):1–13.
Figures