3287
Bloch-McConnell Simulation for Arterial Blood Contrast at 3T and 7T: Adiabatic Null Passage vs Binomial Magnetization Transfer Preparation1Donders Institute for Brain, Cognition and Behaviour, Radboud University, Nijmegen, Netherlands, 2Erwin L. Hahn Institute for Magnetic Resonance Imaging, University Duisburg-Essen, Essen, Germany, 3Department of Radiology, Harvard Medical School, Boston, MA, United States, 4Athinoula A. Martinos Center for Biomedical Imaging, Massachusetts General Hospital, Charlestown, MA, United States
Synopsis
Keywords: fMRI, Magnetization transfer, Arterial Blood Contrast
Arterial blood contrast (ABC) uses on-resonance binomial pulse for magnetization transfer preparation to saturate the tissue signal and highlights the contribution of arterioles. Previously, using Bloch-McConnel simulations, we showed that Binomial MT contaminates ABC with T2 contrast. We suggested the use of adiabatic null passage to decrease the T2 effect. We performed Bloch-McConnel simulations at 3T and 7T comparing the performance of binomial and ANP pulses. ANP increased the arterial contribution from 32% to 42% at 3T and from 18% to 30% at 7T. This study concludes that ANP reduces the T2-contamination imposed by binomial MT block and improves ABC.Introduction
BOLD contrast indirectly measures neuronal activation through the presence of deoxyhemoglobin in tissue [1] making GE-EPI the optimum sequence. Spin echo EPI was proposed to increase the specificity of the signal change to capillaries by refocusing the static dephasing around large vessels [2]. However, BOLD contrast relies on changes in deoxyhemoglobin making it specific to capillary and post-capillary vessels, whereas CBV-based imaging improves the specificity by better localizing the source of neuronal activity [3]. We showed that the use of an on-resonance magnetization transfer (MT) pulse efficiently saturates the signal from tissue increasing the sensitivity to changes in blood volume, which we termed: arterial blood contrast (ABC) [4]. Previously, by using McConnel equations, we incorporated MT into conventional signal modeling, and showed that binomial pulses impose significant T2 contamination upon the ideal contribution of the arterioles through direct saturation of free pool [5]. Here, we suggested the use of Adiabatic Null Passage (ANP) pulse to partly resolve this issue.Method
The total signal detected from a parenchymal voxel is the summation of four components:S(TE) = ∑(i=1:4)xiMiexp(-R2i*TE)
where i corresponds to arterioles, capillaries, venules, and tissue; xi to the weighting factor determining their contribution to the total signal; Mi to the steady-state magnetization; R2i* to the effective transverse relaxation rate. The relative signal weighting for each component is given by xi = viCi, where vi represents the volume fraction, and Ci is the fractional water content.
The grey matter (GM) protons exist in two different pools: a liquid highly mobile (water), and a relatively restricted semi-solid pool (macromolecules), among which the magnetization transfers through a cross-relaxation process [6]. Bloch-McConnell equations [7] model the MT by extending Bloch equations:
dM/dt = A.M + C
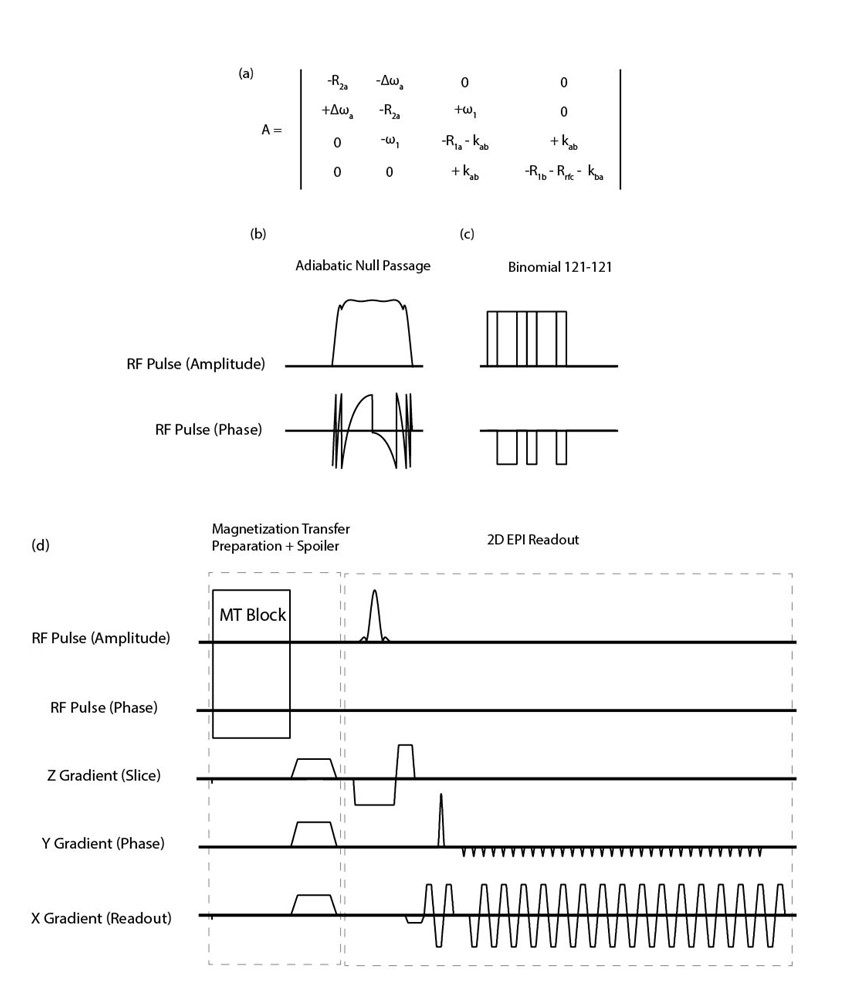
where = [Max, May, Mza, Mzb] is the combined magnetization vector for free (a) and bound pool (b), C = [0, 0, R1a.M0z, R1b.M0b] is given by longitudinal rates and equilibrium magnetizations. A is a 4x4 matrix shown in Fig 1a. Δωa represents the RF offset relative to the Larmor frequency; k the magnetization exchange rate; R1 and R2 relaxation rates; Rrfc the line-shape (G(Δω): super-Lorentzian function [8]) of the GM bound pool given by:
Rrfc(Δω) = ω12πG(Δω)
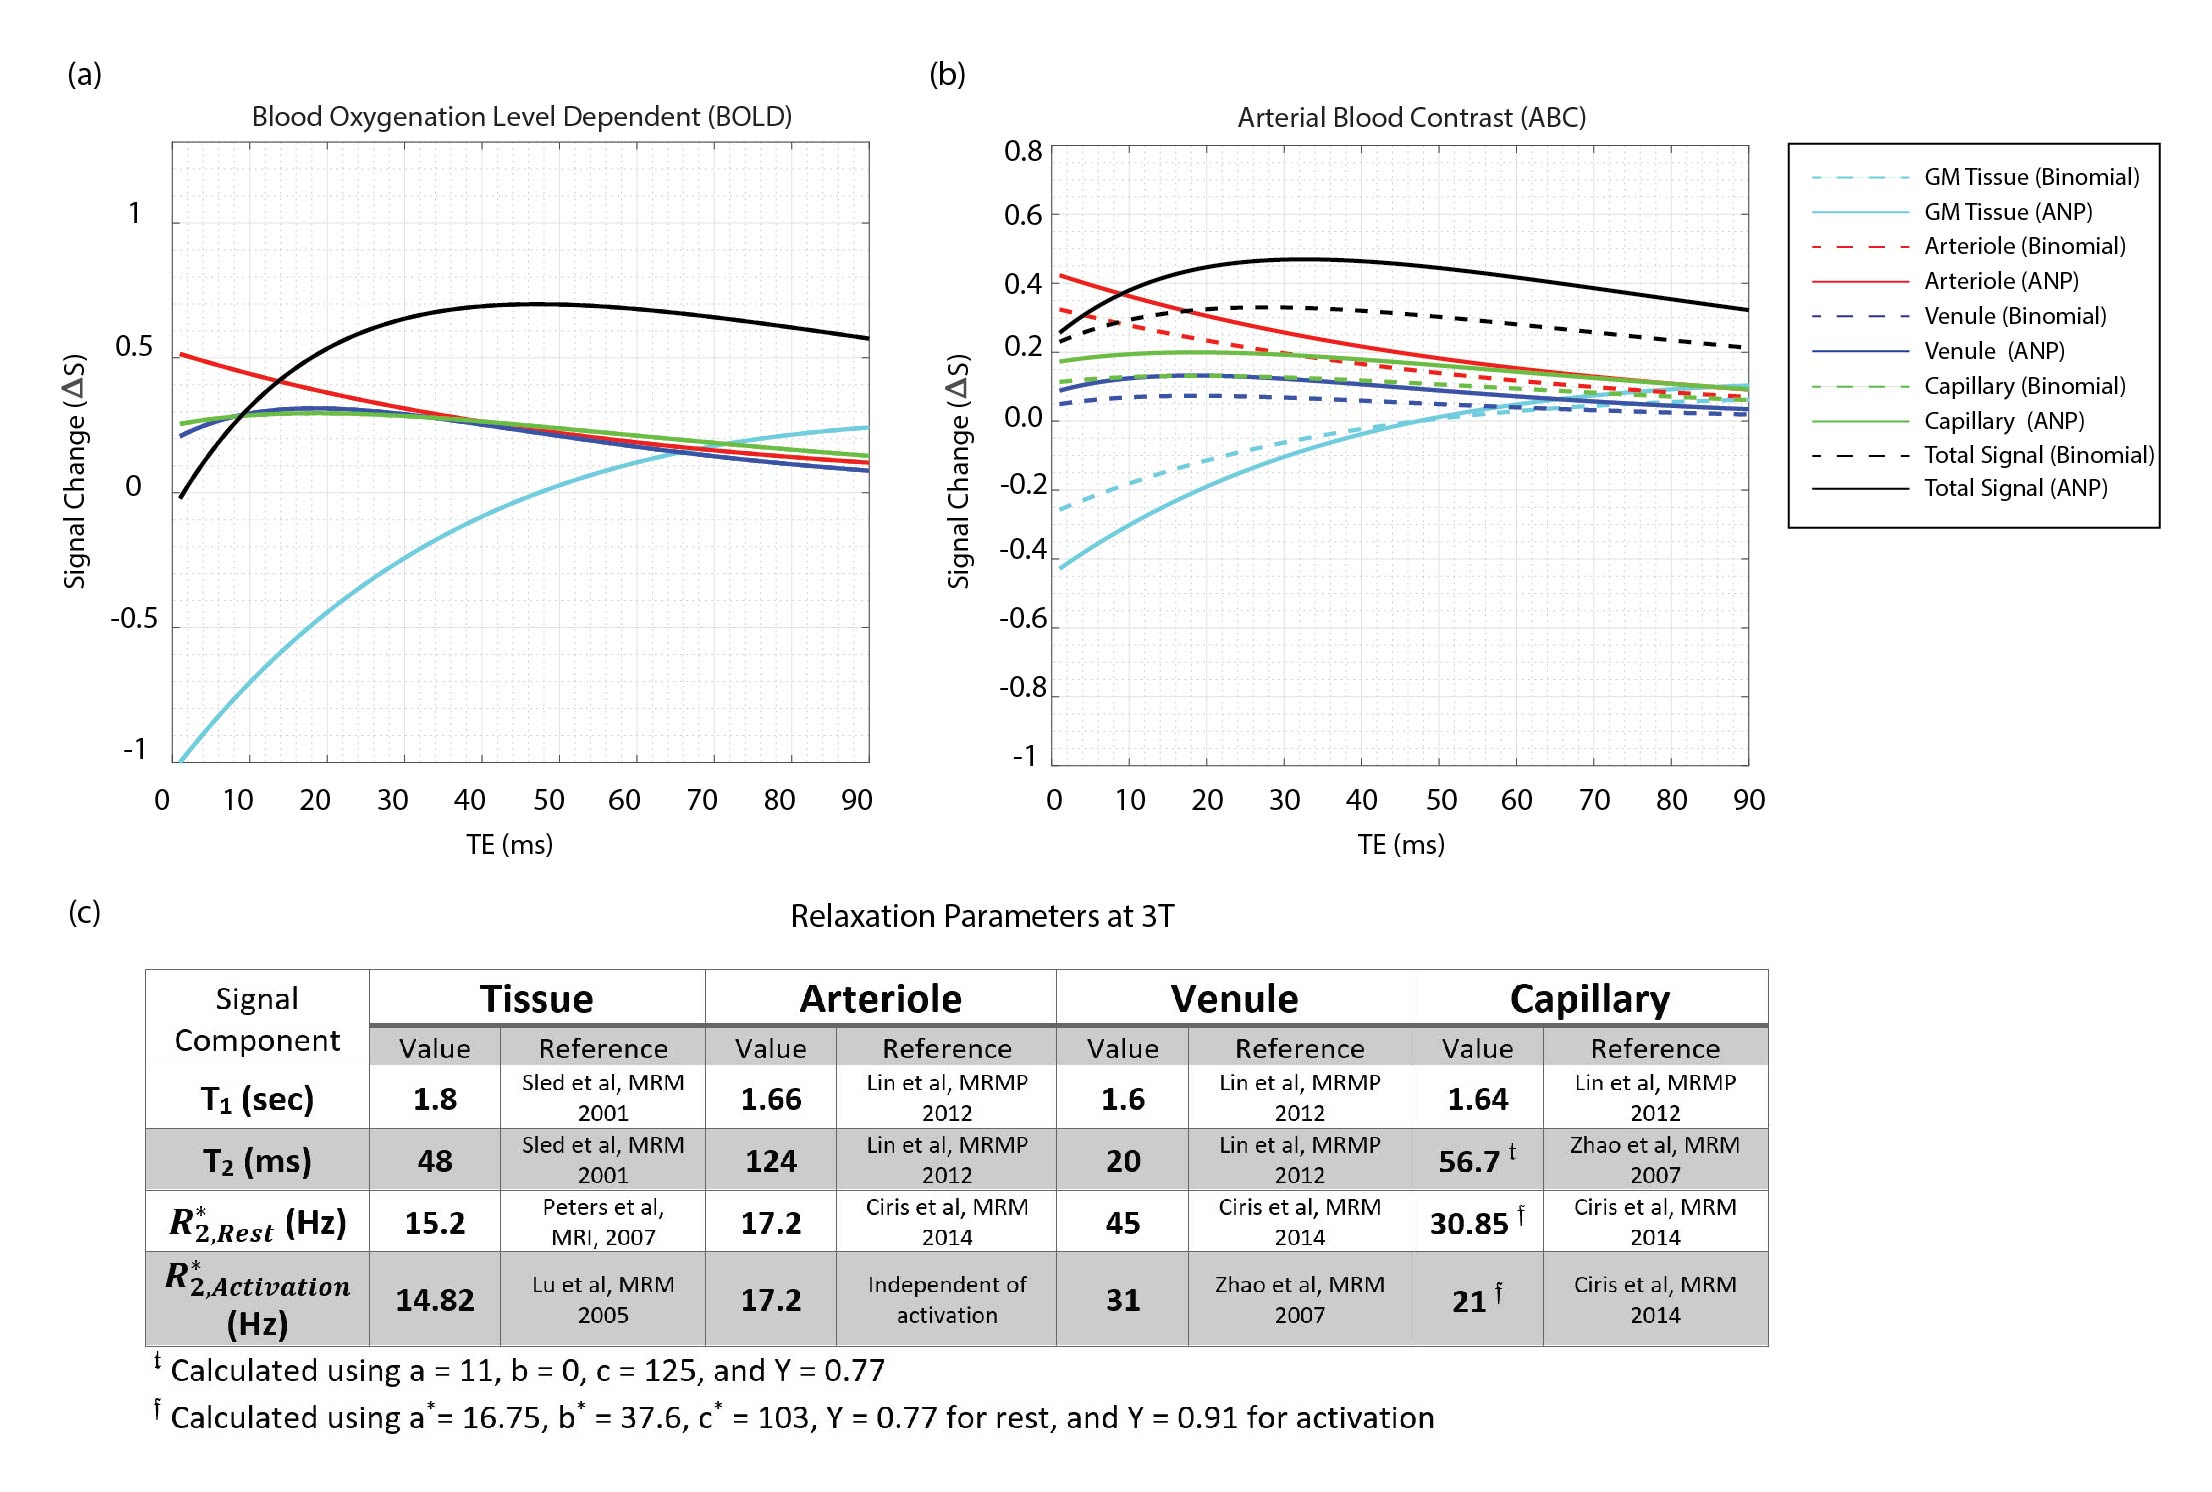
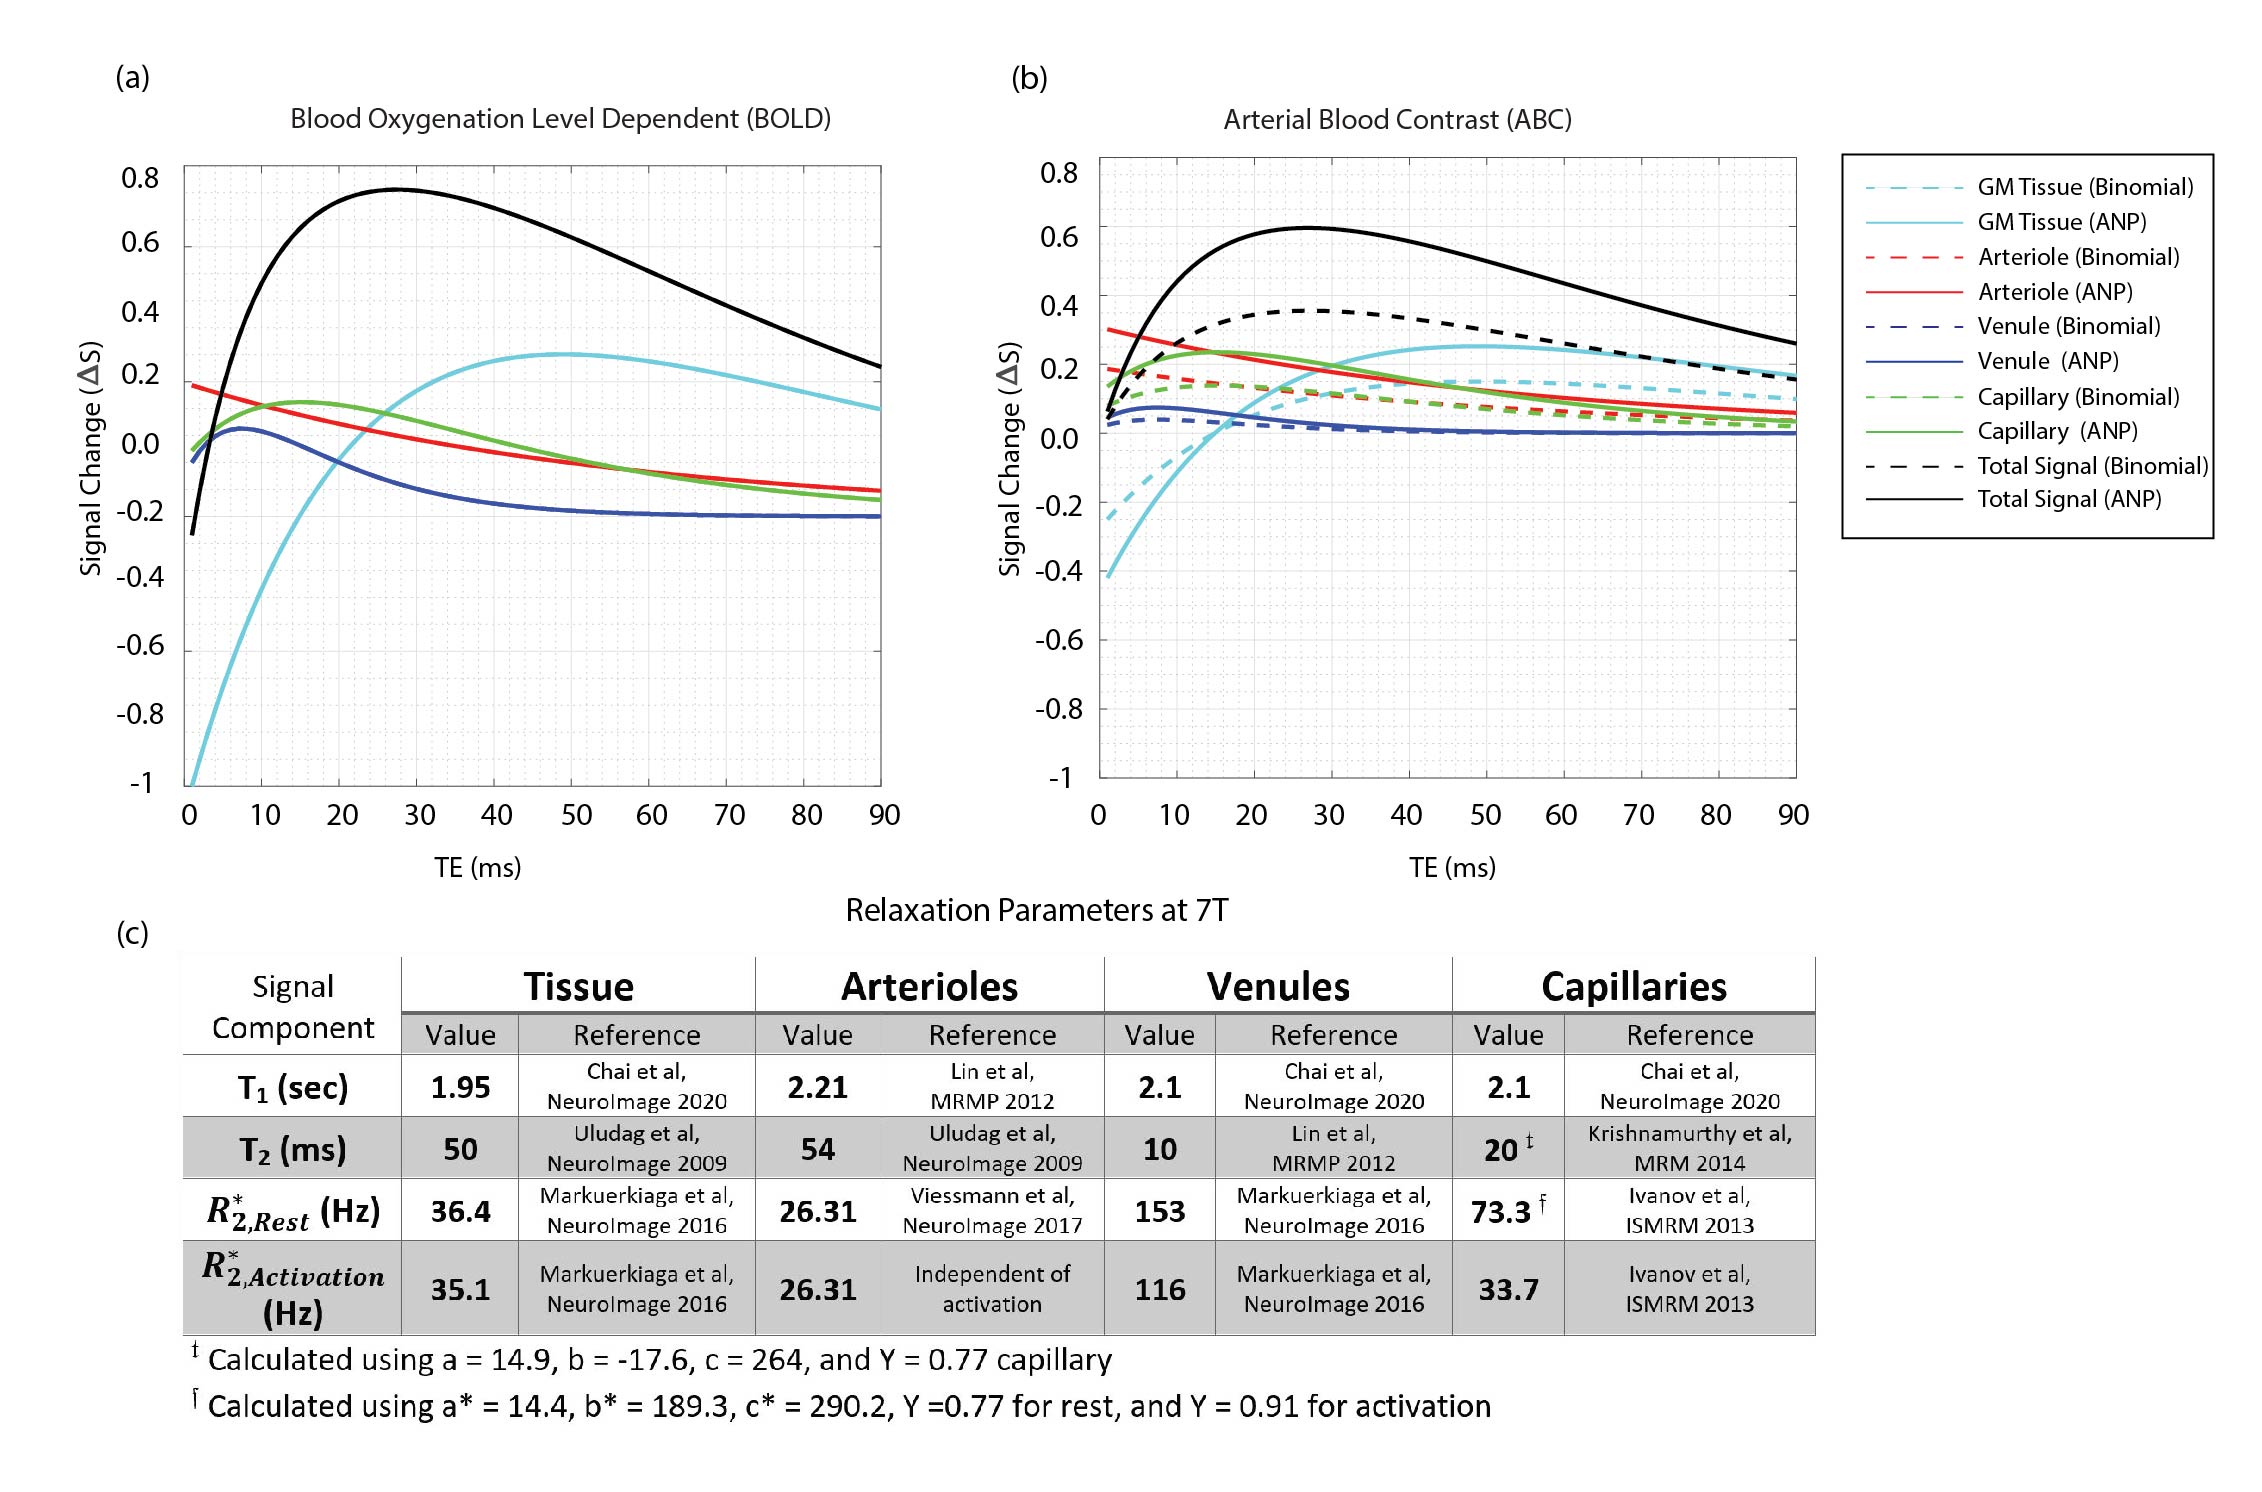
To accurately calculate the Mi values, we numerically simulated the Bloch-McConnell equations using the simulator provided in [7]. We simulated the steady-state magnetization of the parenchymal components in our previously performed experiment [4]. We compared the effect of two MT pulses (figure 1). The parameters used in the simulation were as follows: MT: comparing i) a binomial MT block consisting of two non-selective on-resonance binomial RF pulses with phase swap (6ms) with ii) an on-resonance ANP TR-FOCI pulse, with the phase being reversed at the mid-point of the phase modulation function (6ms) to yield zero flip at the end of the RF pulse time course. The MT block is followed by a 3-ms random spoiler. GM bound pool: is characterized by T2 = 11 μs, Kab = 2.4 Hz, T1 = 1 sec, and the pool size fraction of fb = M0b/M0a = 0.072 [6]. Pulse sequence: two measurement volumes (assuring that MT is built-up) with 30 slices per volume. TRvolume/TRslice =2s/66ms, and flip angle of 50 . We introduced τ, as the time between two successive MT pulses in an imaging volume, and deployed the high power of ANP to apply it less often ( τ= 2*TRslice) than the binomial block (τ = TRslice). Physiological: the volume fractions at rest were 0.945 (tissue), 0.0116 (arteriole), 0.0253 (venule), and 0.0181 (capillary) [9]. We assumed a 30% increase in volume fraction for the vasculature upon activation. The fractional water content, independent of activation, is 0.89 (tissue) and 0.87 (blood) [10]. The field-strength-dependent relaxation parameters are reported in tables in figures 3 and 4. The signal change upon activation is given by:
ΔS(TE) = ∑(i=1:4)xi,actMi,actexp(-R2i,act*TE) - ∑(i=1:4)xi,restMi,restexp(-R2i,rest*TE)
Results
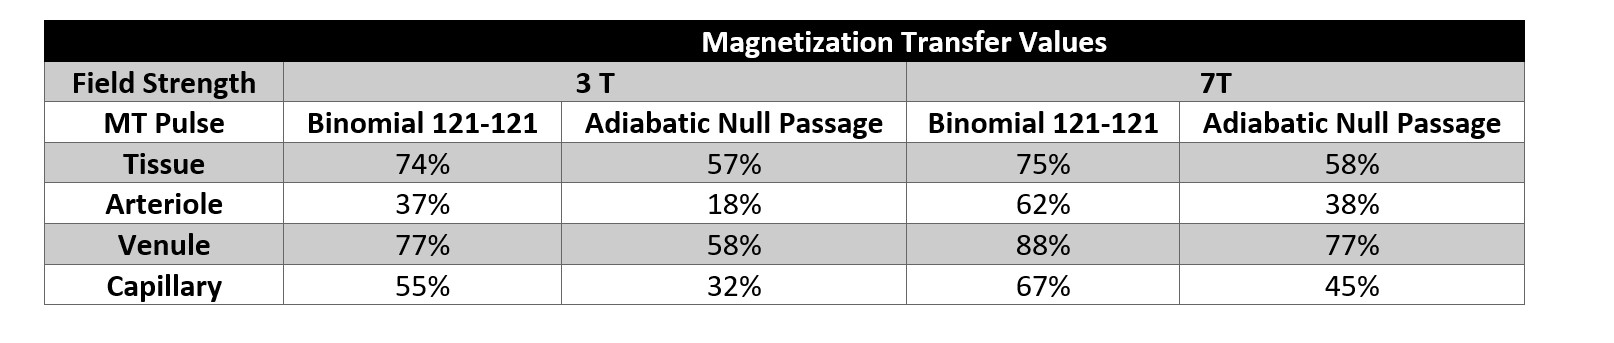
The simulations and modeling were performed at 3T and 7T with identical physiological parameters. The magnetization transfer ratios (MTR) were reported in figure 2. The signal change diagrams are shown for 3T(figure3) and 7T(figure4). Considering the ideal echo time for ABC (TE = 0), the signal change in figure 3-b (red plot: dashed (ANP) vs solid (binomial)) shows that ANP MT increased the arterial component contribution to the total signal change from 32% to 42%. Figure 4 suggests that although this increase of arterial blood contrast is from 18% to 30% when we use ANP instead of binomial at 7T, however, there is low sensitivity for ABC at 7T.Discussion
To the best of our knowledge, among fMRI signal modeling studies [11, 12], this is the first to consider the MT effect. Using binomial MT, the blood components showed higher MTR values than expected [13] due to the T2-relaxation, which manifests as a contamination of the desired ABC by T2. The ANP pulse has a high power which allowed us to apply it less often in comparison with the binomial decreasing this T2 contamination. Figures 3 and 4 showed that the ANP pulse increases the specificity of the eventual ABC contrast to the arterioles and is less affected by the imperfections of the RF hardware.Acknowledgements
No acknowledgement found.References
1. Ogawa, S., et al., Oxygenation‐sensitive contrast in magnetic resonance image of rodent brain at high magnetic fields. Magnetic Resonance in Medicine, 1990. 14(1): p. 68-78.
2. Boxerman, J.L., et al., MR contrast due to intravascular magnetic susceptibility perturbations. Magnetic resonance in medicine, 1995. 34(4): p. 555-566.
3. Lu, H., et al., Functional magnetic resonance imaging based on changes in vascular space occupancy. Magnetic Resonance in Medicine: An Official Journal of the International Society for Magnetic Resonance in Medicine, 2003. 50(2): p. 263-274.
4. Schulz, J., et al., Arterial blood contrast (ABC) enabled by magnetization transfer (MT): a novel MRI technique for enhancing the measurement of brain activation changes. bioRxiv, 2020.
5. S Abbasi-Rad, D.N. Bloch-McConnell Simulation for Arterial Blood Contrast @ 3T and 7T. in Organization for Human Brain Mapping. 2022. Glasgow, Scotland.
6. Sled, J.G., and G.B. Pike, Quantitative imaging of magnetization transfer exchange and relaxation properties in vivo using MRI. Magnetic Resonance in Medicine, 2001. 46(5): p. 923-931.
7. Zaiss, M., et al., A combined analytical solution for chemical exchange saturation transfer and semi‐solid magnetization transfer. NMR in Biomedicine, 2015. 28(2): p. 217-230.
8. Li, J.G., S.J. Graham, and R.M. Henkelman, A flexible magnetization transfer line shape derived from tissue experimental data. Magnetic resonance in medicine, 1997. 37(6): p. 866-871.
9. Chai, Y., et al., Integrated VASO and perfusion contrast: A new tool for laminar functional MRI. NeuroImage, 2020. 207: p. 116358.
10. Lu, H., et al., Sustained poststimulus elevation in cerebral oxygen utilization after vascular recovery. Journal of Cerebral Blood Flow & Metabolism, 2004. 24(7): p. 764-770.
11. Markuerkiaga, I., et al., Estimation of laminar BOLD activation profiles using deconvolution with a physiological point spread function. Journal of neuroscience methods, 2021. 353: p. 109095.
12. Akbari A, B.S., Ali TS, Barth M, Modelling the depth-dependent VASO and BOLD responses in human primary visual cortex. Human Brain Mapping, 2022.
13. Stanisz, G.J., et al., T1, T2 relaxation and magnetization transfer in tissue at 3T. Magnetic Resonance in Medicine, 2005. 54(3): p. 507-512.
Figures