3285
Optimization and validation of Creatine- and Glutamate-CEST weighted imaging in the human brain at 7T1Department of Radiology, Leiden University Medical Center, Leiden, Netherlands, 2Medical Delta Cancer Diagnostics 3.0, South-Holland, Netherlands, 3Philips Healthcare, Best, Netherlands
Synopsis
Keywords: CEST & MT, High-Field MRI
Amine chemical exchange saturation transfer (CEST) is highly sensitive for imaging metabolites in vivo. However, it lacks specificity. We aimed to develop and validate optimal CEST protocols to image creatine and glutamate in the human brain at 7T. Simulations were used to define optimal acquisition parameters, followed by in vitro validation. The optimal B1rms and total saturation (tsat) parameters were determined for creatine (B1rms = 2.5μT & tsat = 1500ms) and glutamate (B1rms = 3.5μT & tsat = 1000ms). These protocols were then used in healthy volunteers to investigate the correlation of glutamate- and creatine-weighted CEST with magnetic resonance spectroscopy results.Introduction
Chemical exchange saturation transfer (CEST) provides high sensitivity to non-invasively image metabolites and proteins in vivo. Different CEST pools have been explored to image the human brain, in both healthy and pathological states1. For instance, the CEST signal at 2ppm and 3ppm obtained from the fast exchanging amine protons has received attention due to their presence in creatine and glutamate2,3. Both these metabolite pools are present in the healthy brain, and their involvement in pathologies such as brain tumors and epilepsy have been shown3,4. Given the overlapping CEST effects at 2ppm and 3ppm and similar exchange rate properties, acquiring CEST images sensitive to only one of the amine pools can be challenging. The aim of this study was to develop optimal CEST imaging parameters to differentiate the amine CEST-pools at 2ppm and 3ppm at 7T and validate these measurements through comparison with the gold-standard, magnetic resonance spectroscopy (MRS).Methods
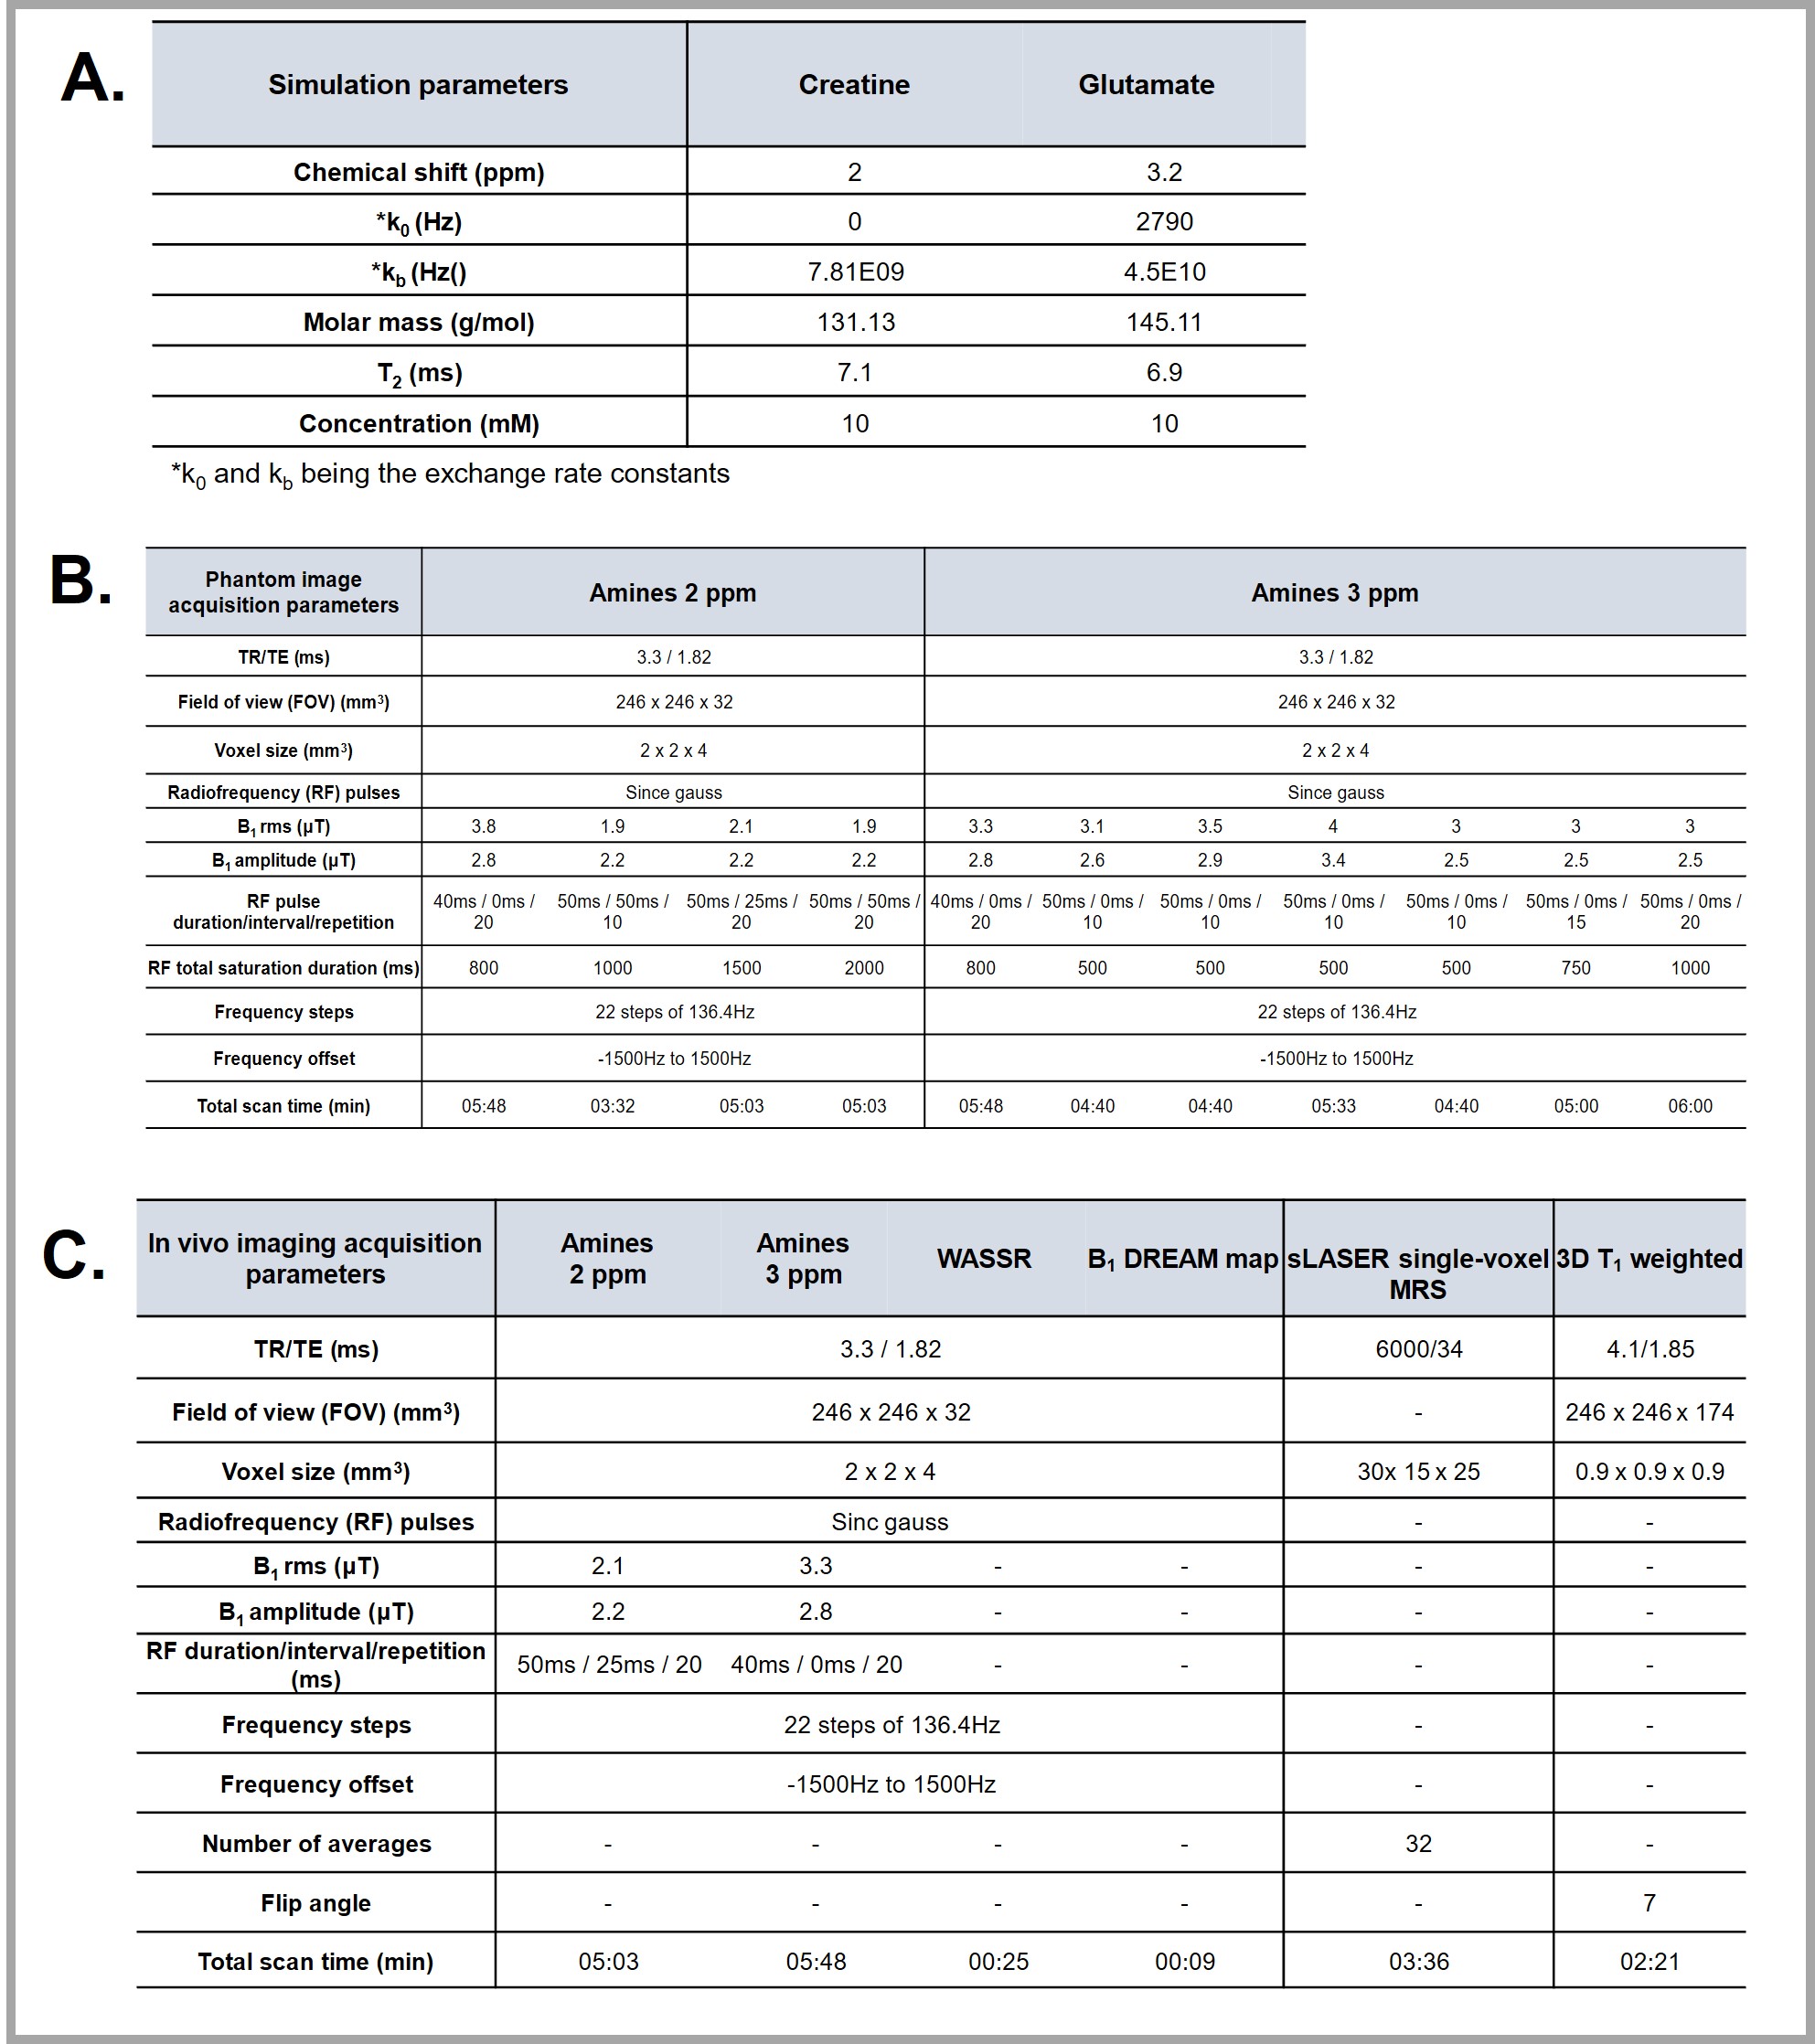
SimulationsWe used Bloch-McConnell equations to simulate a 2-pool model to determine optimal acquisition parameters of individual solute pools of creatine and glutamate. Parameters can be found in Table1A.
Hardware and image acquisition
All scans were performed on a 7T-MRI scanner (Philips Achieva, Best, The Netherlands). Image acquisition protocol and parameters can be found in Table1B/1C.
Phantom
A phantom was prepared using 4 vials filled with creatine and other 4 with glutamate solutions with the following concentrations: 5, 10, 20 and 20mM. Solutions were titrated to reach a pH of 7.3 and scans were repeated at room temperature (~21°C), 28°C and body temperature (~ 36°C). CEST scans were performed for a range of tsat and B1rms values. Regions of interest (ROI) were delineated in each sample for analysis.
In vivo
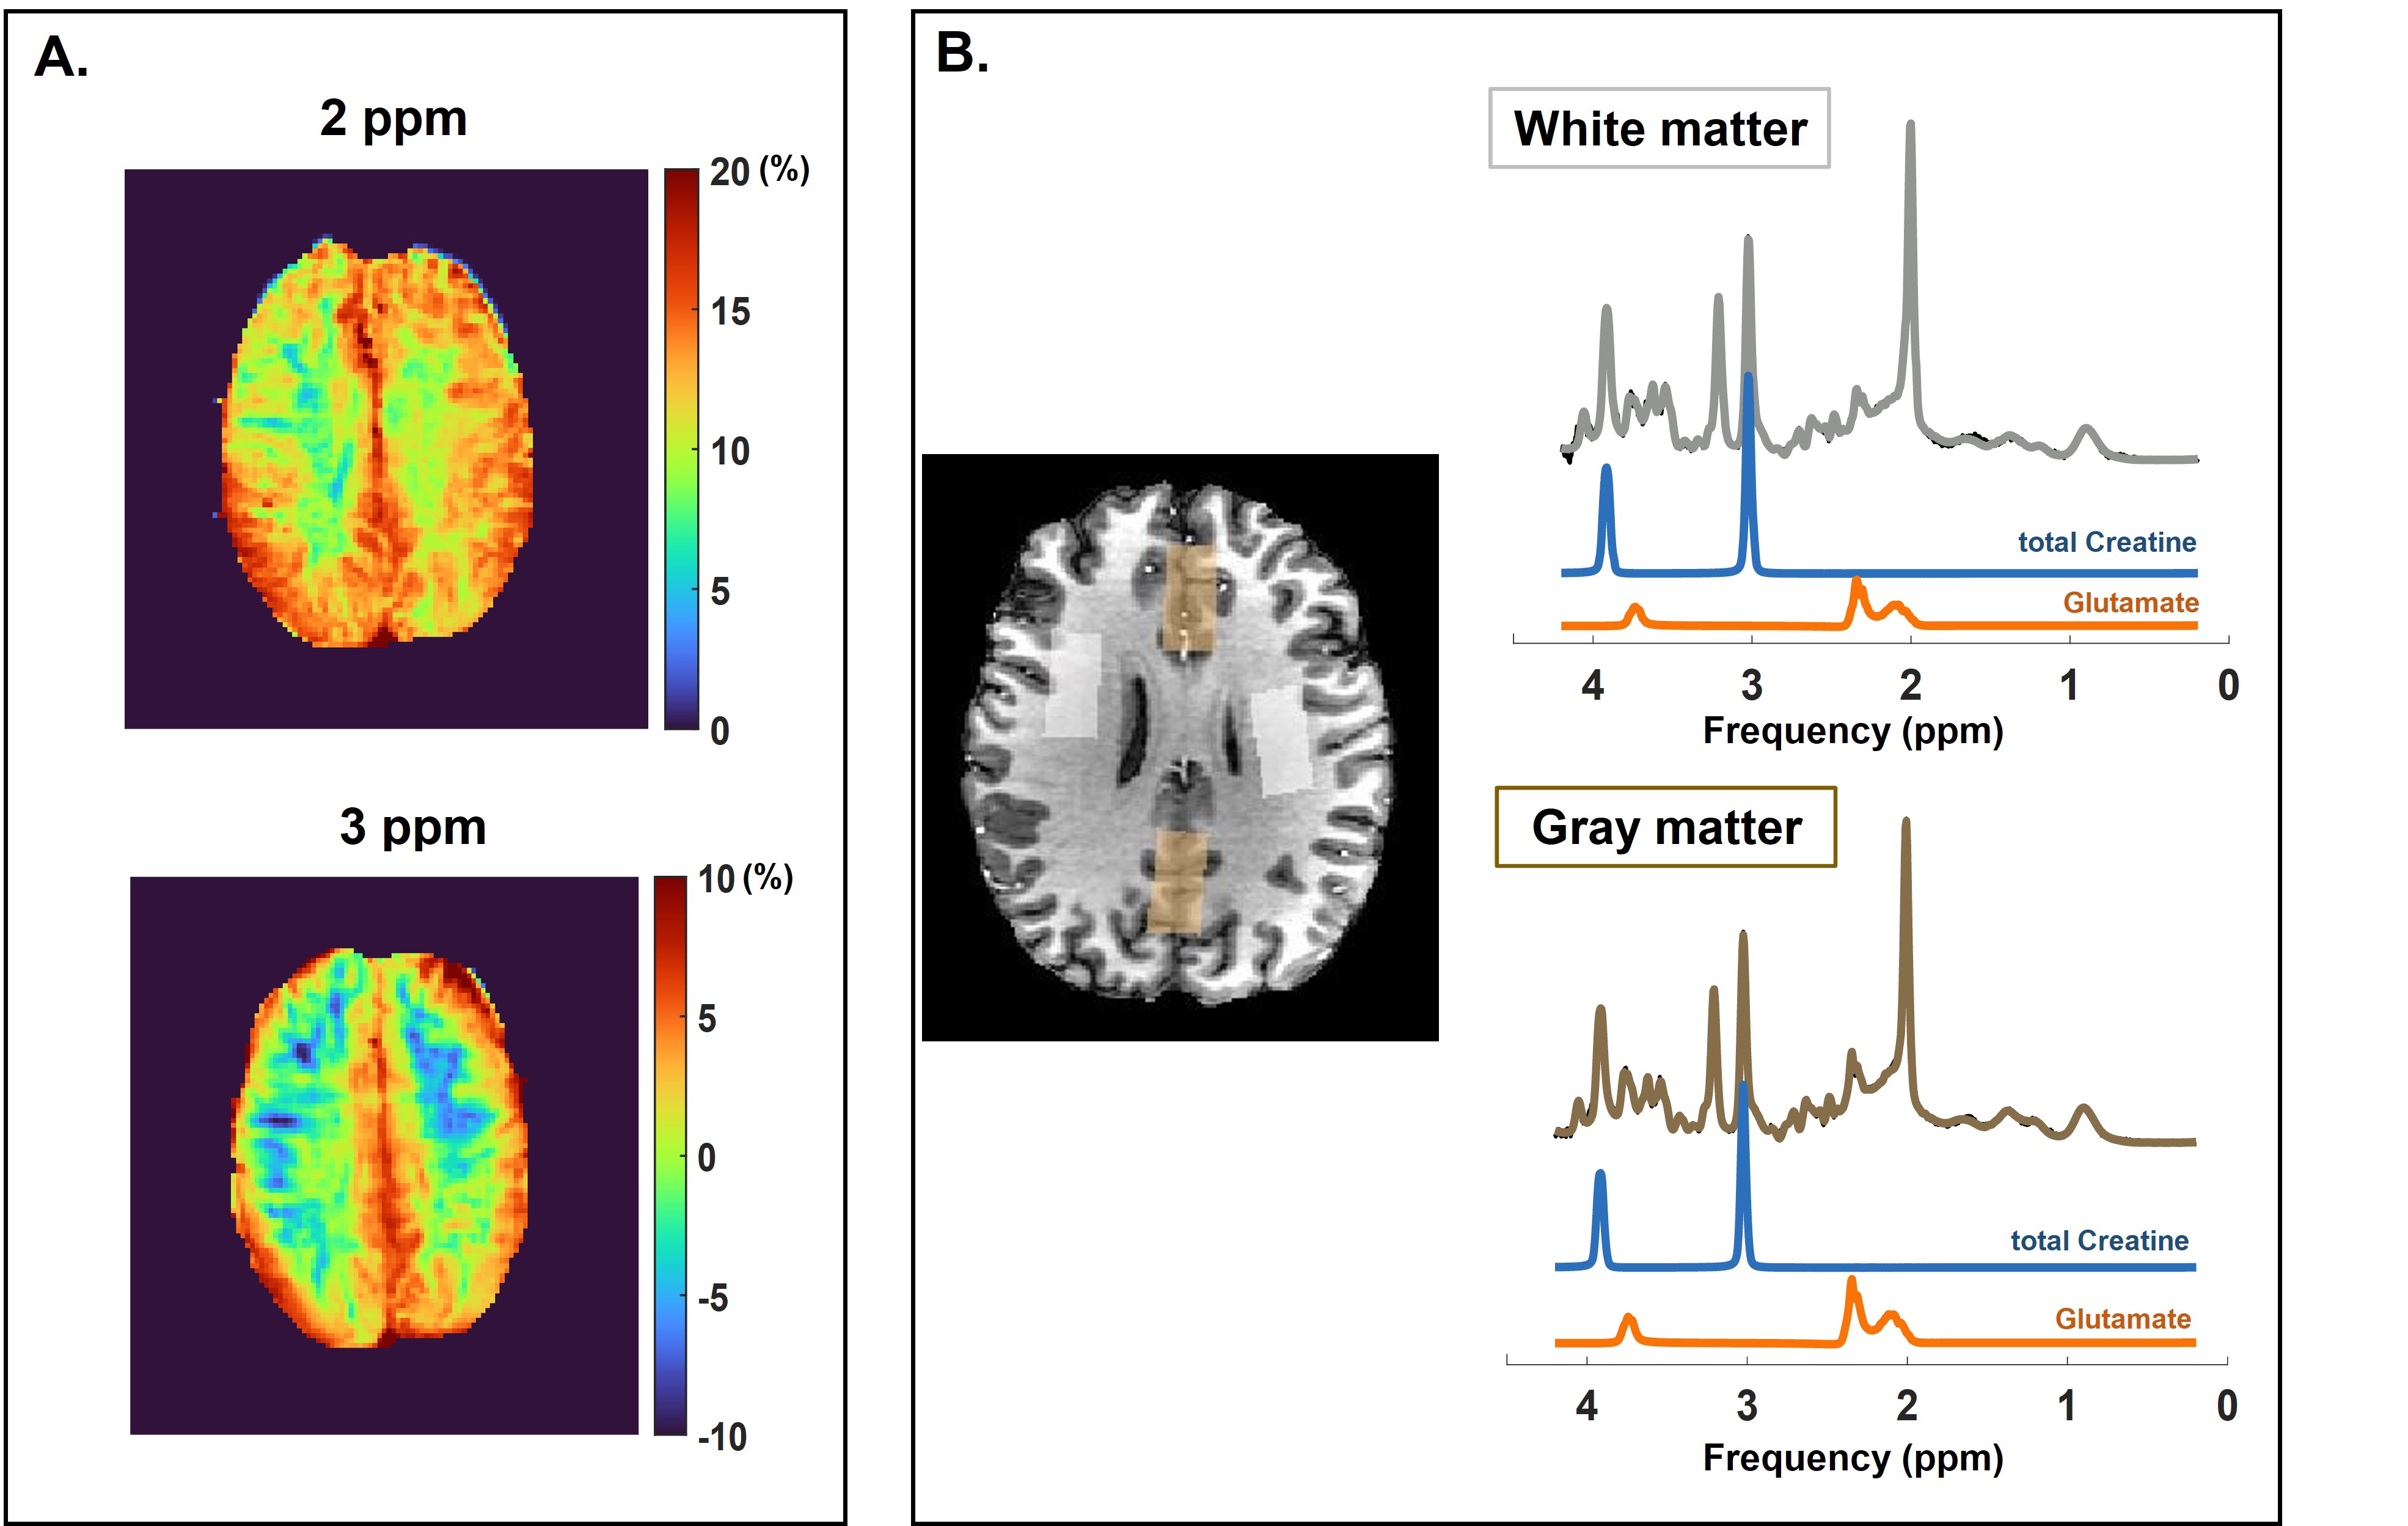
Six healthy volunteers were scanned (1 male/5 females: average age: 31 ± 17) following local IRB regulations. Anatomical scans the optimized creatine- and glutamate-weighted-CEST scans and single-volume MRS measurements from 4 volume-of-interests (VOIs) were performed. Figure3B shows an example of VOIs positioning. The 4 VOIs were then used as masks to retrieve the average CEST contrast in the same area.
Data post-processing and analysis
CEST: CEST images from both in vitro and in vivo data were corrected for B0 inhomogeneities using WASSR and for B1 inhomogeneities with a linear correction using a B1 map5. CEST Z-Spectra and MTRasymmetry were calculated for each VOI from the in vivo data and manually drawn regions of interest (ROI) from the phantom data, for amine pools at 2ppm and 3ppm separately: MTRasym = $$$\frac{Z(-x) ppm -Z(x)ppm}{Z(-x)ppm}$$$
MRS: MRS spectra were corrected for eddy-currents and frequency-drift using an in-house MATLAB pipeline. A basis-set was created using FID-A toolbox and spectra fitted with LCModel6,7. The final concentrations were calculated considering metabolites T1 and T2 and the fraction of gray matter (GM), white matter (WM) and cerebral spinal fluid (CSF) present in each VOI8.
Results and discussion
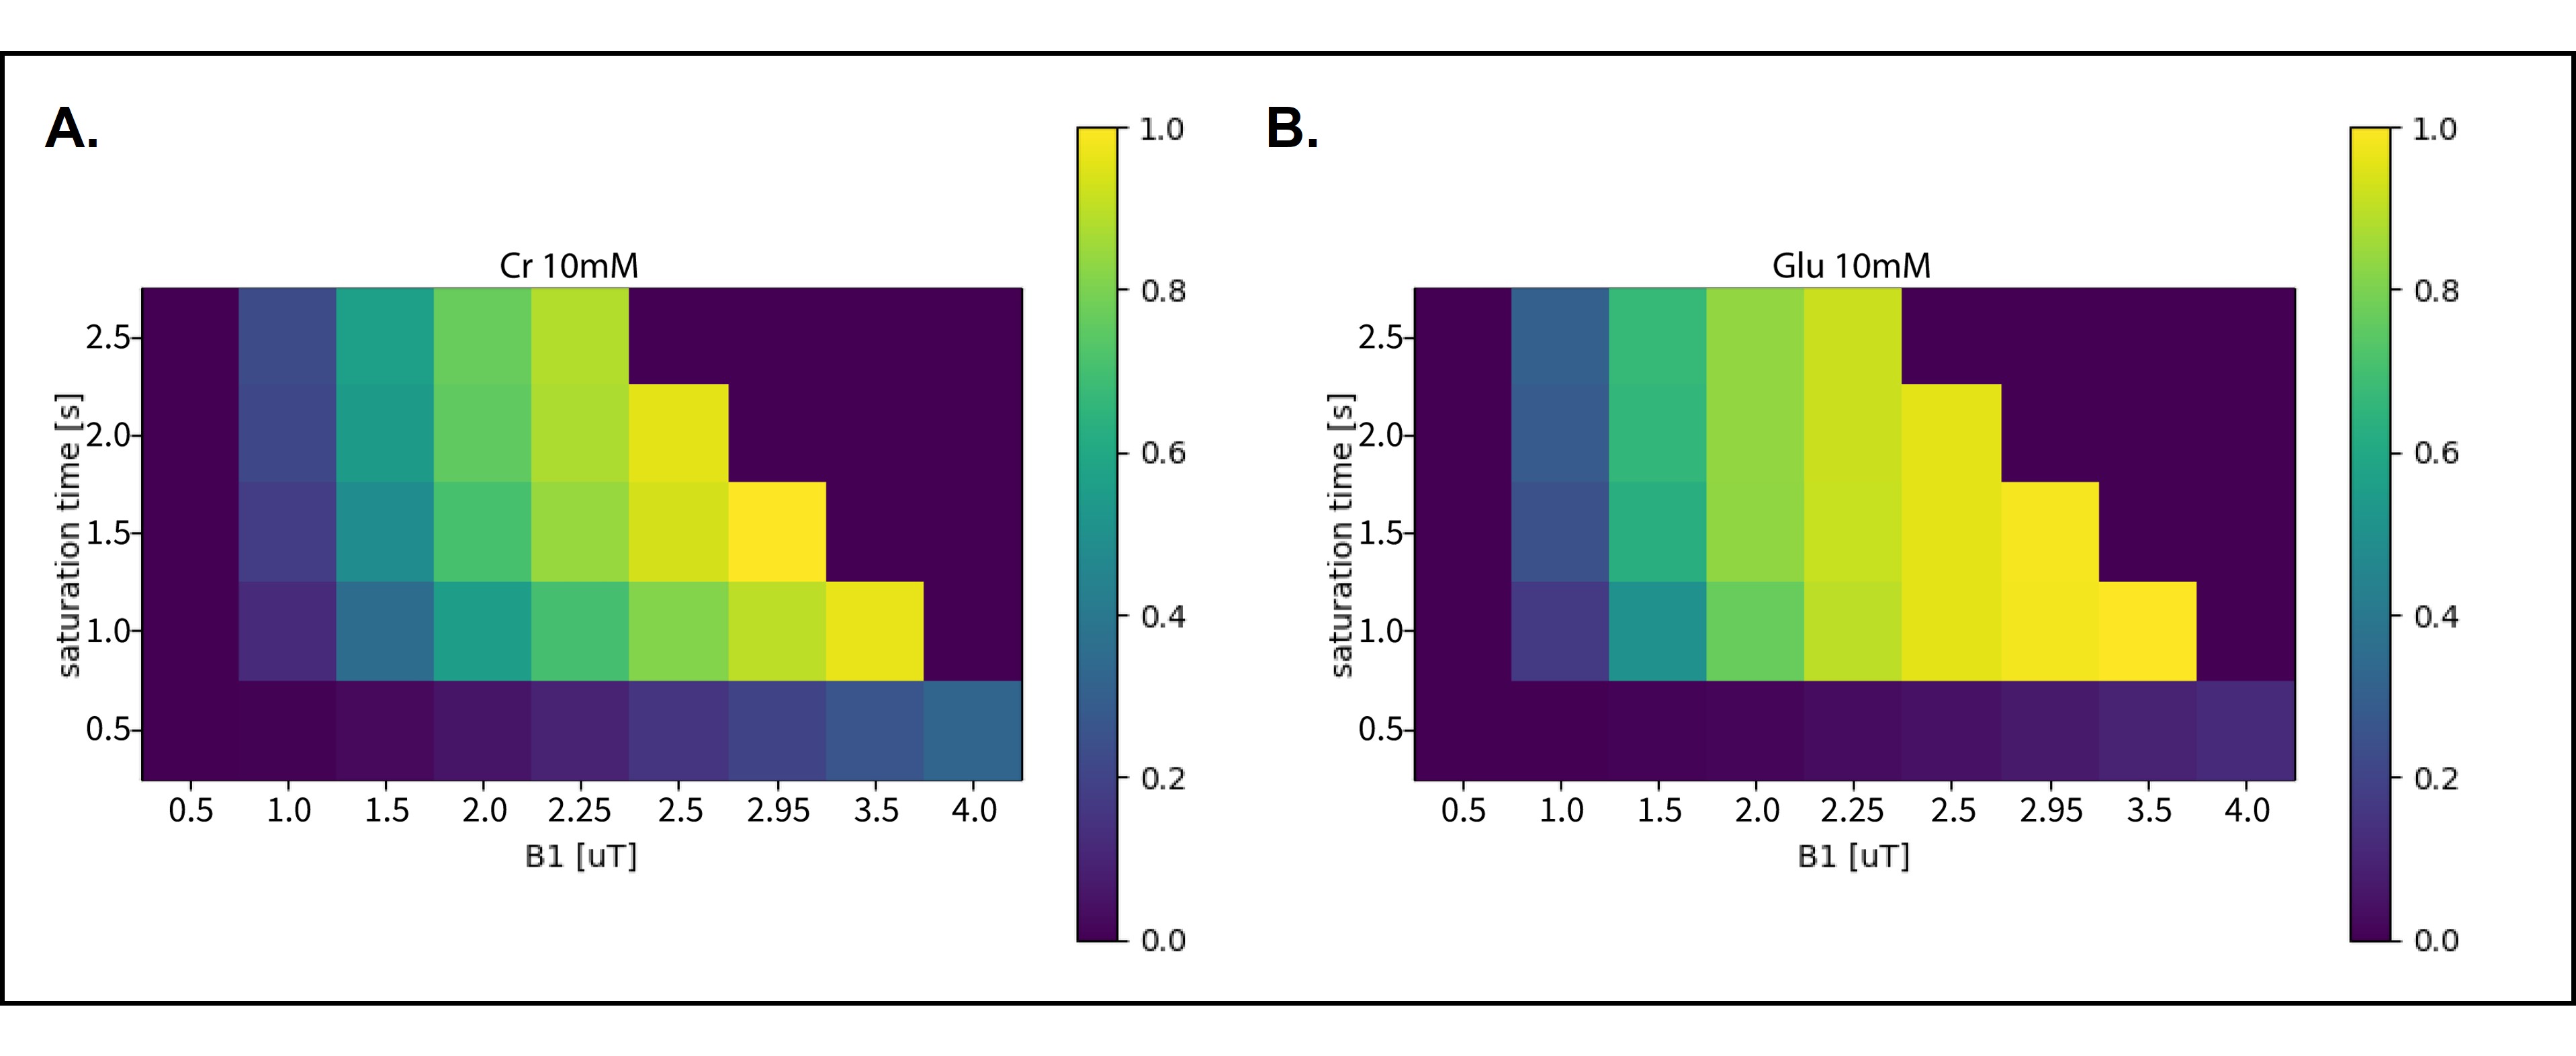
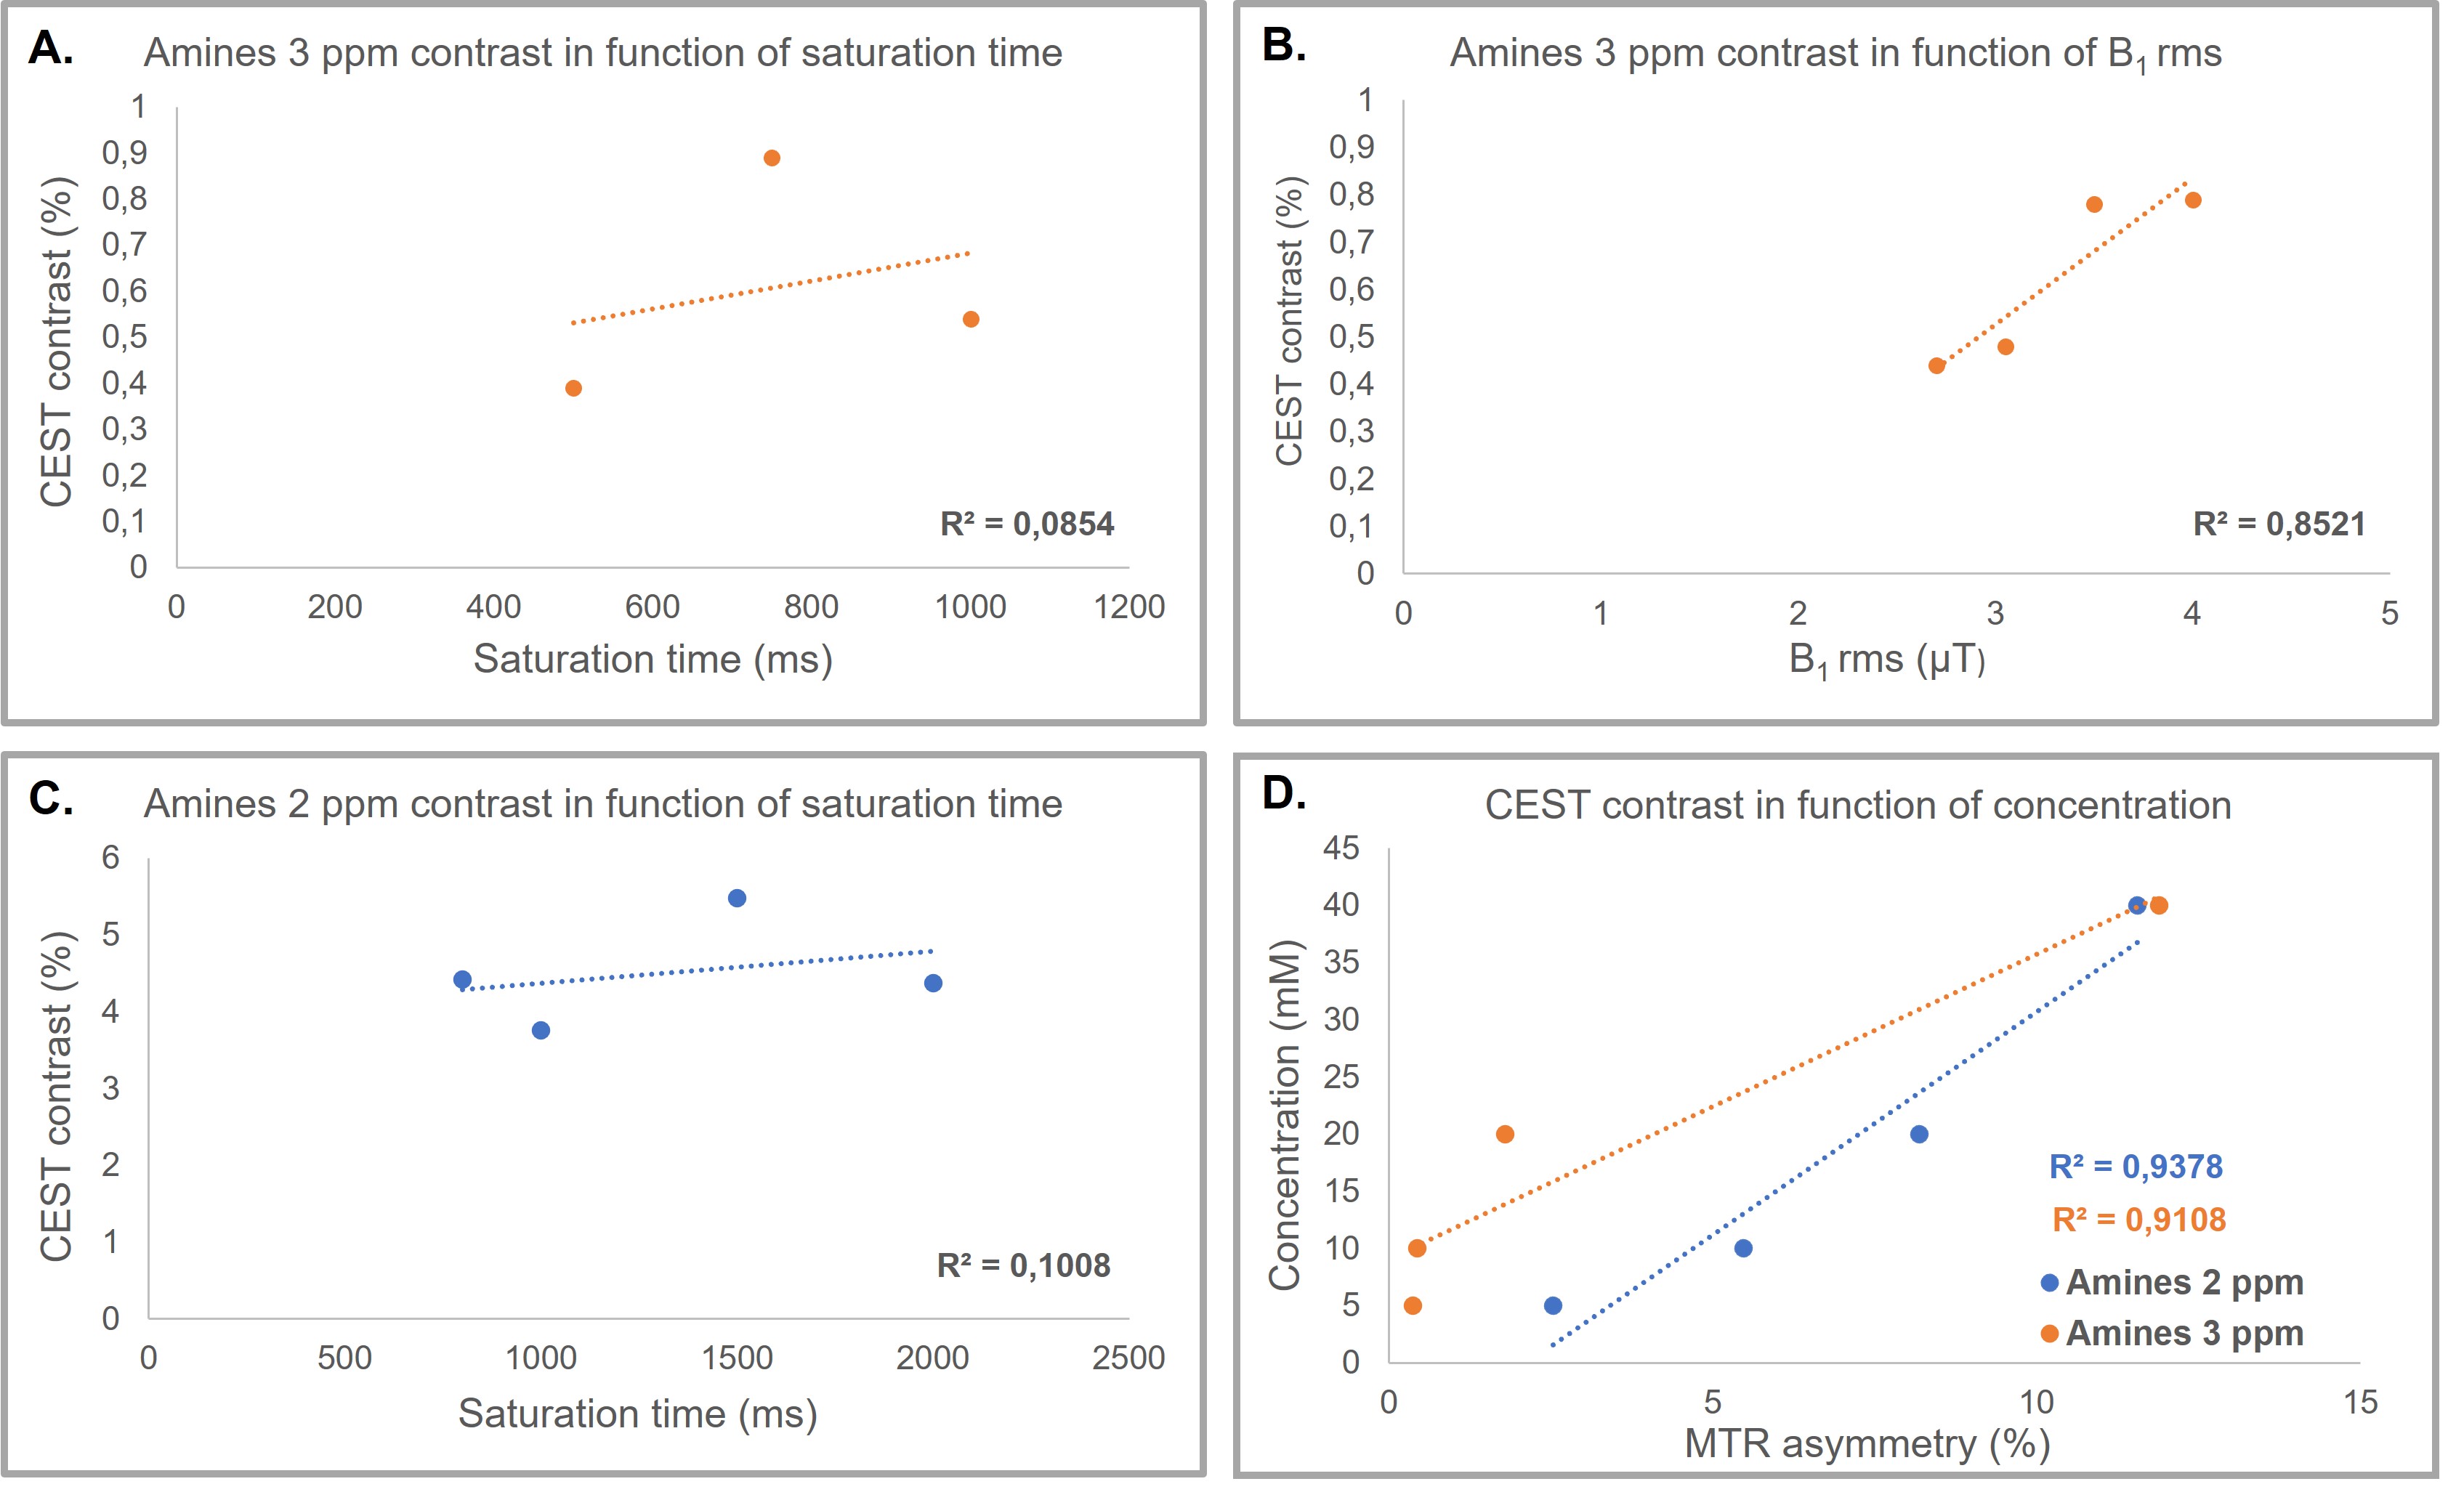
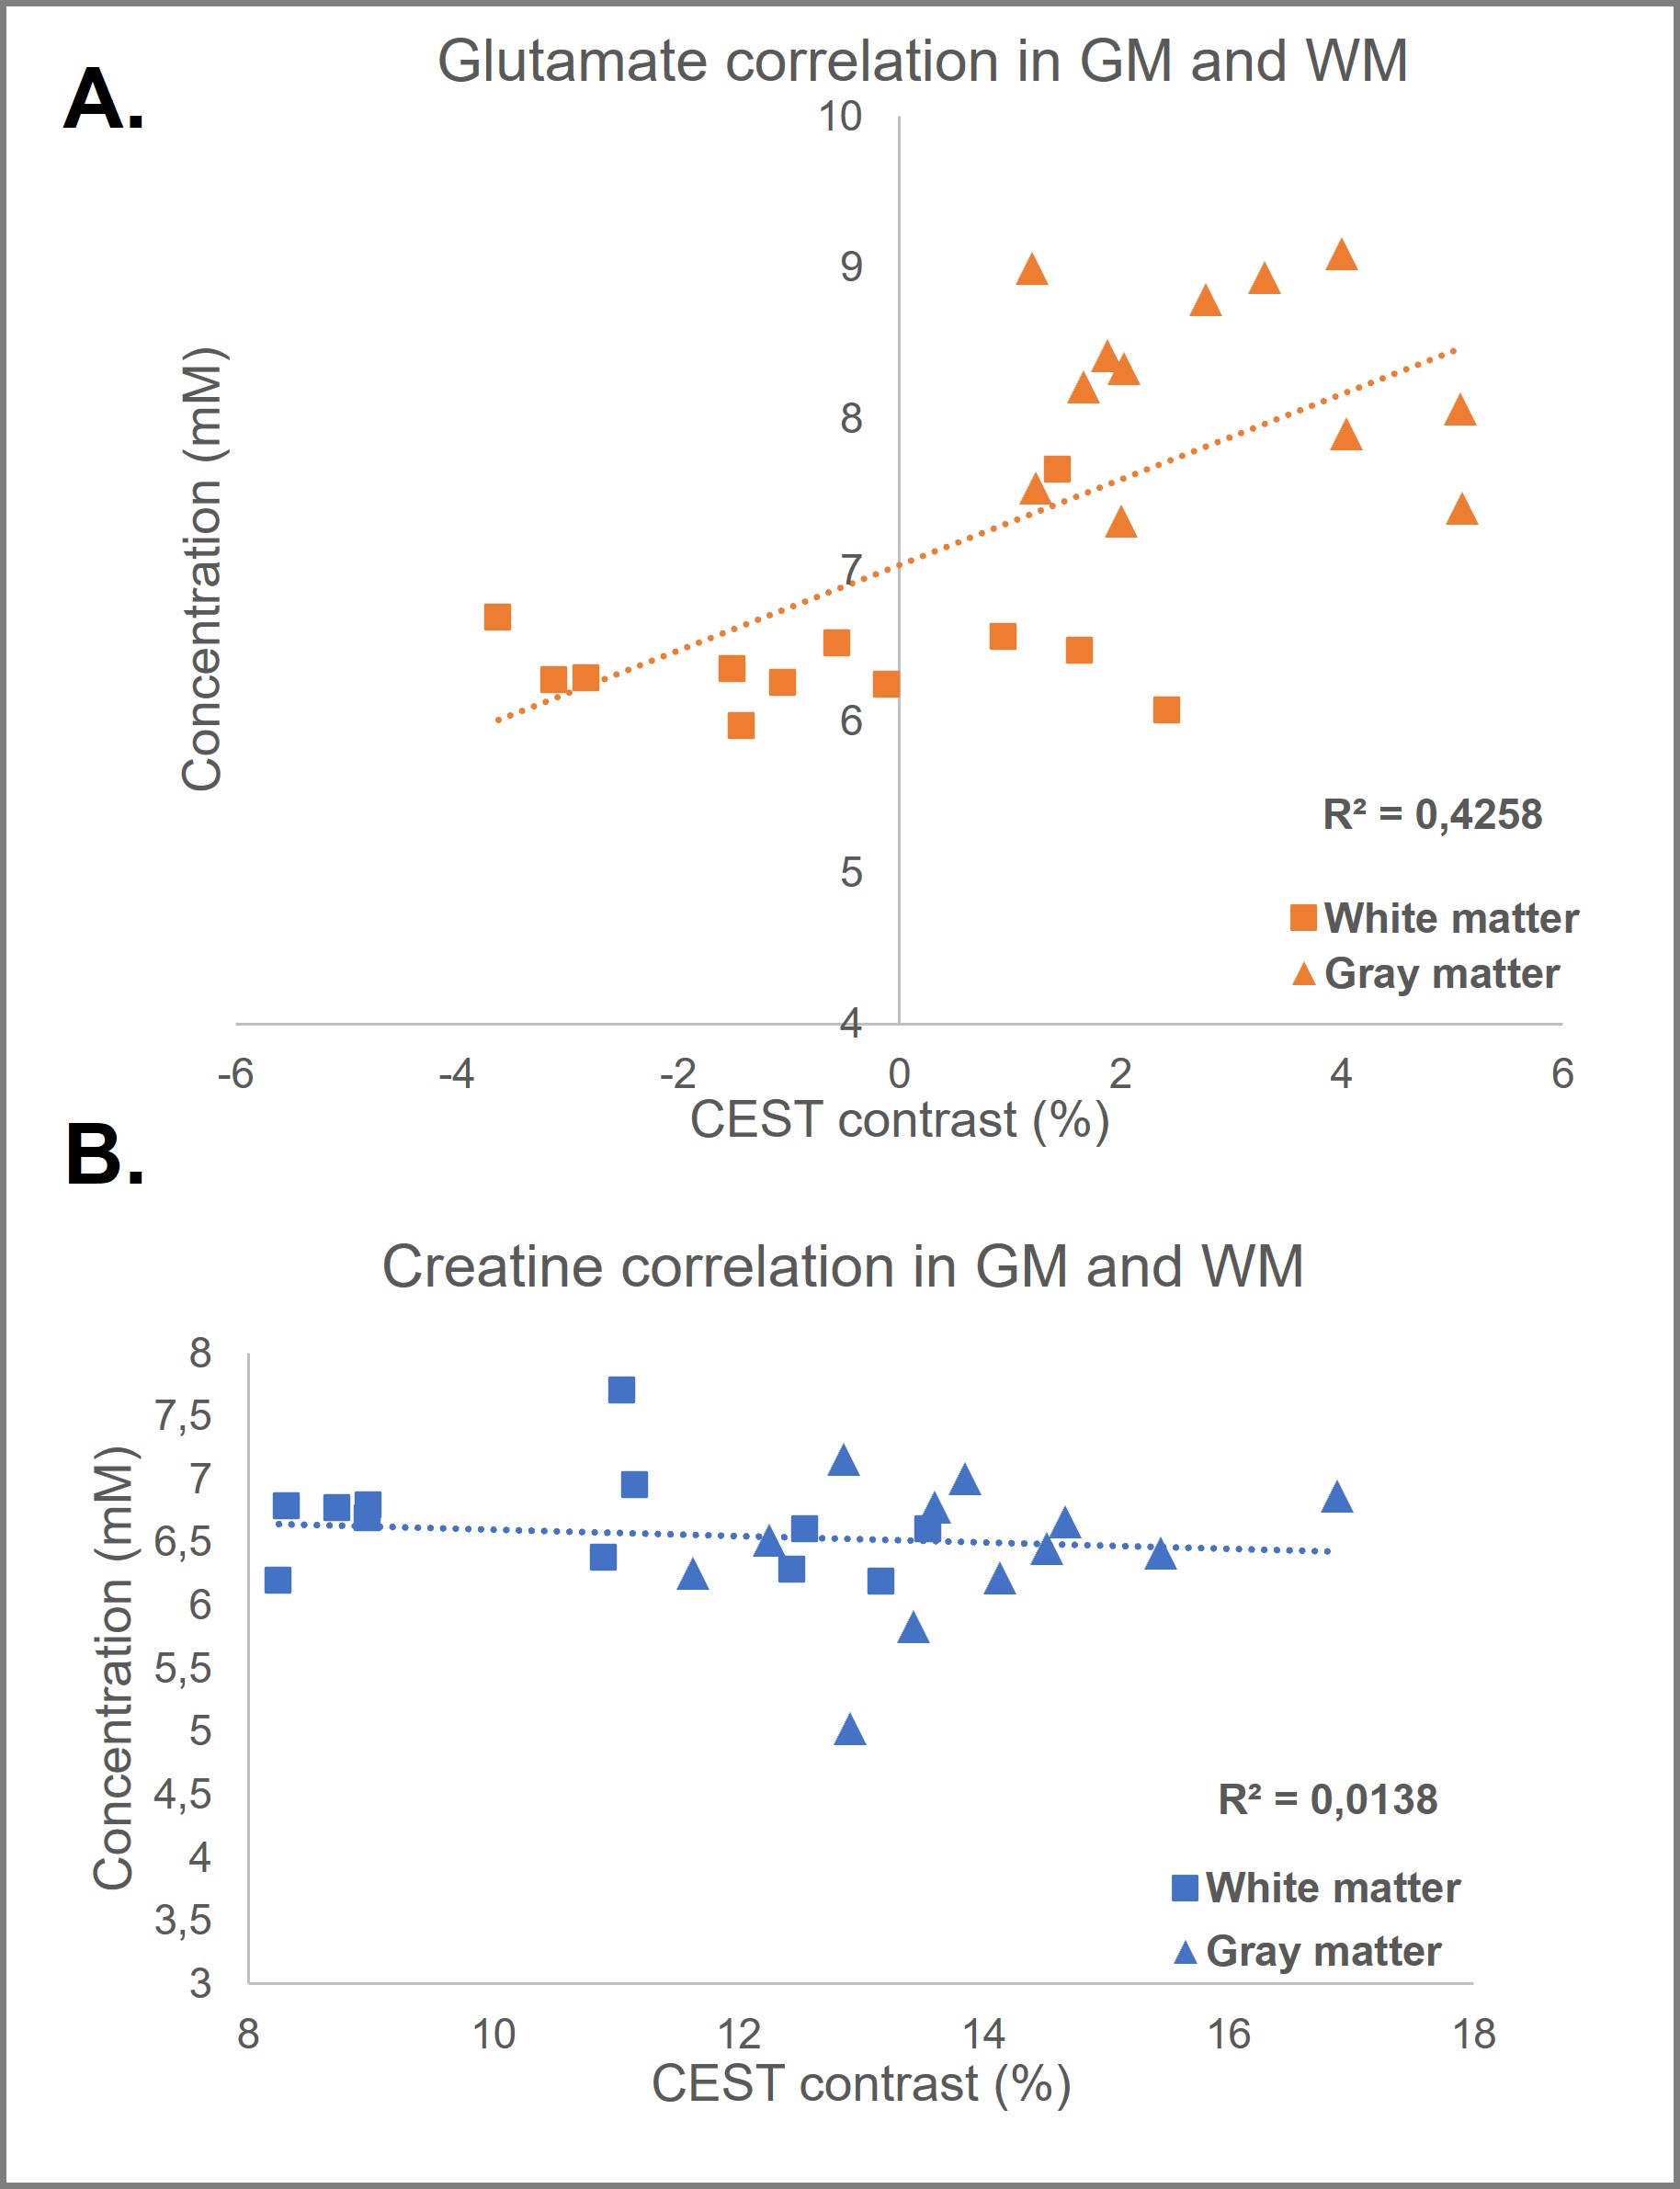
Figure 1A and 1B illustrate the simulated CEST maps for creatine (pool at 2ppm) and glutamate (pool at 3ppm) with concentrations similar to those found in the human brain. From our simulations, maximum creatine- and glutamate-weighted-CEST contrast was obtained with the following combinations: B1rms = 2.5µT and tsat = 1500ms for creatine-weighted-CEST and B1rms = 3.5μT and tsat = 1000ms for glutamate-weighted-CEST. Figure2A and 2B show that MTRasymmetry values at 3ppm changed as a function of tsat and B1rms, confirming that an intermediary tsat of 750ms and a B1rms of 3.3μT yield optimum values. Similarly, figure2C shows that MTRasymmetry values at 2ppm reach a maximum at tsat 1500ms. Figure2D shows MTRasymmetry values obtained at 2ppm and 3ppm correlate linearly with varying metabolite concentrations of creatine and glutamate in vitro. MTRasymmetry were lower for glutamate- compared to creatine-weighted CEST, regardless of concentration. When looking at changes with temperature (results not shown), MTRasymmetry values for glutamate decreased with increased temperature. This suggests that temperature has an effect on glutamate-weighted CEST contrast, similarly, as previously reported9. Figure3A shows an example of CEST maps for amine pools at 2ppm and 3ppm, where the contrast between gray and white matter can be clearly differentiated. The resulting MR spectra from one voxel in the GM and WM are displayed in figure3B. Smaller differences are seen in total creatine (tCr) between both tissue types (Mean in GM: 6.4mM±0.6; Mean in WM: 6.6mM±0.4), compared to glutamate (Mean in GM: 8.3mM±0.6, Mean in WM: 6.7±0.4). Figure4 shows correlation of metabolite concentrations from GM and WM with the corresponding MTR asymmetry values. Figure4A shows a linear correlation for glutamate concentration and CEST contrast at 3ppm. On the other hand, no correlation was found between tCr and CEST contrast at 2ppm (Figure4B). This could be due to the contribution of both creatine and phosphocreatine to the MRS signal in comparison to CEST contrast at 2ppm being mostly sensitive to creatine.Conclusion
In conclusion, we optimized CEST acquisition protocols based on simulations and validated them through in vitro scans from creatine and glutamate phantoms. In healthy volunteers, the CEST contrast at 3ppm showed a moderate correlation with glutamate concentration. On the other hand, no correlation was found for creatine in vivo. Future works includes extending this study to a larger group of subjects and investigating these protocols in pathology.Acknowledgements
No acknowledgement found.References
1.van Zijl PCM, Lam WW, Xu J, Knutsson L, Stanisz GJ. Magnetization Transfer Contrast and Chemical Exchange Saturation Transfer MRI. Features and analysis of the field-dependent saturation spectrum. Neuroimage. 2018;168(April 2017):222-241. doi:10.
2.Cai K, Singh A, Roalf DR, et al. Mapping glutamate in subcortical brain structures using high-resolution GluCEST MRI. NMR Biomed. 2013;26(10):1278-1284. doi:10.1002/nbm.29491016/j.neuroimage.2017.04.045
3.Cai K, Singh A, Poptani H, et al. CEST signal at 2ppm (CEST at 2ppm) from Z-spectral fitting correlates with creatine distribution in brain tumor. NMR Biomed. 2015;28(1):1-8. doi:10.1002/nbm.3216
4.Neal A, Moffat BA, Stein JM, et al. Glutamate weighted imaging contrast in gliomas with 7 Tesla magnetic resonance imaging. NeuroImage Clin. 2019;22(June 2018):101694. doi:10.1016/j.nicl.2019.101694
5.Kim M, Gillen J, Landman BA, Zhou J, Peter CM. Exchange Saturation Transfer Experiments. 2010;61(6):1441-1450. doi:10.1002/mrm.21873.Water
6.Simpson R, Devenyi GA, Jezzard P, Hennessy TJ, Near J. Advanced processing and simulation of MRS data using the FID appliance (FID-A)—An open source, MATLAB-based toolkit. Magn Reson Med. 2017;77(1):23-33. doi:10.1002/mrm.26091
7.Provencher SW. Estimation of metabolite concentrations from localized in vivo proton NMR spectra. Magn Reson Med. 1993;30(6):672-679. doi:10.1002/mrm.1910300604
8.Marjańska M, Auerbach EJ, Valabrègue R, Van de Moortele PF, Adriany G, Garwood M. Localized 1H NMR spectroscopy in different regions of human brain in vivo at 7T: T 2 relaxation times and concentrations of cerebral metabolites. NMR Biomed. 2012;25(2):332-339. doi:10.1002/nbm.1754
9.Wermter FC, Bock C, Dreher W. Investigating GluCEST and its specificity for pH mapping at low temperatures. NMR Biomed. 2015;28(11):1507-1517. doi:10.1002/nbm.3416
Figures