3284
A CEST Z-spectral learning network from 3T to higher B0 field: a simulation-based preliminary study
Mengdi Yan1, Chongxue Bie1, Yibin Chen1, Xiaowei He1, and Xiaolei Song2
1Northwest University, Xi'an, Shanxi, China, 2Tsinghua University, Beijing, China
1Northwest University, Xi'an, Shanxi, China, 2Tsinghua University, Beijing, China
Synopsis
Keywords: CEST & MT, Data Analysis
Z-spectrum acquired under ultra-high field (> 3T) features stronger and better isolated CEST peaks than those under 3T. But from imaging aspect, 3T scanners perform better and are clinically accessible. Herein, we built a deep neural network (DNN) for predicting Z-spectrum under higher B0 from the corresponding measurement at 3T. The network was trained by 10 million Z-spectra calculated from Bloch-equation models. Simulations with various B0 shifts and noise suggested that 3T Z-spectra could be rapidly and accurately transformed to those under 7T or 9.4T. This network may help improve signal extraction and interpretation of CEST data acquired at 3T.Introduction
In vivo Z-spectrum contains multiple signal contributions, including direct water saturation (DS), CEST effects, magnetization transfer contrast (MTC), and nuclear Overhauser effects (rNOEs), presenting as overlapped peaks under clinical field (e.g., 3T)1. High-field static magnetic field facilitates the evaluation of CEST effects due to the well-isolated signal peaks in the Z-spectrum2-4. However, high-field CEST data are difficult to obtain due to equipment limitations, specific absorption rate (SAR)5, and field inhomogeneity.Some recent deep learning methods have been proposed to predict multi-pool Lorentzian parameters under high-field by learning Z-spectrum features under low B0 field6,7. However, only the Lorentzian parameters cannot fully reconstruct a realistic Z-spectrum. Here, we developed a deep neural network (DNN) transformation model to synthesize high-field Z-spectrum from the corresponding realistic low-field data. Bloch-equation simulated datasets under different B0 fields were generated to verify the feasibility of the proposed method.
Methods
CEST Z-spectra were simulated by using a five-pool Bloch-McConnell model, including pools of water, amide, amine, rNOEs, and MTC8. The various combinations of tissue parameters with different concentrations and exchange rates were used to simulate Z-spectra9. The source B0 was 3T, and the target B0 were 7T and 9.4T, respectively. The paired Z-spectra under both low and high B0 fields were generated over ±9.5ppm with 55 frequency offsets, B1 power of 0.7μT. To mimic realistic scenarios, Gaussian white noise with an average of 0 and standard deviation (SD) of 0.35% was added to the 3T data. Additionally, B0 shifts within ±0.25ppm and B1 inhomogeneity within ±0.05μT were randomly introduced to the low B0 field Z-spectra. Finally, a total of 10 million simulated Z-spectra were randomly divided into the training, validation, and test datasets with a ratio of 3:1:1.Figure 1 illustrates the scheme of the proposed DNN-based Z-spectrum transformation model. The Z-spectrum (55 offsets) under low B0 field is inputted to the model, which learns the features of these Z-spectral data and provides the corresponding Z-spectrum under high B0 field. The DNN model used here is a conventional multi-layer perceptron, where the custom-weighted L1-loss (L1W) is the model optimization objective:
$$\mathrm{L1}_W=\sum_{i=1}^n \alpha \cdot\left|y_i-f\left(x_i\right)\right| [1]$$
where n is the frequency offset number, x is the Z-spectrum value under the source field, y is the Z-spectrum value under the target field, f(.) is the model prediction results, and the customized weight factor ɑ = 2 if the frequency offsets are -3.5, -2.0, 0, 2.0, and 3.5ppm, otherwise ɑ = 1.
The performance of the proposed method is evaluated using the representative linear regression task evaluation indexes, including normalized root mean square error (NRMSE) and goodness of fit (R2) between the transformed Z-spectra and ground truth. To further evaluate the accuracy of the transformations, we also used the Z-spectrum analysis methods to quantify the CEST effects, including magnetization transfer ratio asymmetry (MTRasym)10 and Lorentzian difference (LD)11.
Results
Figure 2 shows the representative high B0 field Z-spectra obtained from the corresponding low B0 field Z-spectral data by using the proposed DNN-based Z-spectrum transformation model, including the ground truth. The linear regression evaluation results show R2=0.998, NRMSE=0.010 for 7T transformation, and R2=0.998, NRMSE=0.009 for 9.4T.Results of MTRasym and LD analyses for evaluating the DNN-based transformed 7T and 9.4 T Z-spectra are shown in Figures 3,4. The contrast maps of the DNN-based transformed Z-spectrum under high B0 fields closely resemble the ground truth, with minor differences. Also, the statistical analysis illustrates no significant difference between the DNN-based transformed contrast signals and ground truth. Both present the increment of signal contrast compared with 3T data, except for the LD results at 3.5ppm under 7T. This might be due to the high concentrations of amide proton used in simulations, which can cause an isolated 3.5 ppm peak under 3T. The separation of this peak was not obvious under 7T but became significant at a much higher B0 field (9.4T).
Discussion
The proposed DNN-based Z-spectrum transformation model can extract the features of Z-spectrum under low B0 field and then generate reliable Z-spectral data under high B0 field, allowing to provide well-isolated CEST signals. The isolated CEST peaks in Z-spectrum could be further extracted and quantified with enhanced accuracy by using Z-spectral analysis approaches, such as MTRasym and LD. However, in this work, we only validated the feasibility of the transformation model by using preliminary simulations. In vivo studies need to be further performed. Due to the hard access of high B0 field Z-spectral data, the proposed DNN-based Z-spectrum model provides great opportunities to obtain a good quality high B0 field Z-spectral data without interference of low signal-to-noise ratio (SNR) and field inhomogeneities, facilizing the clinical use of high B0 field CEST data.Conclusion
We developed a DNN-based transformation model to rapidly and accurately synthesize Z-spectrum under high B0 field according to the corresponding low B0 field data. This network may be helpful for improving signal extraction and interpretation of CEST data acquired at 3T, but further validations using phantom or in vivo experiments are required.Acknowledgements
No acknowledgement found.References
- van Zijl PCM, Lam WW, Xu J, Knutsson L, Stanisz GJ. Magnetization Transfer Contrast and Chemical Exchange Saturation Transfer MRI. Features and Analysis of the Field‐Dependent Saturation Spectrum. NeuroImage. 2018;168:222–241.2.
- Zhou J, Lal B, Wilson DA, Laterra J, van Zijl PCM. Amide Proton Transfer (APT) Contrast for Imaging of Brain Tumors. Magn Reson Med. 2003;50:1120–1126.3.
- Jones CK, Huang A, Xu J, et al. Nuclear Overhauser Enhancement (NOE) Imaging in the Human Brain at 7T. NeuroImage. 2013;77:114–124.4.
- Zhang X Y, Xie J, Wang F, et al. Assignment of the molecular origins of CEST signals at 2 ppm in rat brain[4]. Magnetic resonance in medicine, 2017, 78(3): 881-887.5.
- Uematsu H, Takahashi M, Dougherty L, Hatabu H. high-field body MR imaging: preliminary experiences. Clin. Imaging 2004; 28(3): 159–162.6.
- Zaiss M, Deshmane A, Schuppert M, et al. DeepCEST: 9.4 T Chemical exchange saturation transfer MRI contrast predicted from 3 T data – a proof of concept study. Magn Reson Med. 2019;81(6):3901-3914. doi:10.1002/mrm.27690.7.
- Glang F, Fabian M S, German A, et al. Linear projection‐based chemical exchange saturation transfer parameter estimation[4]. NMR in Biomedicine, 2022: e4697.8.
- Zaiss, M. CEST sources, <http://www.cest-sources.org> (2014).9.
- Heo H Y, Lee D H, Zhang Y, et al. Insight into the quantitative metrics of chemical exchange saturation transfer (CEST) imaging[4]. Magnetic resonance in medicine, 2017, 77(5): 1853-1865.10.
- Guivel-Scharen V, Sinnwell T, Wolff SD, Balaban RS. Detection of Proton Chemical Exchange between Metabolites and Water in Biological Tissues. Journal of Magnetic Resonance 1998;133:36–4.11.
- Zaiss M, Schmitt B, Bachert P. Quantitative separation of CEST effect from magnetization transfer and spillover effects by Lorentzian-line-fit analysis of z-spectra. J Magnetic Resonance 2011;211:149-55.
Figures
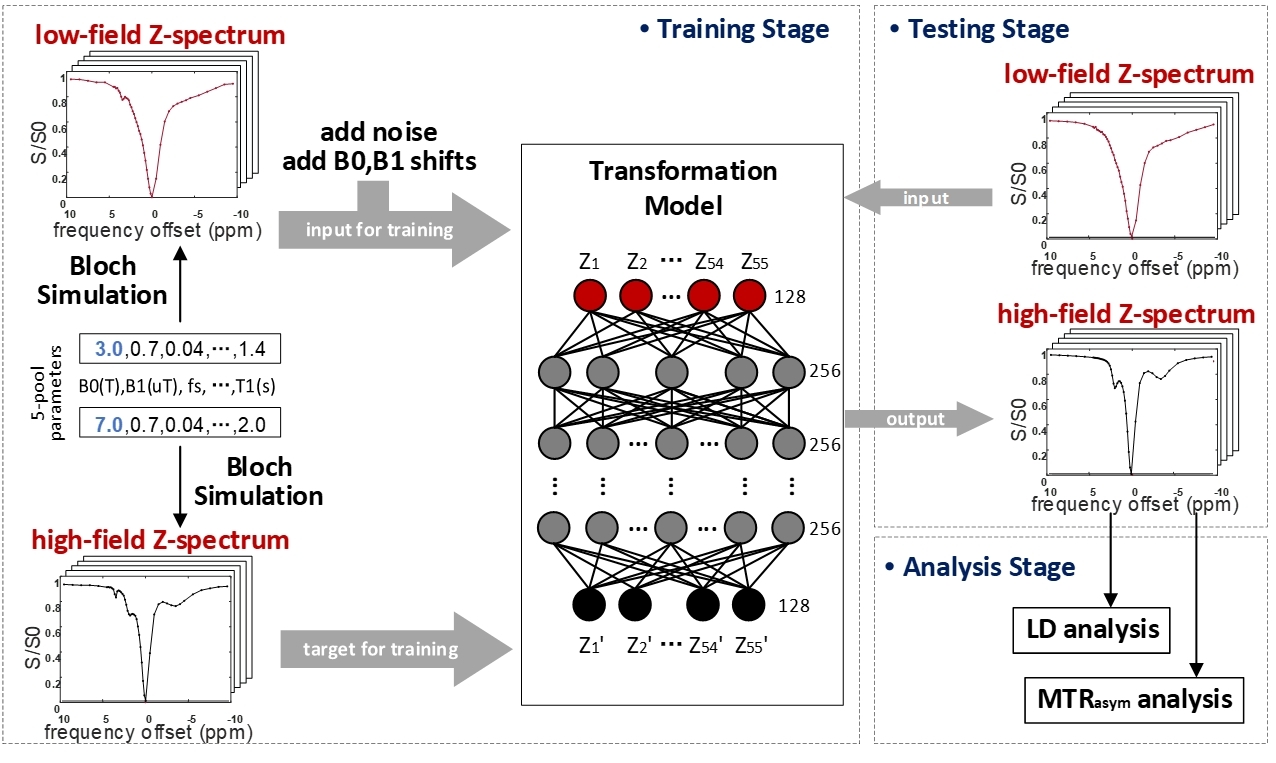
Figure 1. The scheme of the deep learning-based Z-spectrum transformation model. Using the varied combinations of tissue parameters, the paired Z-spectra under both low and high B0 fields were simulated with the 5-pool Bloch model. Then simulated data were used for training the model. After well optimizing, the high B0 field Z-spectrum can be transformed by the corresponding low B0 field data.
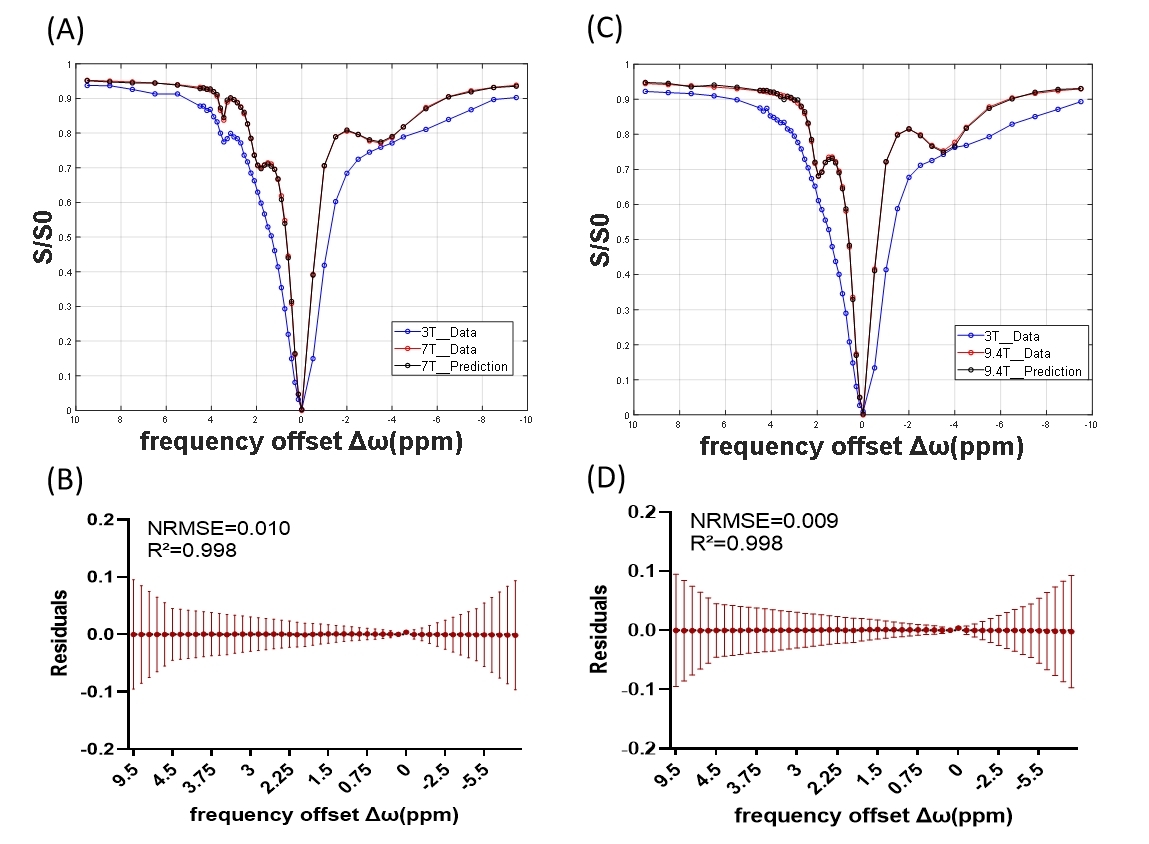
Figure 2. Results of the DNN-based transformed Z-spectrum under 7T and 9.4T. The resulting representative Z-spectra are shown in (A) and (C). Residual spectra of the transformation results and the ground truth at 7T (B) and 9.4T (D).
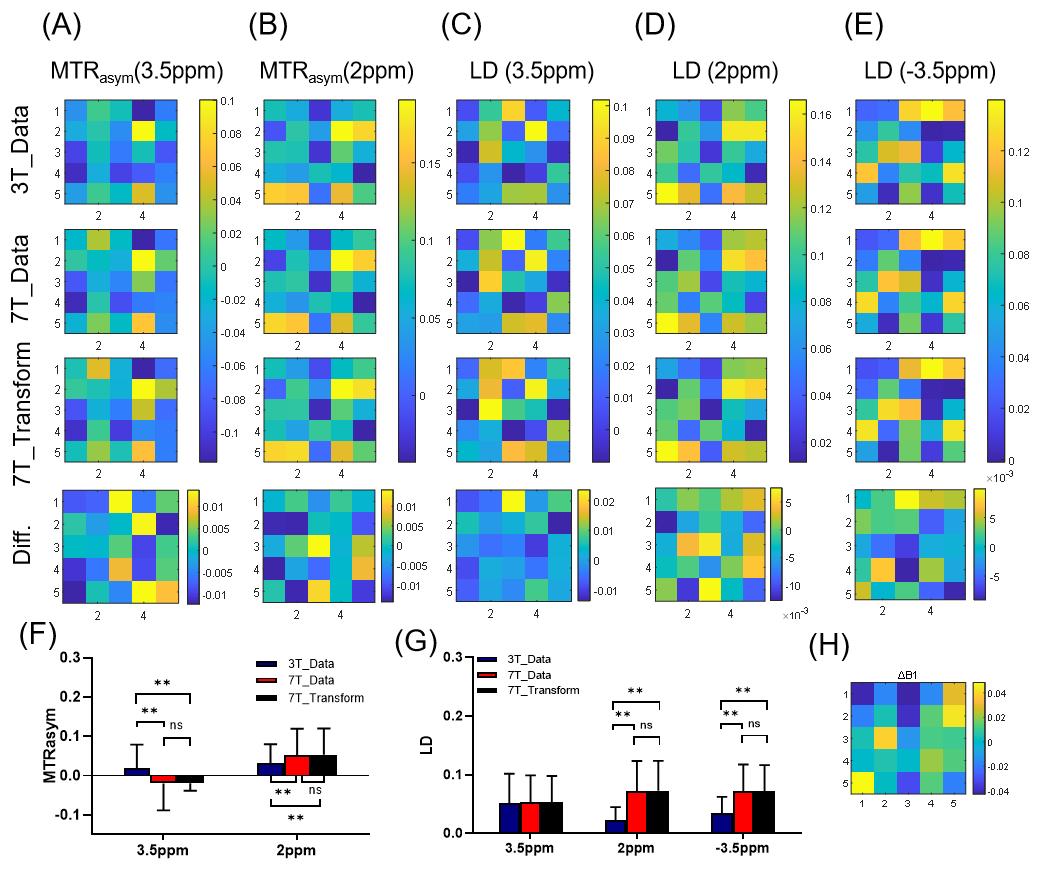
Figure 3. Magnetization transfer ratio asymmetry (MTRasym) and Lorentzian difference (LD) analysis for the DNN-based transformed 7T Z-spectra. (A-D) MTRasym contrast maps and LD contrast maps of the source 3T data and target 7T data at specific frequency offsets. Difference maps show the error between the prediction results and ground truth. Statistical results of (F) MTRasym and (G) LD at 3.5ppm, 2ppm, and -3.5ppm. Significance levels: **, P<0.01; ns, P > 0.05. (H) The B1 field map.
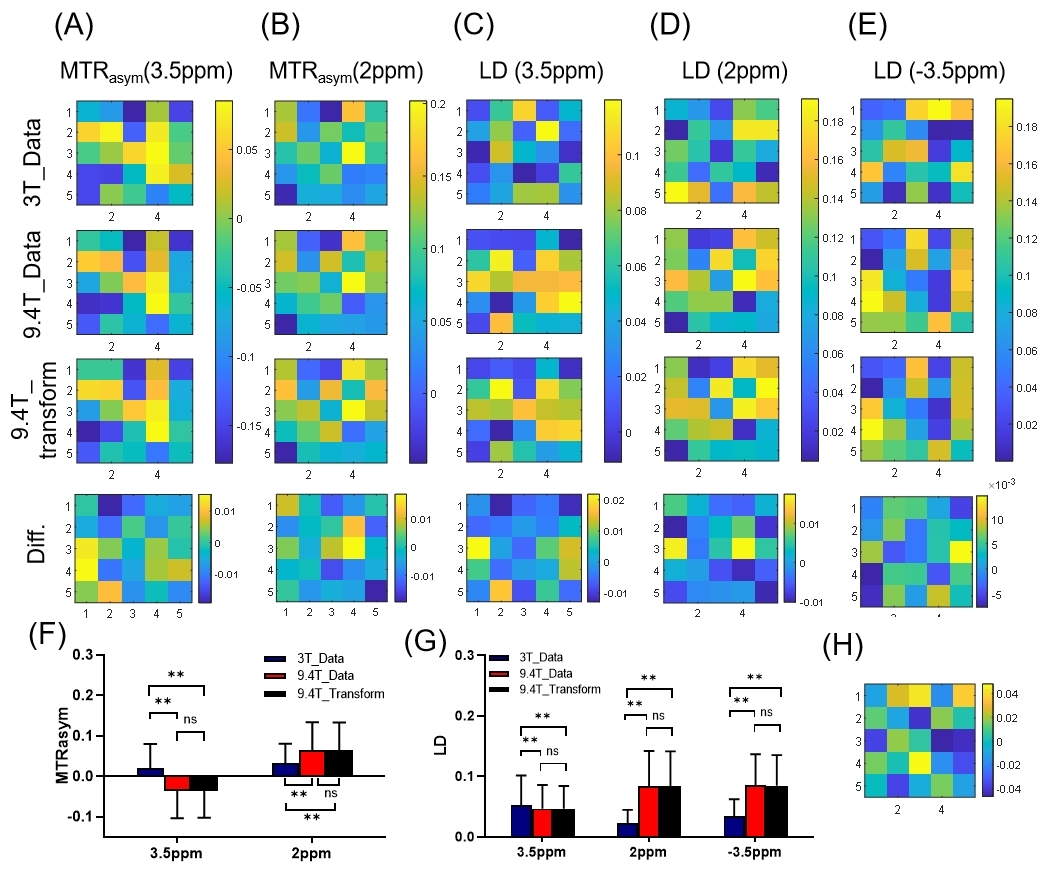
Figure 4. Magnetization transfer ratio asymmetry (MTRasym) and Lorentzian difference (LD) analysis for the DNN-based transformed 9.4T Z-spectra. (A-D) MTRasym contrast maps and LD contrast maps of the source 3T data and target 9.4T data at specific frequency offsets. Difference maps show the error between the prediction results and ground truth. Statistical results of (F) MTRasym and (G) LD at 3.5ppm, 2ppm, and -3.5ppm. Significance levels: **, P<0.01; ns, P > 0.05. (H) The B1 field map.
DOI: https://doi.org/10.58530/2023/3284