3283
The Influences on Amide Proton Transfer (APT) Signal Metrics at 3T: A Simulation and In-Vitro Study1Geoffrey Jefferson Brain Research Centre, School of Health Sciences, Faculty of Biology, Medicine and Health, The University of Manchester, Manchester, United Kingdom, 2Philips, Farnborough, United Kingdom, 3Department of Radiology, Geoffrey Jefferson Brain Research Centre, Salford Royal Hospital, Northern Care Alliance NHS Foundation Trust, Manchester Academic Health Science Centre, Manchester, United Kingdom, 4Department of Academic Neurological Surgery, Geoffrey Jefferson Brain Research Centre, Salford Royal Hospital, Northern Care Alliance NHS Foundation Trust, Manchester, United Kingdom
Synopsis
Keywords: CEST & MT, Quantitative Imaging, APT
Amide Proton Transfer MRI shows clinical benefit in glioma imaging. Clinically useful APTw metrics should be sensitive to changes in amide concentration, a potential marker of tumour proliferation, and insensitive to T1 changes. To investigate sensitivity, simulations and in-vitro studies were performed over a range of amide concentrations and T1 values. In-vitro data included two varied concentration series, with and without T1-maintenance, and a constant concentration T1-vaired series. In-vitro results showed APT* had poor sensitivity, MTRrex was most sensitive to concentration and T1, AREX may overcorrect for T1, and MTRasym appears least sensitive to T1 while remaining sensitive to concentration.
Introduction
Amide Proton Transfer (APT) shows great promise and clinical relevance for detecting progression in brain tumours such as gliomas1,2. Most clinical glioma APTw imaging uses the asymmetric post-processing metric MTRasym. However, there are additional APTw metrics calculable from the acquired Z-spectra, which may have different sensitivities to biological changes such as protein concentration, a potential marker for tumour cell proliferation. Previous studies show that T1 may influence APTw signal, especially at 7T. Since T1 may change with fluid or blood content, T1-sensitive APT metrics may be clinically misleading. While the impact of T1 on the APTw signal at 3T is expected to be minimal, supporting literature is sparse3,4,5. This work investigated the sensitivity of four APTw metrics to changes in protein concentration and T1 in simulated and in-vitro acquired Z-spectra.Methods
Simulations used a 4 pool (water, broad magnetization transfer, APT, and Nuclear Overhauser Enhancement) Lorentzian fit. Input parameters for pools were based on reported literature values in tumour tissue at 3T6. The APT pool relative concentration varied over 0.001-0.008, in 0.001 increments. T1-varied simulations took T1 values of 2200ms-800ms, in 200ms increments. Simulations used the CEST Sources MATLAB package with a block pulse (B1=2μT, Tsat=2sec, and field strength=3T)7.Phantoms were prepared using egg white powder and deionized water. Volumetric dilutions were prepared to concentrations of 100%, 50%, 25%, 10%, 5%, 2.5%, 1.25%, and 1%. A second egg white concentration dilution series was made using Dotarem-doped deionized water, so all dilutions would have the same T1. A series of varied T1 with constant 50% egg white concentration was also prepared. Phantom setup is shown in Figure 1.
MRI was acquired on a 3T Philips Elition X Scanner, with a B1-corrected T1 map calculated using variable flip angle imaging data (TE=0.87ms, TR=10.6ms, spiral readout, Flip angles=2°,6°,10°,12°,15°) and 32 offset CEST acquisition (TE=8.30ms, TR=5925ms, Flip angle=90°, Readout=3D TSE1 , Offsets=(-156(S0),±10,±5,±4.75,±4.5,±4.25,±4.0,±3.75, ±3.5(x3),±3.25,±3.0,±2.5,±2,±1,0ppm), B1=2μT, Tsat=2sec, Voxel Size=0.89x0.89x6.0mm3, Number of slices=10, Acquisition time=12min50sec). Artifact-free regions of interest (ROI) were drawn for each tube on the T1 map and the APT S0 image. The mean and standard deviation of each metric was calculated over these ROIs.
Metrics used to quantify the simulated Z-spectra were MTRasym, MTRrex, APT* and AREX. Evaluation of each metric was done by linear fitting of metric signal as a function of either concentration or T1 for all data series (simulated, T1-varied, doped concentration-varied, undoped concentration-varied). These metrics are described by the equations:
$$MTR_{asym}=(\frac{S(-3.5ppm)-S(+3.5ppm)}{S_0})\cdot100\%$$
$$MTR_{rex}=(\frac{S_0}{S(+3.5ppm)}-\frac{S_0}{S(-3.5ppm)})\cdot100\%$$
$$APT^*=(\frac{S(+3ppm)+S(+4ppm)}{2{\cdot}S_0}-\frac{S(+3.5ppm)}{S_0})\cdot100\%$$
$$AREX=\frac{MTR_{rex}}{T_1}$$
Results
Figure 2 shows the simulated Z-spectra for varied T1 values and varied APT concentrations, with the associated APTw metric linear fits.T1 values (average ± standard deviation) in the ROIs varied from 1339ms±63ms to 2012ms±119ms for the undoped concentration series, and 1497ms±46ms to 1566ms±44ms for the Dotarem-doped concentration series.
MTRasym, MTRrex, and APT* maps of the phantoms are shown in Figure 3 with the acquired Z-spectra shown in the top row of Figure 4. The linear fits of each of these metrics, as well as the AREX values in each tube for the three in-vitro phantom series (T1-varied, doped concentration-varied, undoped concentration-varied) are shown in the bottom row of Figure 4. The gradients of the linear fits for the metrics are reported in Table 1.
Discussion
The Z-spectra in Figure 4 demonstrate that changes in egg white concentration impact both the broader spectrum shape and the APT peak. Overall, changes in APTw metrics correlate linearly to change in APT concentration, regardless of T1-variation.Simulation and in-vitro results show different metric T1-dependency. Though MTRrex is most T1-sensitive for simulated and in-vitro data, Figure 2 simulations show minimal T1-sensitivity for all other metrics. In contrast, in Figure 4, linear fits for in-vitro data show MTRasym as the least T1-sensitive metric, and overcorrection for T1-variation in the AREX metric.
Simulation and in-vitro data showed better agreement in concentration change sensitivity of the metrics MTRrex, MTRasym and AREX. MTRrex was most sensitive, followed by MTRasym and then AREX. APT*, however, was noisy for in-vitro data, which is seen in the Figure 3 APT* map and the Figure 4 linear fits. In-vitro concentration sensitivity of AREX and MTRasym were not statistically different.
MTRrex was most sensitive to protein concentration change across simulations and in-vitro data. However, it was also the most sensitive to T1-variation. AREX was the most consistent between the doped and undoped series, with no significant difference in the gradients (Table 1), but appeared to overcorrect for T1. APT* was noisy in-vitro. Though not the most sensitive metric, MTRasym showed concentration sensitivity, while being robust to T1-variation.
Conclusion
This study demonstrates that at 3T the impact of T1-variation on APTw metrics is minimal, with larger impact from concentration variation. In-vitro, the APT* metric lacked the sensitivity to provide meaningful values. Over the measured range of protein concentrations, the MTRrex was most sensitive to concentration change but also most impacted by T1-variation. MTRasym and the T1-corrected AREX showed similar results. AREX showed the most consistent gradient between the Dotarem-doped and the undoped samples but may overcorrect for T1. Simulation and in-vitro results suggest MTRasym is the most clinically useful metric due to least variability to T1 change while remaining sensitive to concentration.Acknowledgements
The authors acknowledge support from Philips Healthcare for funding of this work.References
1. Jiang S, Eberhart CG, Lim M, et al. Identifying recurrent malignant glioma after treatment using amide proton transfer-weighted MR imaging: a validation study with image-guided stereotactic biopsy. Clinical Cancer Research. 2019;25(2):552-561.
2. Park JE, Kim HS, Park KJ, Kim SJ, Kim JH, Smith SA. Pre- and posttreatment glioma: comparison of amide proton transfer imaging with MR spectroscopy for biomarkers of tumor proliferation. Radiology. 2016;278(2):514-523.
3. Khlebnikov, V. et al. Amide Proton Transfer (APT) Imaging of Brain Tumors at 7 T: The Role of Tissue Water T1-Relaxation Properties. Magnetic Resonance in Medicine. 2016;77(4):1525-1532.
4. Zhou, J., Heo, H.-Y., Knutsson, L., van Zijl, P. C. & Jiang, S. APT-Weighted MRI: Techniques, Current Neuro Applications, and Challenging Issues. Journal of Magnetic Resonance Imaging. 2019;50(2):347-364.
5. Zhou J, Zaiss M, Knutsson L, et al. Review and consensus recommendations on clinical APT-weighted imaging approaches at 3T: Application to brain tumors. Magnetic Resonance in Medicine. 2022;88(2):546-574.
6. Heo, H.-Y. et al. Insight into the quantitative metrics of chemical exchange saturation transfer (CEST) imaging. Magnetic Resonance in Medicine. 2016;77(5):1853–1865.
7. Matlab CEST sources https://www.cest-sources.org/doku.php (2022).
Figures
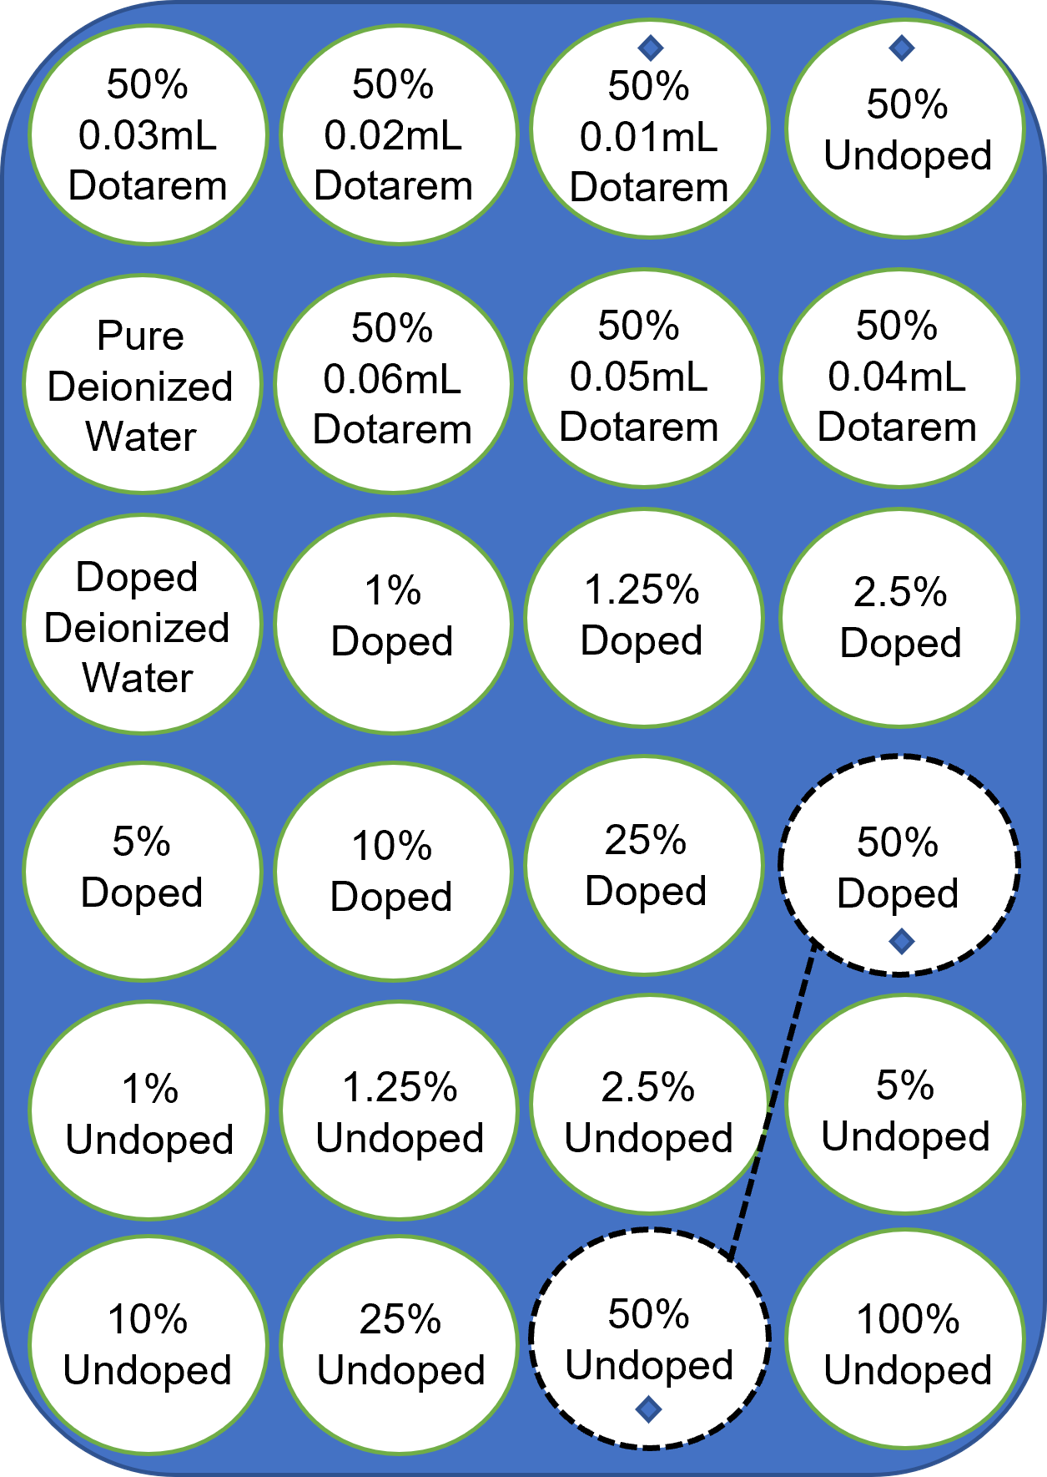
Figure 1. Egg White Dilution Phantom Setup. The 50% solutions (rows 1 & 2) were made with deionized water with 0.01mL – 0.06mL of Dotarem added. The doped series (rows 3 & 4) was diluted with Dotarem-doped deionized water. The undoped dilution series (rows 5 & 6) was made with pure deionized water. The diamond marked tubes show those included in the T1-varied series. The dashed black line shows one of the comparable concentration tube pairs between the doped and undoped series. Similarly, the 25%, 10%, …, 1% doped & undoped tubes can be compared.
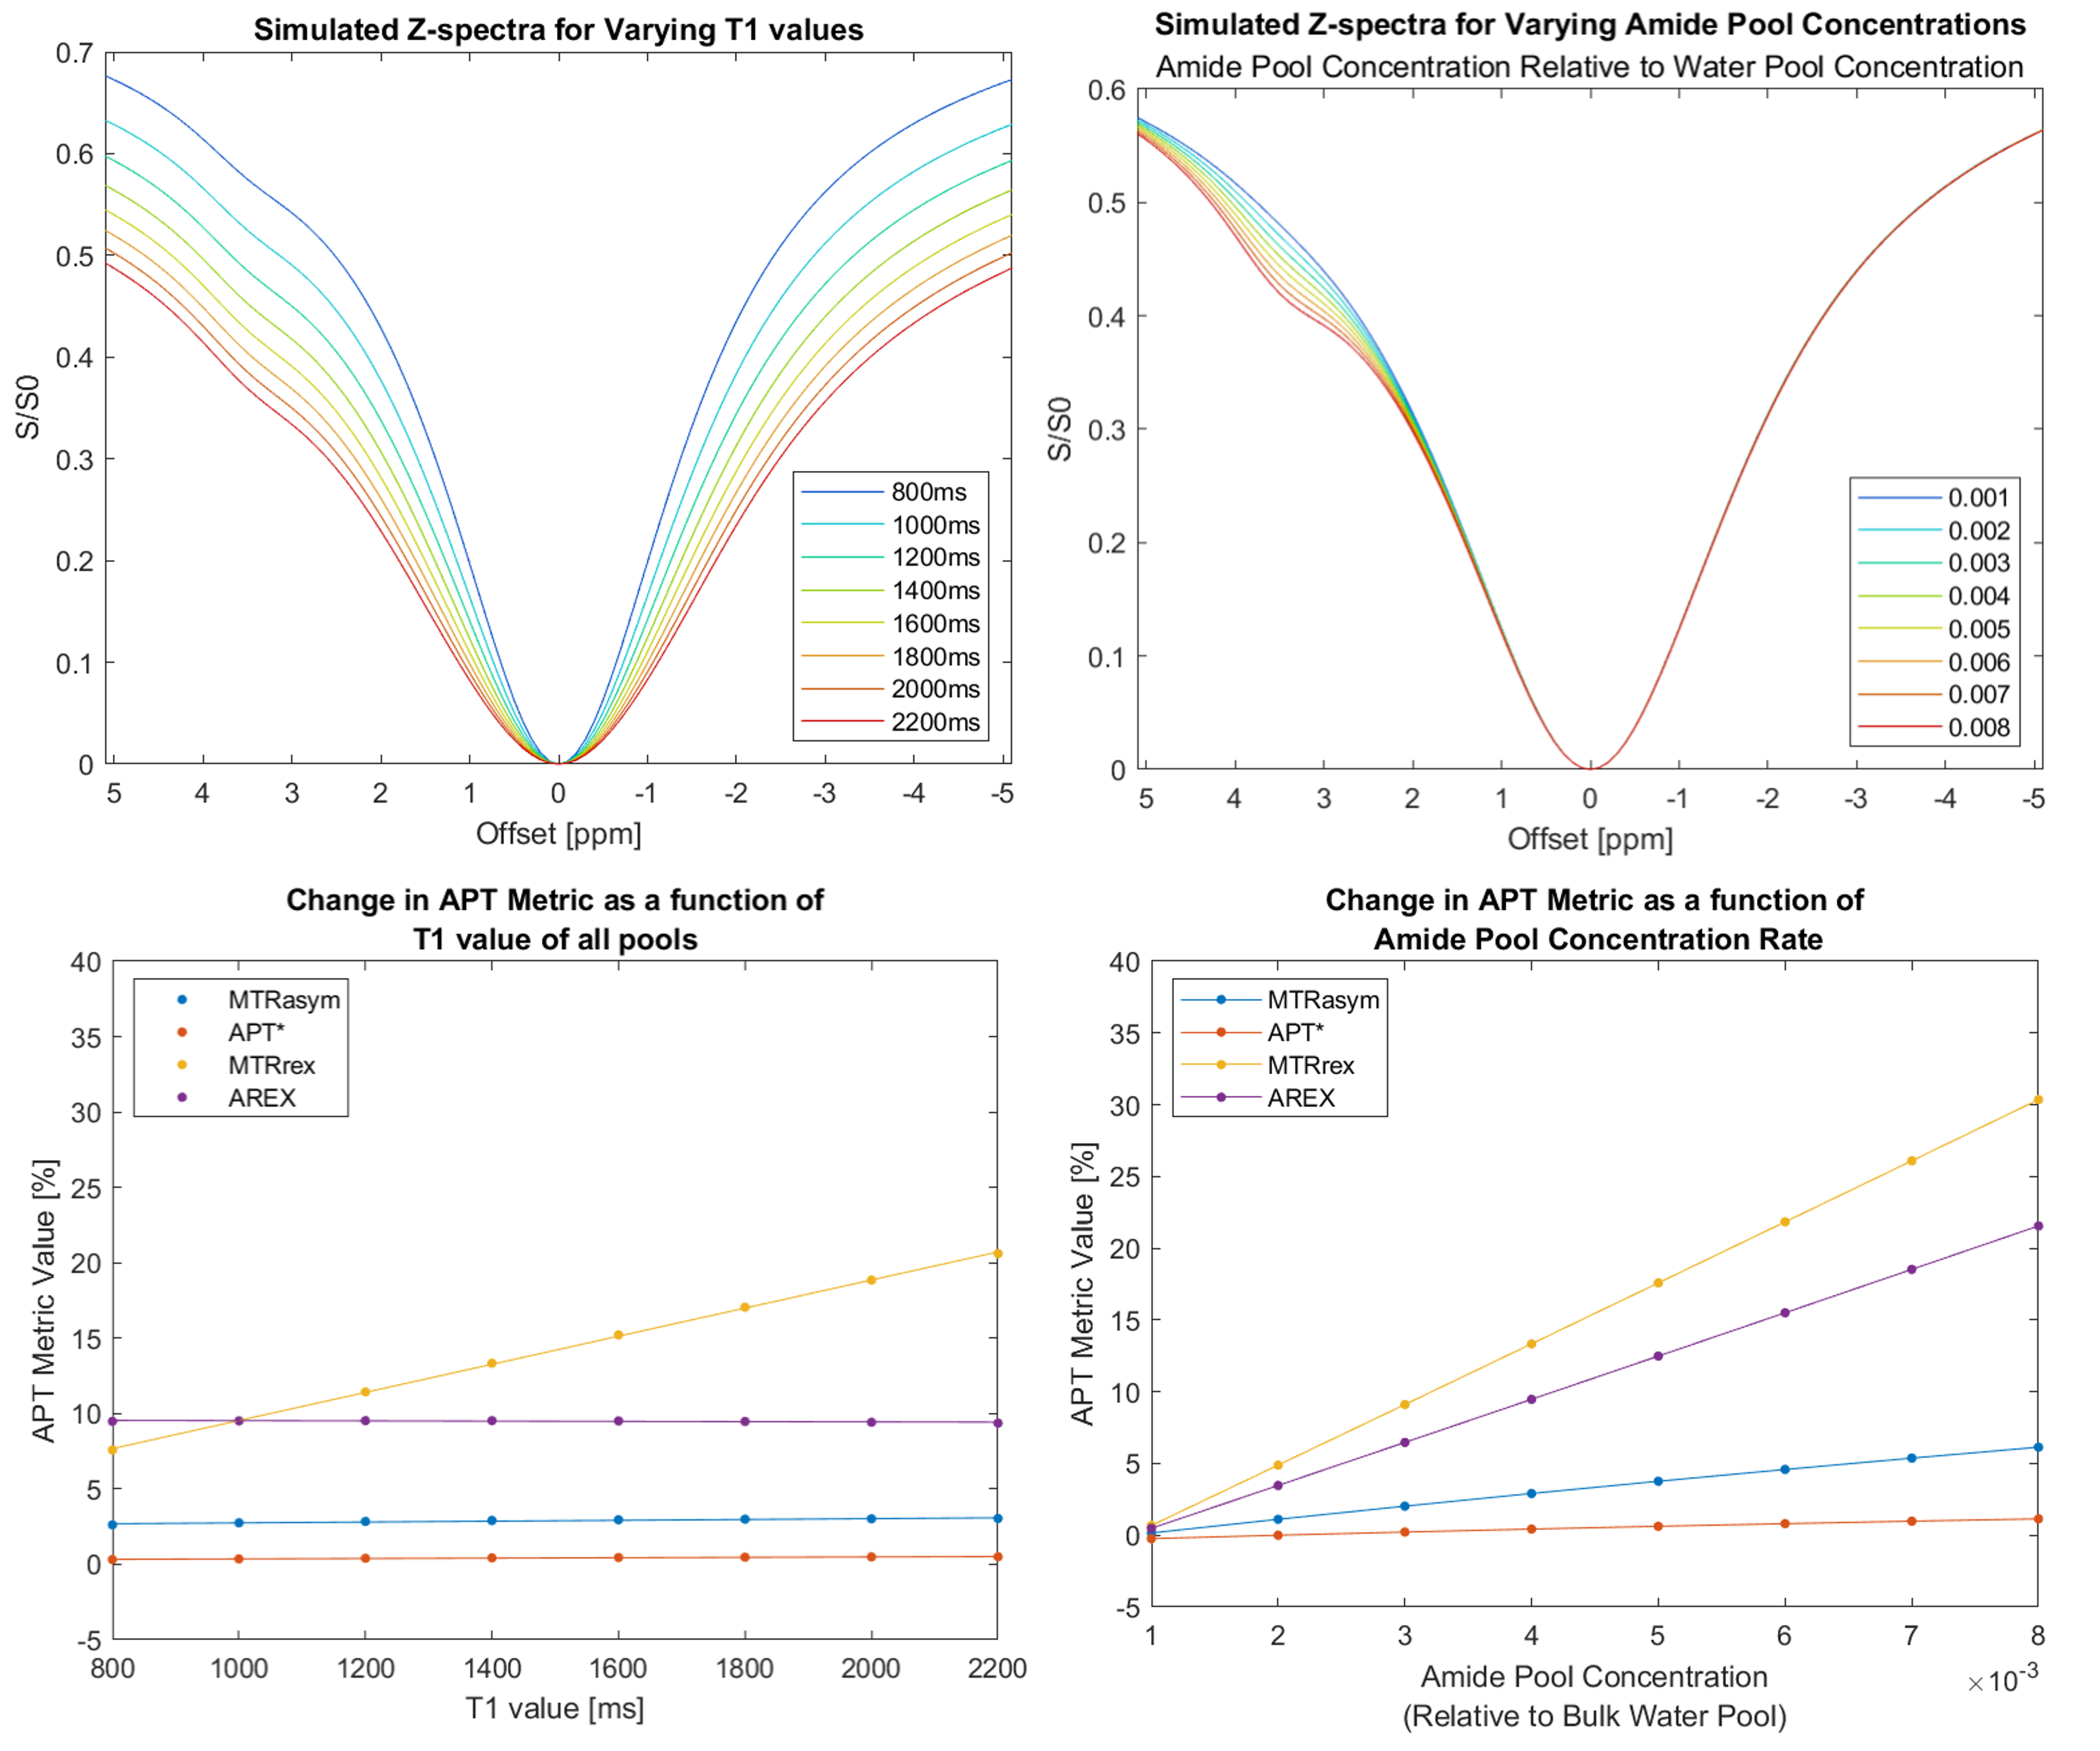
Figure 2. Row 1: Z spectra of simulations for varying T1 (left) and varying APT pool concentration (right), Row 2: MTRasym, MTRrex, APT*, and AREX fits for the T1 varied and concentration varied simulations.
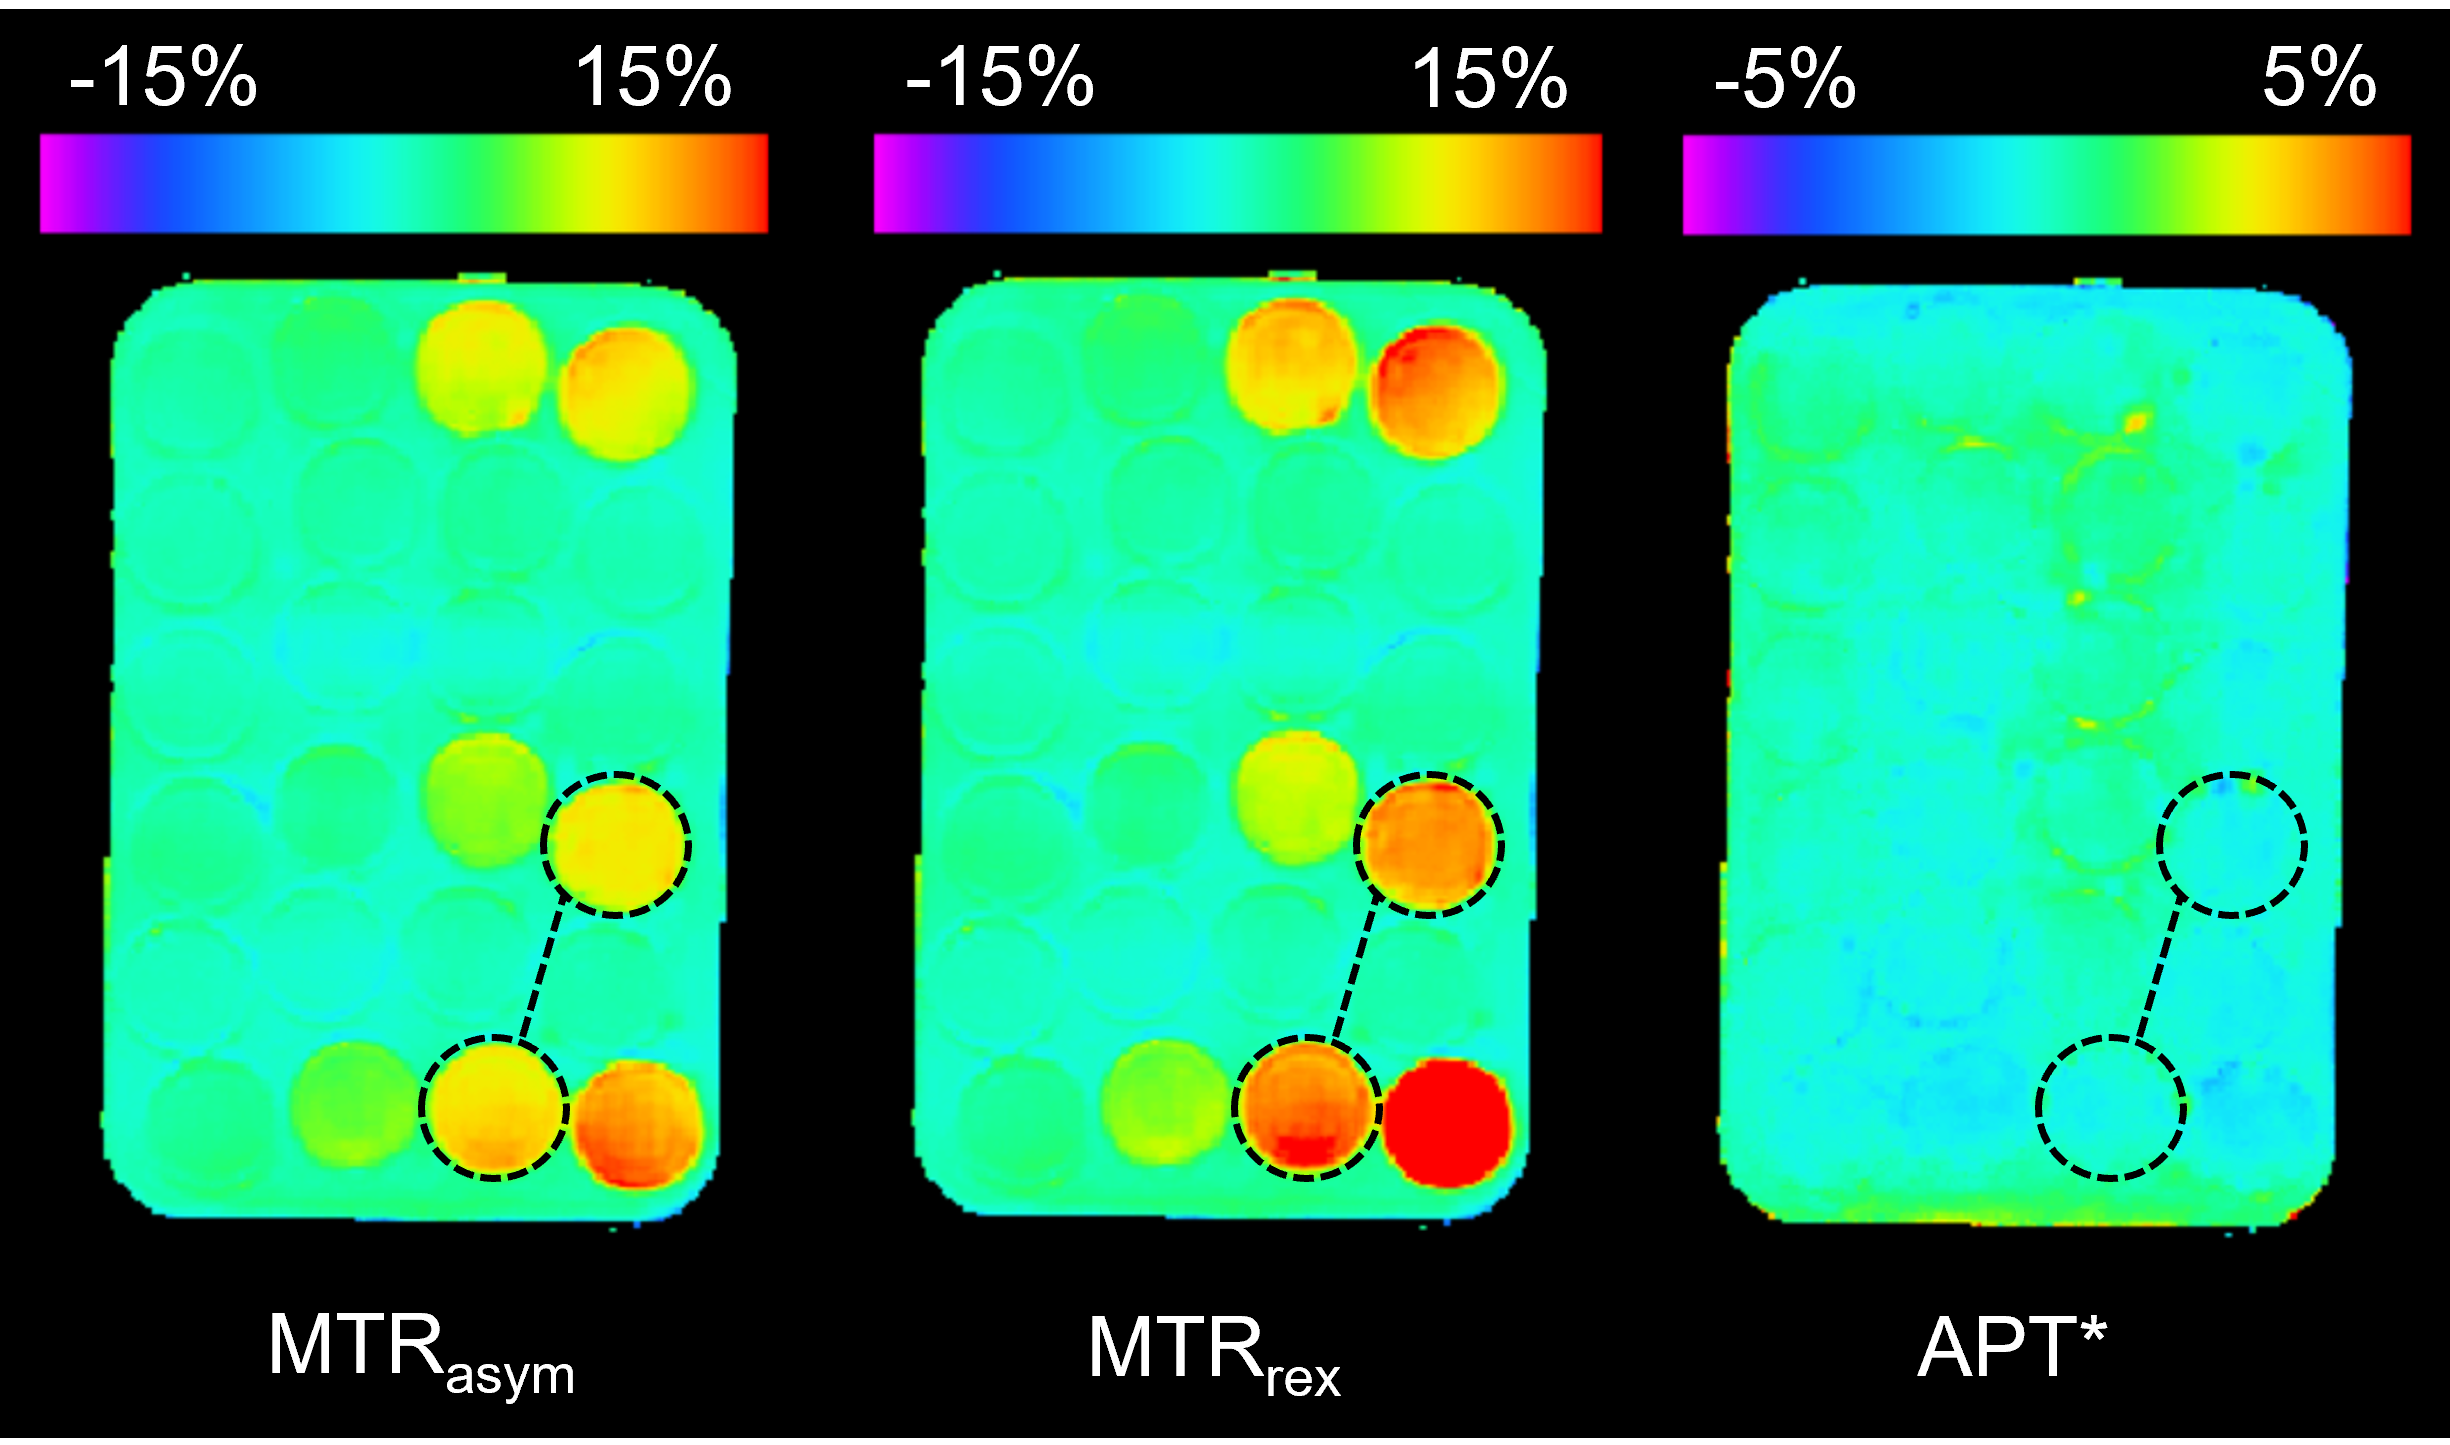
Figure 3. Representative slice of the MTRasym (left), MTRrex (centre), APT* (right) maps of sample tubes with various egg white concentration dilutions and Dotarem doping (phantom contents described in Figure 2). The two tubes connected by the dashed line demonstrate the 50% undoped and 50% Dotarem-doped tubes for comparison.
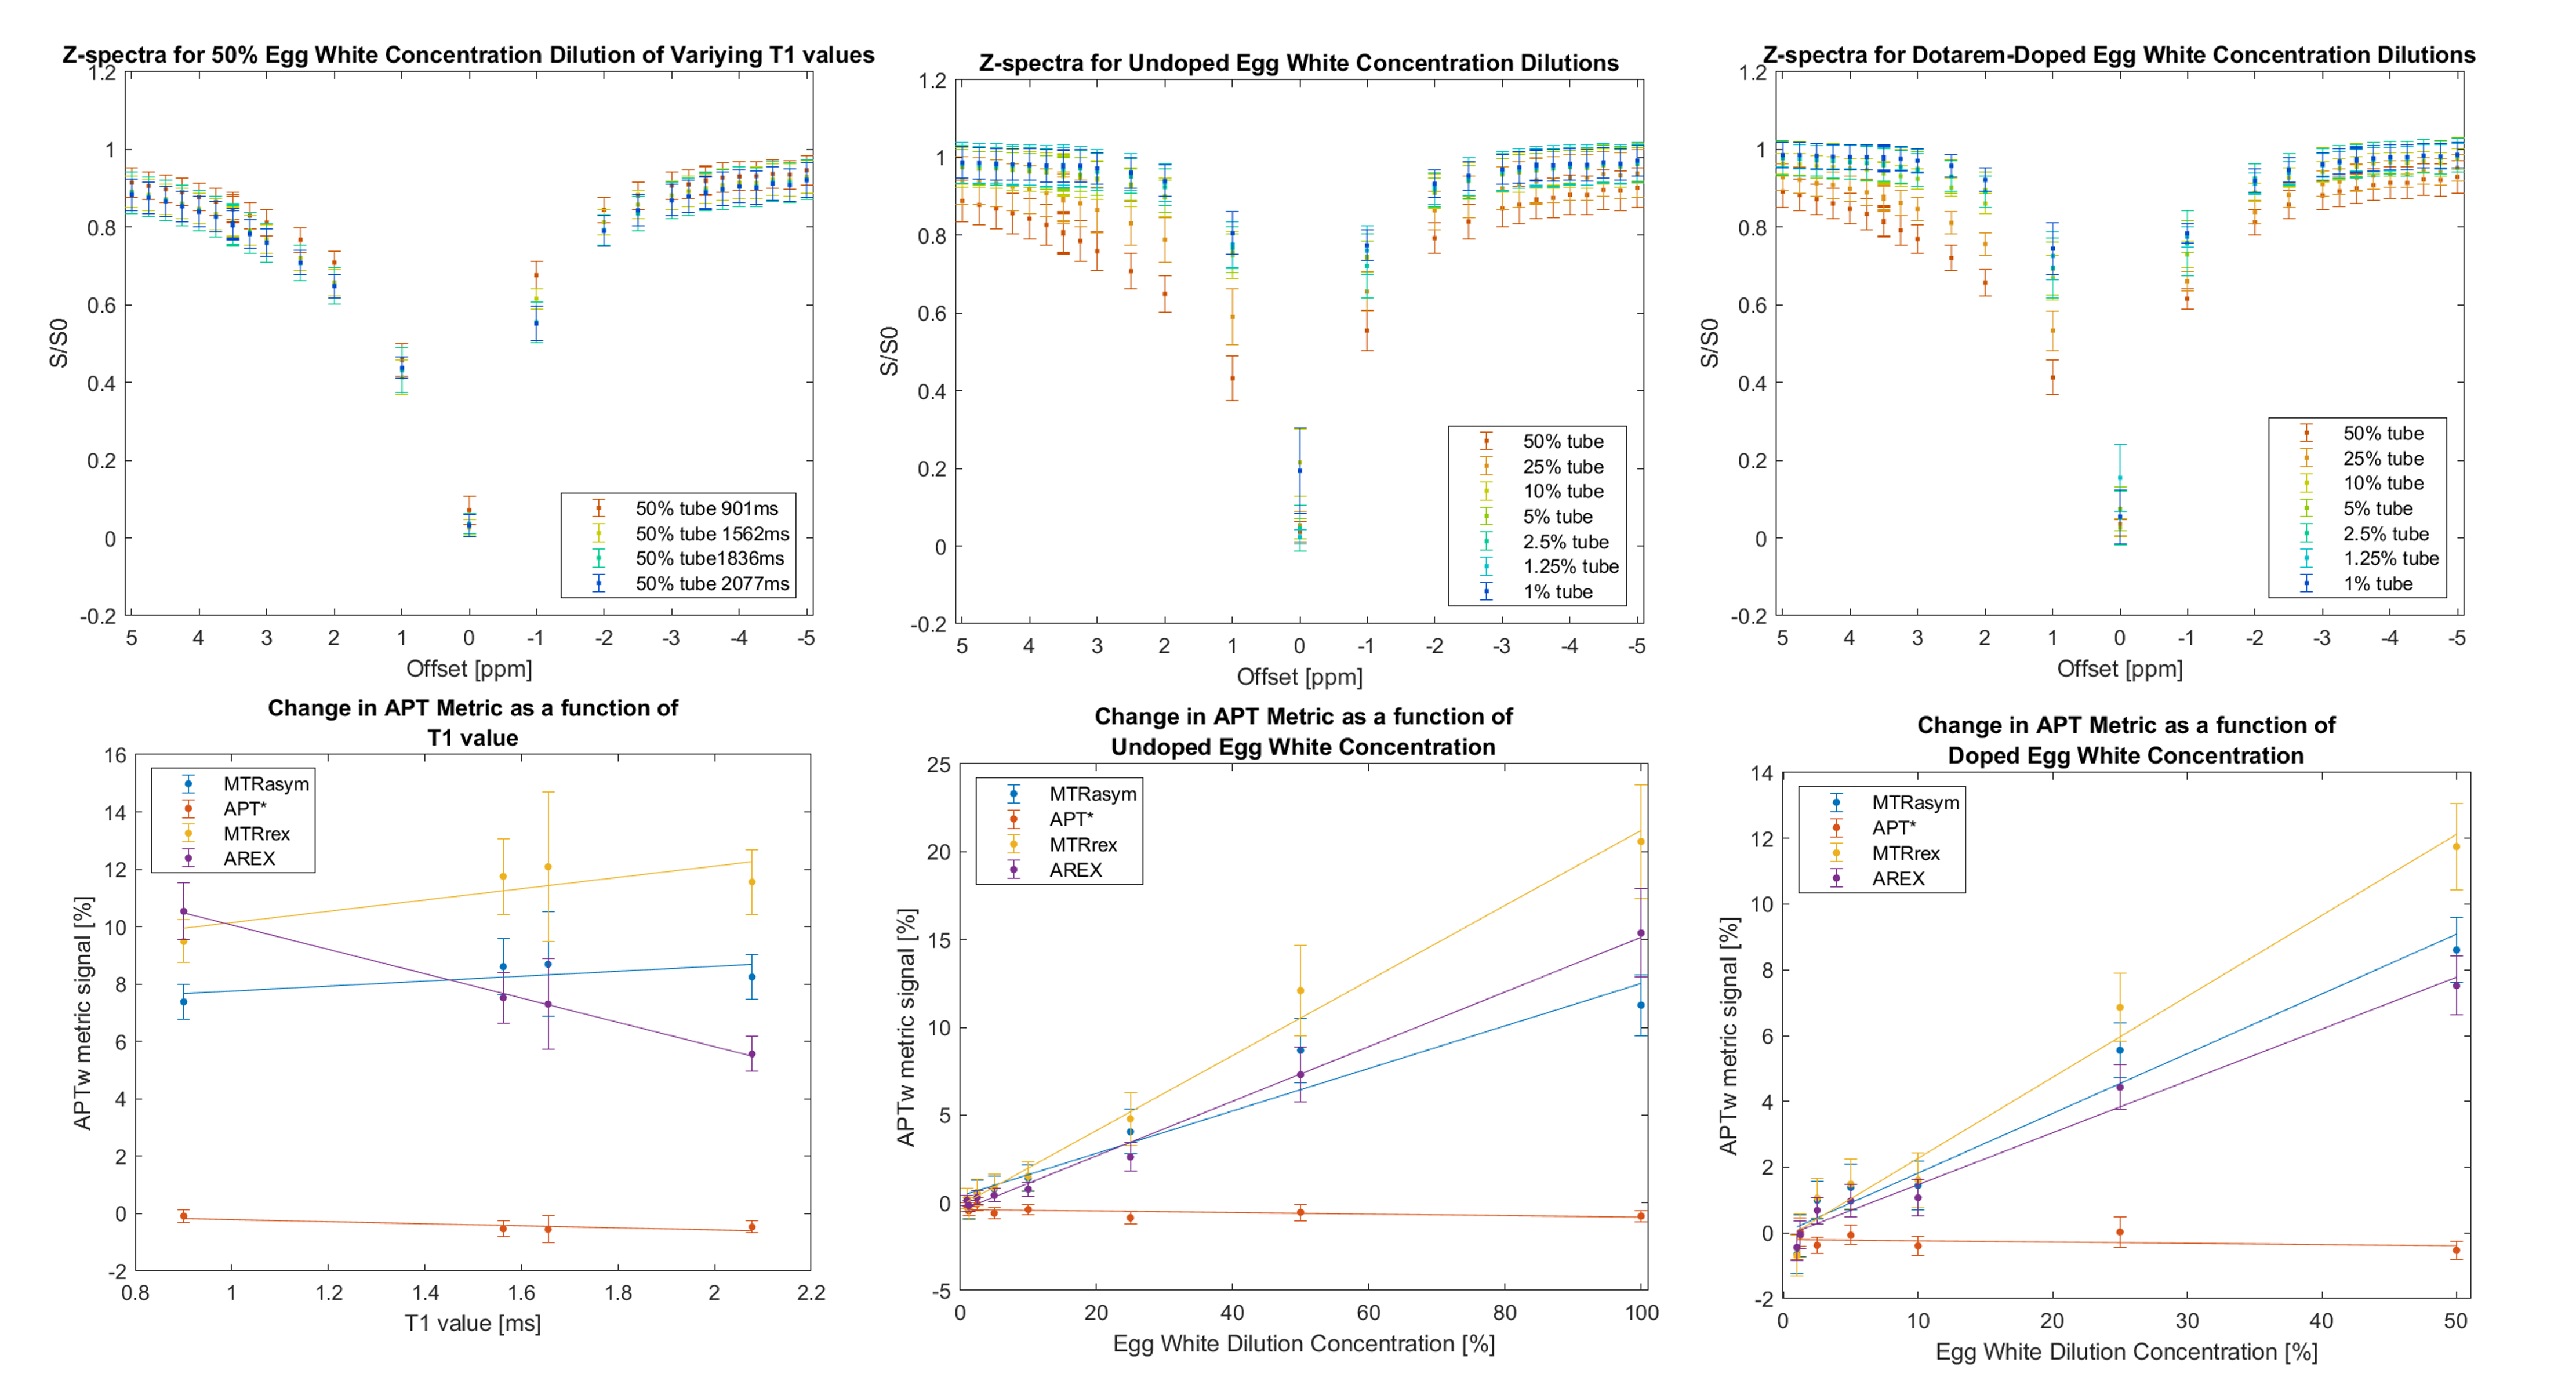
Figure 4. Top Row: Acquired Z-spectra for the T1-varying 50% egg white series (left), Dotarem-doped egg white dilution series (centre) and the undoped egg white dilution series (right). Bottom Row: Linear fits for the MTRasym, APT*, MTRrex, and AREX metrics for the T1-varying 50% egg white series (left), undoped egg white concentration dilution (centre) and Dotarem-doped egg white concentration dilution series (right). Error bars denote the standard deviation across the region.
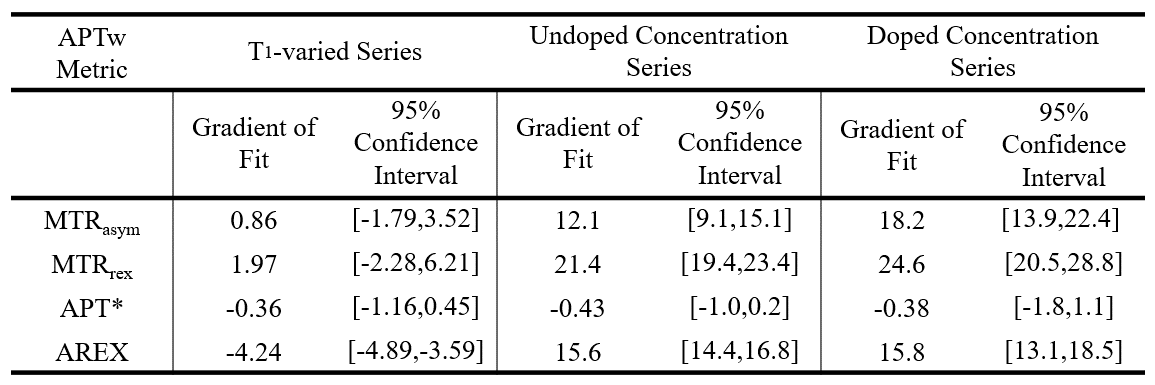
Table 1. Summary of the APTw metrics linear fits (gradient and 95% confidence interval of the gradient) for the T1-vaired, doped concentration, and undoped concentration series.