3282
MT and CEST MRI of in vitro gastric protein digestion1Laboratory of Biophysics, Wageningen University & Research, Wageningen, Netherlands, 2Human Nutrition and Health, Wageningen University & Research, Wageningen, Netherlands, 3Image Sciences Institute, University Medical Centre Utrecht, Utrecht, Netherlands
Synopsis
Keywords: CEST & MT, Body, in vitro
Gastric digestion of dietary protein is commonly studied using in vitro digestion models, which need to be verified with in vivo data. Here, we used MT and CEST MRI to monitor in vitro gastric digestion of milk proteins. We show that MT and CEST measurements can be used to monitor the breakdown of the initially-formed semi-solid protein coagulum and hydrolysis of soluble proteins. We also demonstrate that RF-based ratiometric CEST analysis can be used for pH mapping in both acid- and base-catalyzed regions. Our results open the way to quantification of in vivo protein digestion with the use of MRI.Introduction
Gastric digestion is crucial for the breakdown of dietary proteins and the subsequent absorption of amino acids. Protein digestion is commonly studied using in vitro digestion models. However, verifying these models with in vivo data from humans remains a challenge. Magnetic Resonance Imaging (MRI) has great potential for investigating in vivo protein digestion because it can be used to acquire detailed images of the chyme inside the gastrointestinal tract in a non-invasive manner [1]. In our work, we explore the use of Magnetization Transfer (MT) and Chemical Exchange Saturation Transfer (CEST) MRI to monitor in vitro and in vivo protein digestion using skim milk (SM) as a test food. The digestion of casein and whey milk proteins starts in the gastric phase, and includes protein coagulation, hydrolysis and changes in pH. As a first step, we applied MT and CEST MRI to monitor these processes using a simple static in vitro digestion model [2] and an MRI-compatible dynamic digestion model, in which gastric secretion and emptying are incorporated [3].Methods
Unheated and heated SM were digested according to either a static or a dynamic gastric digestion model. For static digestion, the whole sample, including coagulum and liquid phase, was measured, whereas for dynamic digestion the liquid phase was extracted and measured at 11 digestion time points ranging between 1 and 90 min. 1H MT and CEST MRI measurements were conducted on a 7 T NMR spectrometer using a CEST preparation module, followed by image acquisition using a Rapid Acquisition with Relaxation Enhancement (RARE) sequence. The MT ratio (MTR) was obtained using a saturation pulse with amplitude B1 = 11.7 µT, duration Tsat = 5 s and frequency offset $$$\Delta$$$ =25 ppm. CEST spectra were measured using a B1 = 3 µT and Tsat = 1 s. The effective echo time was 78 ms, resulting in a T2-weighted unsaturated (S0 ) image. CEST spectra, measured at 61 $$$\Delta$$$ values between -10 and 10 ppm, were corrected for B0-inhomogeneities using the Water Saturation Shift Referencing (WASSR) approach [4]. The asymmetric MTR (MTRasym) was obtained from the CEST spectrum to monitor soluble proteins and peptides. Semi-solid and liquid content masks were obtained by intensity thresholding of the T2-weighted S0 images. Masks for the semi-solid coagulum or for the supernatant liquid phases in the sample were applied to the CEST images to respectively calculate the MTR and MTRasym maps at $$$\Delta$$$ = 2.7 ppm. CEST spectra of whey protein solutions at pH 3-7 were measured with a B1 of 1.5 and 3 µT for pH mapping using the radio-frequency (RF) based ratio-metric analysis of RF spillover effect-corrected inverse CEST asymmetry (PRICESTR) approach [5].Results and Discussion
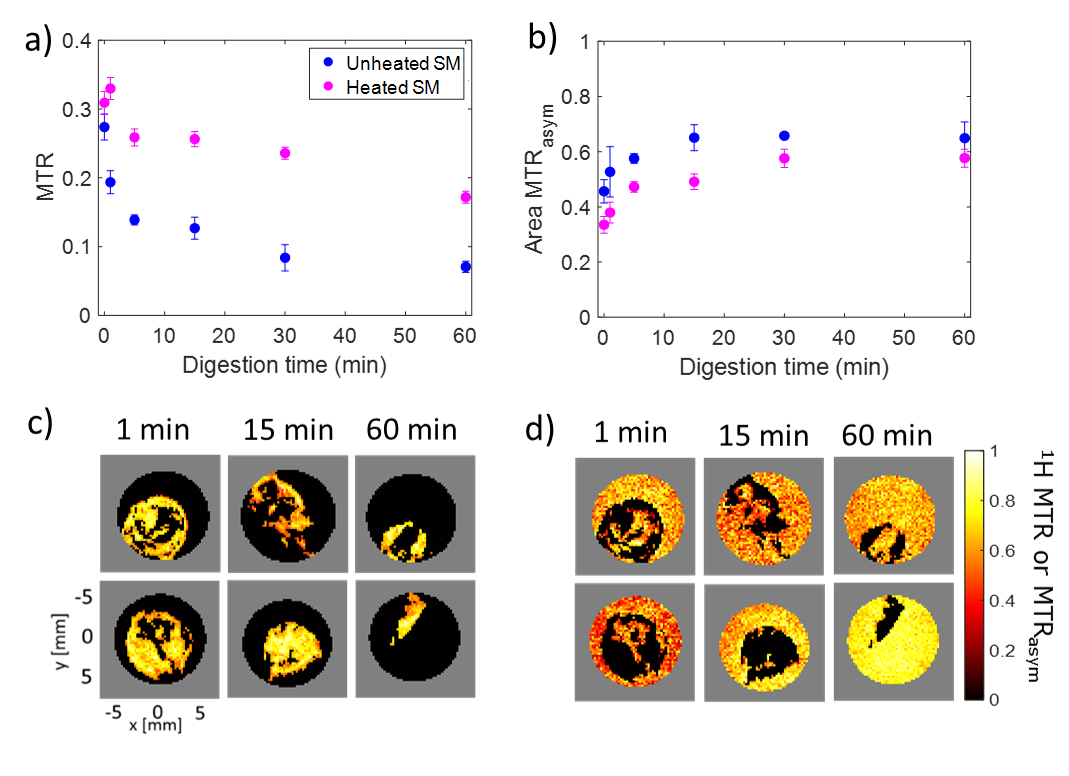
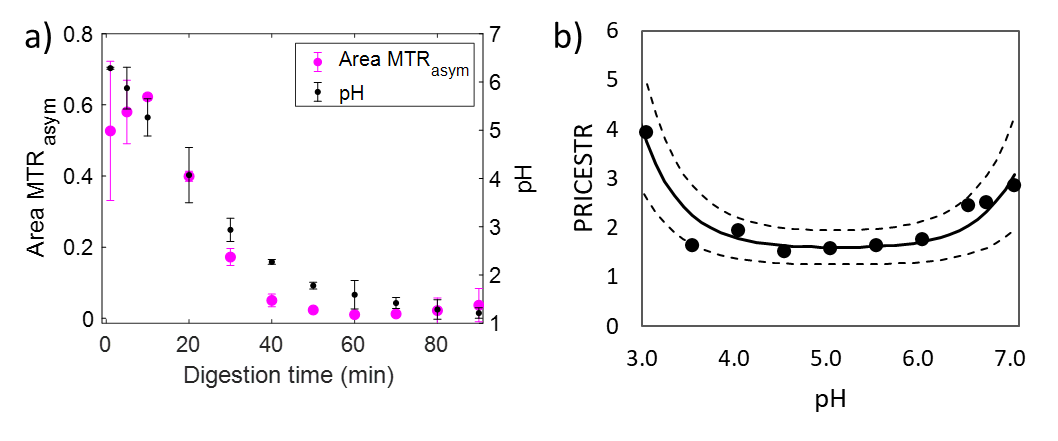
The MTR value for both raw and heated SM decreased with digestion time due to the pepsin-induced breakdown of the protein coagulum (Fig. 1a). Higher MTR values and a slower variation in the MTR were observed for heated SM compared to unheated SM during gastric digestion [6]. The area under the MTRasym spectrum (Fig. 1b) increased with digestion time, due to solubilization of proteins and peptides from the milk protein coagulum into the liquid phase. There was a significant effect of digestion time ($$$p$$$ < 0.001) and heat treatment ($$$p$$$ < 0.005) on the MTRasym. The MTR maps (Fig. 2a) were affected by variations in the amount of semi-solid protons, and can be used to selectively monitor macroscopic changes in the protein coagulum. The MTRasym maps of the liquid phase (Fig. 2b) can be used to monitor changes in the amount of soluble proteins and peptides and showed an increase in the MTRasym with digestion. The MTR and MTRasym maps could be obtained within 1 min of acquisition time, which fits in three 20-s breath-hold scans. This enables future in vivo applications. In contrast with static digestion, the MTRasym decreased during dynamic in vitro digestion (Fig. 3a), which is in agreement with the pH decrease from 6.6 to 1.2, caused by the secretion of acidic simulated gastric fluid. Since protein coagulation and hydrolysis are affected by variations in gastric pH, pH mapping during gastric digestion is of interest. Therefore, we are currently exploring the PRICESTR approach for gastric pH mapping(Fig. 3b) using the relation $$$PRICESTR = k_0 + k_a * 10^{-pH} + k_b * 10^{pH-14}$$$ to describe the acid- and base-catalyzed 1H chemical exchange between proteins and water.Conclusions
We successfully applied 1H MT and CEST MRI measurements to monitor static in vitro gastric digestion of milk proteins. We showed that a combination of MTR- and MTRasym-contrast maps obtained with three 20 s scans can be used to monitor macroscopic changes in the protein coagulum and hydrolysis of soluble proteins during static in vitro gastric digestion. The MTRasym under dynamic digestion conditions was dominated by pH variations, making it promising for in vivo gastric pH mapping. Our findings open the way to non-invasive monitoring of in vivo protein digestion with the use of MRI, effectively bridging the gap between in vitro models and real-life digestion processes.Acknowledgements
We acknowledge the Dutch Ministry of Economic Affairs Top Sector Agri&Food [grant number AF-18012] for funding this project. Camilla Terenzi acknowledges funding from the 4TU Precision Medicine program supported by High Tech for a Sustainable Future. We also acknowledge the support of NWO for the MAGNEFY centre, which is part of the uNMR-NL national facility. We thank Luisa Ciobanu and Julien Flament for providing the CEST-RARE pulse sequence. We thank Jeanine Prompers for helpful discussions during this project.
References
1. Smeets, P. A. M., Deng, R., Van Eijnatten, E. J. M., & Mayar, M. (2020). Monitoring food digestion with magnetic resonance techniques. Proceedings of the Nutrition Society, (3), 1–11.
2. Ménard, O., Bourlieu, C., De Oliveira, S. C., Dellarosa, N., Laghi, L., Carrière, F., Deglaire, A. (2018). A first step towards a consensus static in vitro model for simulating full-term infant digestion. Food Chemistry, 240(2017), 338–345.
3. Deng, R., Janssen, A. E. M., Vergeldt, F. J., Van As, H., de Graaf, C., Mars, M., & Smeets, P. A. M. (2020). Exploring in vitro gastric digestion of whey protein by time-domain nuclear magnetic resonance and magnetic resonance imaging. Food Hydrocolloids, 99,105348-105358.
4. Kim, M., Gillen, J., Landman, B. A., Zhou, J., & Van Zijl, P. C. M. (2009). Water saturation shift referencing (WASSR) for chemical exchange saturation transfer (CEST) experiments. Magnetic Resonance in Medicine, 61(6), 1441–1450.
5. Sun, P. Z., Xiao, G., Zhou, I. Y., Guo, Y., & Wu, R. (2016). A method for accurate pH mapping with chemical exchange saturation transfer ( CEST ) MRI. Contrast Media & Molecular Imaging, 11(3),195-202.
6. Mayar, M., Miltenburg, J. L., Hettinga, K., Smeets, P. A. M., van Duynhoven, J. P. M., & Terenzi, C. (2022). Non-invasive monitoring of in vitro gastric milk protein digestion kinetics by 1H NMR magnetization transfer. Food Chemistry, 383, 132545-132555.
Figures