3280
Model-based technique for rapid magnetization transfer corrected T1 mapping1Department of Radiology, Stanford University, Stanford, CA, United States, 2Electrical Engineering, Stanford University, Stanford, CA, United States
Synopsis
Keywords: CEST & MT, Brain, T1
A model-based technique for rapid magnetization transfer corrected T1 mapping is proposed, the T1 maps generated from the proposed technique is free of the under-estimation caused by MT effect. The technique is validated in both simulation and in-vivo experiments.Introduction
Spin-lattice relaxation time (T1) has been shown to be a valuable biomarker for various diseases such as myocardial infarction1, liver cirrhosis2, neural tissue inflammation3 and neurological disorders4. Fast T1 measurement algorithms has been developed to measure T15–8, those algorithms are based on the Look-Locker technique and uses a spoiled or balanced gradient echo (GRE) sequence for data sampling. Magnetization transfer (MT) is known to cause a large underestimation in T19,10, however, those T1 measurement techniques didn’t take MT effect into consideration.In this abstract, we propose a fast model-based technique that uses both the T1 recovery model and the MT model in the reconstruction. The resulting T1 map is thus MT-corrected. This technique is able to acquire high resolution MT-corrected T1 maps in under 3 seconds.
Technique and Methods
The T1 recovery model can be expressed as$$s(t)=A-Be^{(-\frac{TI}{T_{1}^{*}})}$$
where $$$I_{0}{\cdot}T_{1}^{*}/T_{1}$$$, $$$I_{0}(1+T_{1}^{*}/T_{1})$$$, and T1* is the apparent T1 when an imaging flip angle is repeatedly applied to the spins. The true T1 can then be calculated using $$$T_{1}=T_{1}^{*}(B/A-1)$$$.
The cross-relaxation between a bound water pool and free water pool in the MT effect is modeled by using EPG-X11. In this model, the water molecules associated with macromolecules is considered to have a very short T2, and assumed to have no transverse magnetization.
The reconstruction is formulated as a subspace low-rank optimization problem with a L1 total variation as a regularization term. Once the T1 recovery curves are reconstructed, a dictionary that covers the literature reported MT parameter ranges12 was generated for curve fitting. Other MT parameters such as the exchange rate (kf), fractional pool size (f) were treated as nuisance parameters.
For the computer simulation, a BrainWeb digital phantom with labels for gray and white matter was used, literature reported MT parameter values12 were used to fill the BrainWeb phantom for simulation.
For in vivo study, data were collected using a 3T scanner (Premier, GE Healthcare, Waukesha WI). An inversion recovery spoiled gradient echo sequence with a tiny golden angle (23.63) radial readout were used for data collection . Imaging parameter used are TE=2.1ms, TR=4.7ms, TI=10ms, receiver bandwidth=976.6Hz/pixel, base resolution = 256, FOV=220mm. A total of 512 radial projections were acquired. A volunteer were scanned under IRB approval with informed consent.
Results
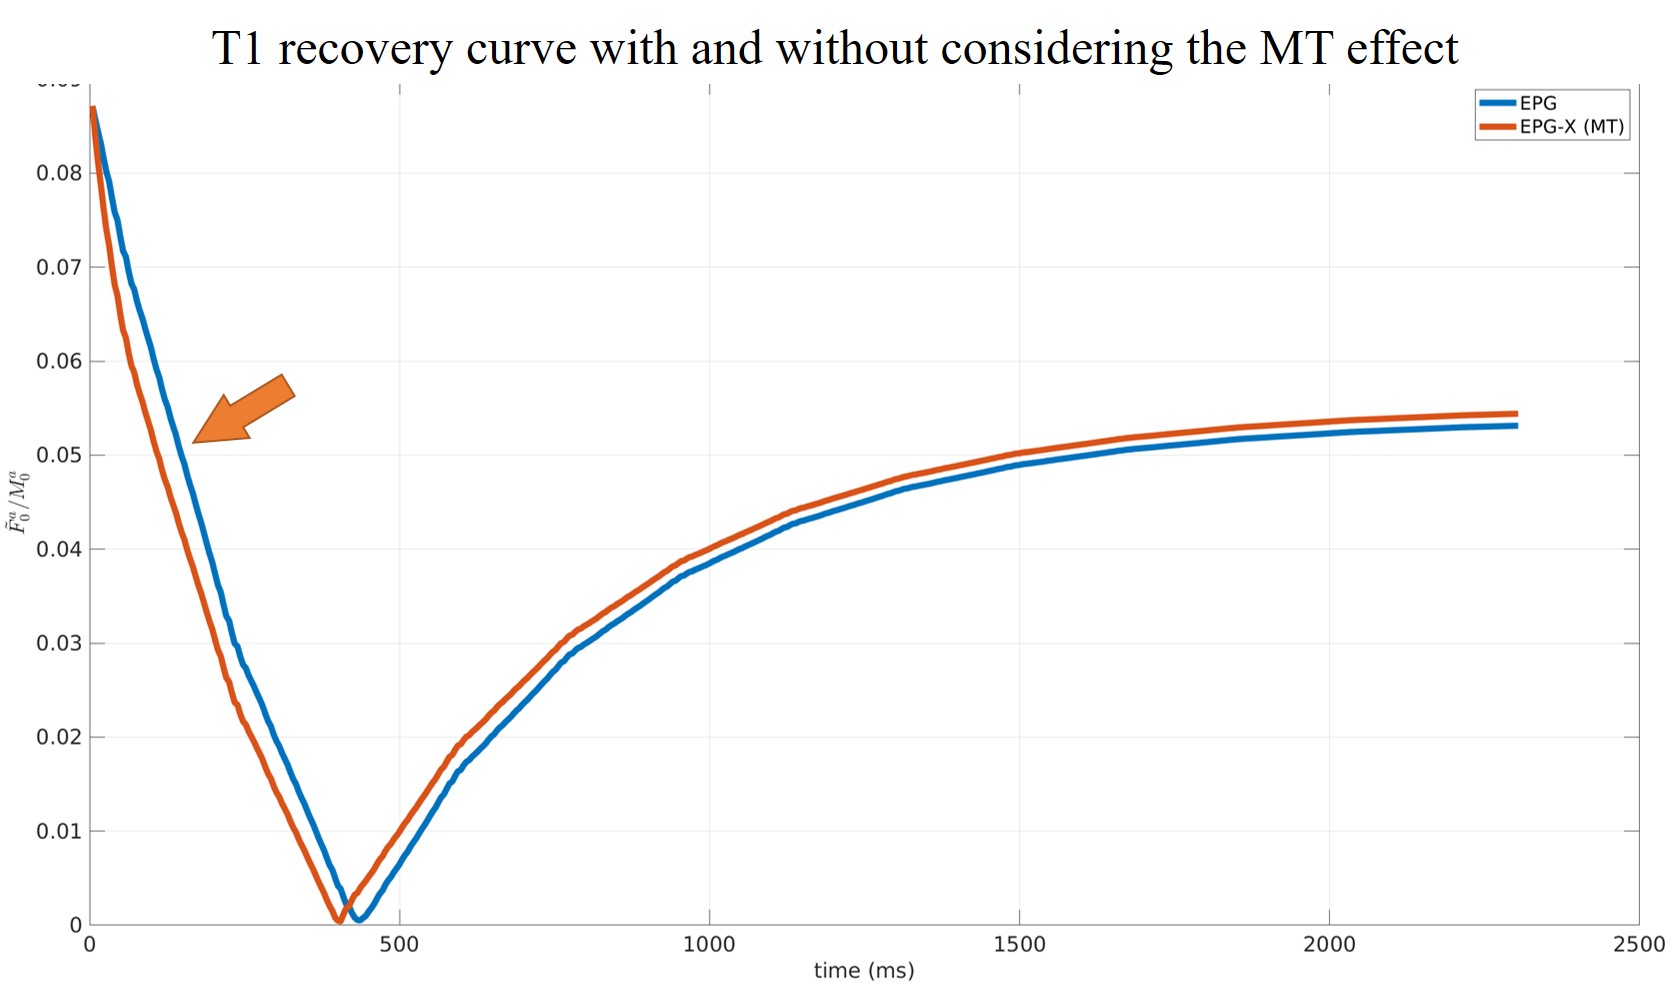
Figure 1 shows the T1 recovery curve with and without MT effect. As indicated by the arrow, when the MT effect is taken into consideration in the T1 model, the T1 recovery appears to be faster at the beginning. This is due to the bound pool water not been fully inverted by the inversion RF pulse, while exchanging with the free pool water. Thus creating a faster initial recovery.Figure 2 shows the simulation results. As can be seem that the T1 values for both the gray and white matter in the digital phantom is underestimated when the T1 curve fitting model didn’t take the MT effect into consideration. The MT corrected T1 showed a slight overestimation against the truth.
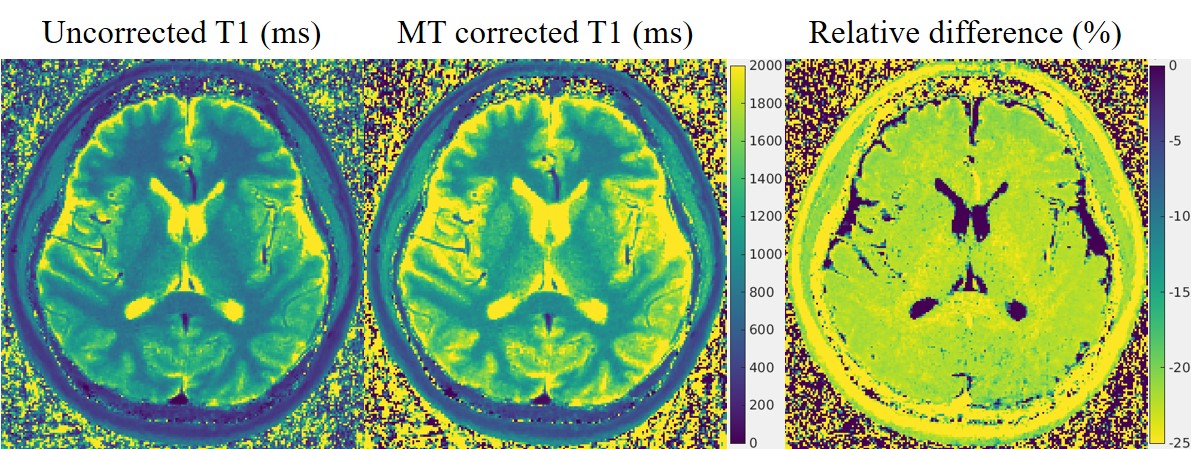
In Figure 3 we present results from the in vivo experiment. The left most image shows the T1 map from a traditional T1 reconstruction, the middle image presents the T1 map with MT effect corrected. The relative difference between these two T1 maps are calculated and presented to the right. As can be seem there is a significant underestimation in the T1 map that does not take MT effect into consideration.
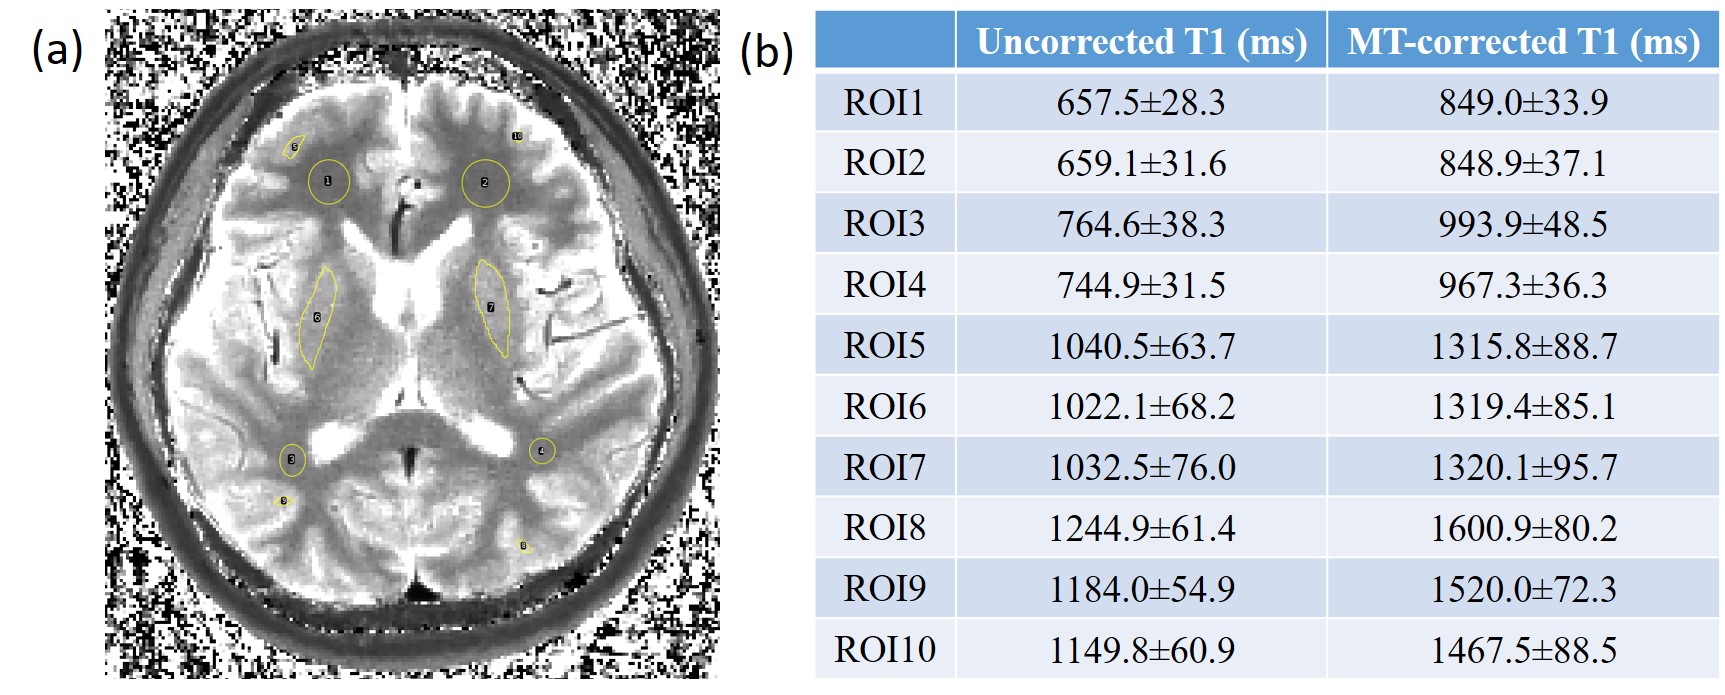
The underestimation is further demonstrated in an ROI analysis shown in Figure 4. Ten ROIs are drawn in the T1 map as presented in the Figure 4(a), and the mean values and standard deviations for the ROIs are presented in Figure 4(b).
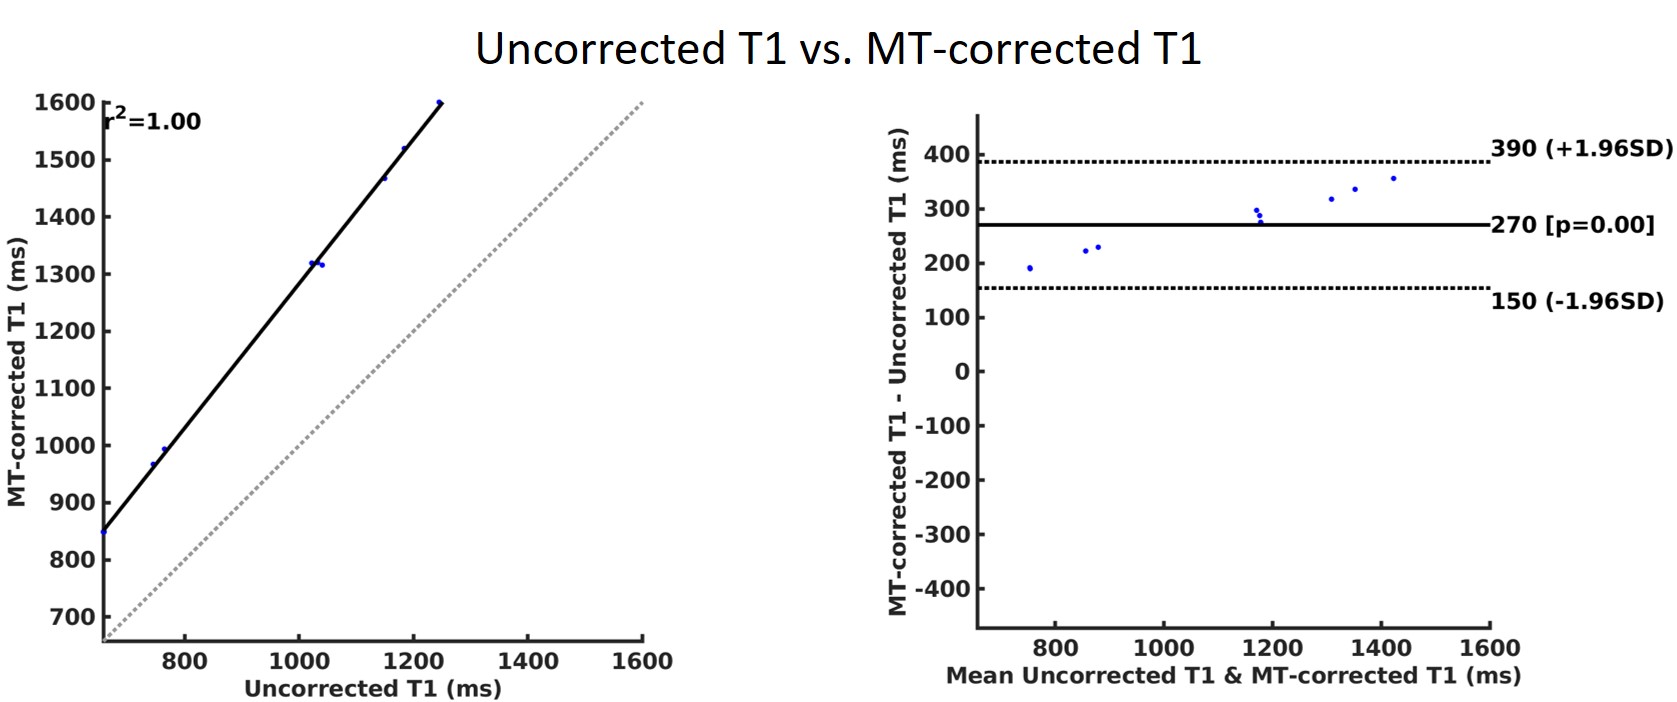
A Bland-Altman analysis for the mean values of the ROIs are also presented in Figure 5. An average of 25% T1 estimation bias can be observed in the T1 map with and without MT effect correction.
Discussion and Conclusion
In this work a MT effect corrected T1 mapping technique is presented. With this new technique, underestimations in the T1 due to MT effect can be removed. The small overestimation in the MT corrected T1 map is likely due to our curve fitting treated other MT related parameters as nuisance parameters. A future work that can more accurately estimate the MT related parameters may help reducing this bias.Acknowledgements
This work was supported in part by NIH research grants: R01-EB009690, U01-EB029427 and GE Healthcare.References
1. Polak JF, Vivaldi MT, Schoen FJ. Proton magnetic resonance of early myocardial infarction in rats. Invest Radiol. 1988;23(6):428-432. doi:10.1097/00004424-198806000-00004
2. Kim KA, Park MS, Kim IS, et al. Quantitative evaluation of liver cirrhosis using T1 relaxation time with 3 tesla MRI before and after oxygen inhalation. J Magn Reson Imaging. 2012;36(2):405-410. doi:10.1002/jmri.23620
3..... Stanisz GJ, Webb S, Munro CA, Pun T, Midha R. MR properties of excised neural tissue following experimentally induced inflammation: MR Parameters Change During Inflammation. Magn Reson Med. 2004;51(3):473-479. doi:10.1002/mrm.20008
4. Woermann FG, Free SL, Koepp MJ, Ashburner J, Duncan JS. Voxel-by-voxel comparison of automatically segmented cerebral gray matter - A rater-independent comparison of structural MRI in patients with epilepsy. NeuroImage. 1999;10(4):373-384. doi:10.1006/nimg.1999.0481
5. Messroghli DR, Radjenovic A, Kozerke S, Higgins DM, Sivananthan MU, Ridgway JP. Modified look-locker inversion recovery (MOLLI) for high-resolution T 1 mapping of the heart. Magn Reson Med. 2004;52(1):141-146. doi:10.1002/mrm.20110
6. Piechnik SK, Ferreira VM, Dall’Armellina E, et al. Shortened Modified Look-Locker Inversion recovery (ShMOLLI) for clinical myocardial T1-mapping at 1.5 and 3 T within a 9 heartbeat breathhold. J Cardiovasc Magn Reson. 2010;12(1):1-11. doi:10.1186/1532-429X-12-69
7. Li Z, Bilgin A, Johnson K, et al. Rapid high-resolution T1 mapping using a highly accelerated radial steady-state free-precession technique. J Magn Reson Imaging. 2019;49(1):239-252. doi:10.1002/jmri.26170
8. Li Z, Mathew M, Syed AB, Pauly JM, Vasanawala SS. Rapid fat-water separated T 1 mapping using a single-shot radial inversion-recovery spoiled gradient recalled pulse sequence. NMR Biomed. 2022;(July):1-17. doi:10.1002/nbm.4803
9. Kellman P, Hansen MS. T1-mapping in the heart: Accuracy and precision. J Cardiovasc Magn Reson. 2014;16(1):1-20. doi:10.1186/1532-429X-16-2
10. Robson MD, Piechnik SK, Tunnicliffe EM, Neubauer S. T1 measurements in the human myocardium: The effects of magnetization transfer on the SASHA and MOLLI sequences: Magnetization Transfer Effects on Cardiac T1 Mapping. Magn Reson Med. 2013;70(3):664-670. doi:10.1002/mrm.24867
11. Malik SJ, Teixeira RPAG, Hajnal J V. Extended phase graph formalism for systems with magnetization transfer and exchange. Magn Reson Med. 2018;80(2):767-779. doi:10.1002/mrm.27040
12. Gloor
M, Scheffler K, Bieri O. Quantitative magnetization transfer imaging using
balanced SSFP. Magn Reson Med.
2008;60(3):691-700. doi:10.1002/mrm.21705
Figures