3279
Simultaneous Neuromelanin Sensitive Imaging and Quantitative Susceptibility Mapping by 3D Multi-echo GRE sequence with Optimized MTC Pulse
Mengying Chen1, Yupeng Wu1, Qifan Pang1, Haodong Zhong1, Gaiying Li1, Yang Song2, Yi Wang3, and Jianqi Li1
1Shanghai Key Laboratory of Magnetic Resonance, East China Normal University, Shanghai, China, 2MR Scientific Marketing, Siemens Healthineers, Shanghai, China, 3Department of Radiology, Weill Medical College of Cornell University, New York, NY, United States
1Shanghai Key Laboratory of Magnetic Resonance, East China Normal University, Shanghai, China, 2MR Scientific Marketing, Siemens Healthineers, Shanghai, China, 3Department of Radiology, Weill Medical College of Cornell University, New York, NY, United States
Synopsis
Keywords: CEST & MT, Magnetization transfer, Neuromelanin
Although 3D magnetization transfer contrast (MTC) GRE sequence can image neuromelanin and magnetic susceptibility simultaneously, MTC saturation pulse takes too long time, and whether MTC affects accuracy of the susceptibility is unclear. Six subjects were scanned using 3D multi-echo GRE sequences with different durations of MTC pulse. 3D GRE sequence with 5ms of MTC pulse provided same saturation effects in highlighting neuromelanin as 10ms of MTC pulse, and yielded susceptibility values in the deep gray matter nuclei similar to sequence without MTC pulse. Short MTC pulse provides a practical means to simultaneously image the neuromelanin and magnetic susceptibility.Introduction
Parkinson disease (PD) is characterized pathologically by early neurodegeneration of neuromelanin (NM) in the substantia nigra pars compacta (SNpc) and increased iron deposition in the substantia nigra (SN) 1,2. Neuromelanin sensitive MRI(NM-MRI) can quantify loss of dopaminergic neurons, and quantitative susceptibility mapping (QSM) can quantify iron deposition3,4. Although 3D magnetization transfer contrast (MTC) GRE sequence can image NM and magnetic susceptibility simultaneously5, MTC saturation pulse takes too long time, and whether MTC affects the accuracy of magnetic susceptibility is unclear. The purpose of this study is to reduce the imaging time by shortening the duration of MTC saturation pulse, and explore the impact of MTC duration on the signal-to-noise ratio (CNR) of SN in magnitude images and susceptibility value of the deep grey matter nuclei.Materials and Methods
Six healthy volunteers (4 males and 2 females, aged between 22–25 years old) were scanned on a clinical 3T MR imaging system (Siemens Magnetom Prisma Fit) equipped with a 64-channel head matrix coil. The imaging protocol included the following pulse sequences.1) A 3D GRE sequence with MTC pulse lasting for 10 ms (MTC-10ms): TR = 55 ms, TE1 = 4.02 ms, ΔTE = 5.29 ms, number of echoes = 6, FA = 12˚, matrix size = 192 × 288, FOV = 230 × 192 mm2, number of slices = 80, voxel size = 0.8 × 0.8 × 2.0 mm3, MTC Gauss pulse (FA = 500°, 1.2 kHz off-resonance). The total scan time was 5 min 33 sec.
2) A 3D GRE sequence with MTC pulse lasting for 5 ms (MTC-5ms): TR = 50 ms, the total scan time = 5 min 03 sec. The other imaging parameters were consistent with the MTC-10ms.
3) A 3D GRE sequence without MTC pulse (MTC-Off): TR = 40 ms, the total scan time = 4 min 02 sec. The other imaging parameters were consistent with the MTC-10ms.
To evaluate CNR of the SN in NM sensitive images, the regions-of-interests (ROIs) were placed on the slice that displays NM most clearly and manually drawn on the MTC magnitude images of the first echo using ITK-SNAP (http://www.itk-snap.org), as illustrated in Fig. 1A. All ROIs are circles with diameter in 3.2 mm. The CNR of the NM in the SN compared to surrounding tissues was defined as:$$CNR_{SN}=(S_{SN}-S_{ref})/SD_{ref} $$where SSN is the mean signal intensity values from the ROIs in the SN, and Sref and SDref are the mean and variance values of signal intensity from the ROIs in the reference regions, respectively6. We chose the adjacent white matter as the reference regions. These bilateral CNR values were then averaged to give the CNRSN of the selected slice.
The susceptibility maps were reconstructed using the Morphology Enabled Dipole Inversion with automatic uniform cerebrospinal fluid zero reference (MEDI+0) algorithm7. The ROIs, including caudate nucleus (CN), globus pallidus (GP), putamen (PUT), SN, red nucleus (RN), and dentate nucleus (DN) were drawn manually on the QSM images using ITK-SNAP, as illustrated in Fig. 1B-D.
Pair-wise comparisons among the two sequences were performed using the nonparametric related-samples Wilcoxon signed rank test. All statistical analyses were carried out using IBM SPSS Statistics 23 and MATLAB R2016b (MathWorks, MA, USA) based program.
Results
MTC-5ms and MTC-10ms sequences provided equivalent saturation effects in highlighting NM content in magnitude images of first TE (Fig. 2). There was no group statistically significant difference in estimations of CNR of SN (P = 0.713), as shown in Fig. 3. The mean SAR values of MTC-5ms and MTC-10ms sequences are 91% and 44.5%, respectively, which are within the SAR limit.For quantitative comparison of susceptibility values in the deep gray matter nuclei, slope of the linear regression (k = 0.96) between the MTC-5ms and MTC-Off sequences was close to unity and the intercept (y0 = 0.002) was close to zero. The correlation coefficient (R2 = 0.946) was also close to 1, indicating good agreement between the MTC-5ms and MTC-Off susceptibility measurements (Fig. 4A). The Bland– Altman plot exhibited no significant bias or trend between the MTC-5ms and MTC-Off sequences (Fig. 4B). The 95 % limit of agreement between the MTC-5ms and MTC-off sequences ranged from −0.014 to 0.013 ppm for the six subjects.
Discussion
The purpose of this study was to develop a fast MRI sequence to obtain neuromelanin content and quantitative susceptibility value simultaneously. MTC-5ms sequence provided same saturation effects in highlighting NM content as MTC-10ms sequence, and yielded susceptibility values in the deep gray matter nuclei similar to MTC-Off sequence. Moreover, MTC-5ms is more efficient than MTC-10ms sequence while bringing an increase in SAR values, which are allowed by the SAR limit. The on-resonance bi-nominal RF pulse is also time-efficient and can obtain comparable NM enhancement in the SN5. We will evaluate image quality by 3D GRE sequence with short off-resonance Gauss and on-resonance bi-nominal RF pulses in the future.Conclusion
In conclusion, GRE sequence with short MTC pulse provides a practical means to simultaneously obtain the neuromelanin sensitive images and quantitative susceptibility maps, which may be used to in future studies of Parkinson’s disease and other diseases.Acknowledgements
No acknowledgement found.References
1. Greenfield J G, Bosanquet F D. The brain-stem lesions in Parkinsonism[J]. J Neurol Neurosurg Psychiatry, 1953, 16(4): 213-26.2. Graham J M, Paley M N, Grunewald R A, et al. Brain iron deposition in Parkinson's disease imaged using the PRIME magnetic resonance sequence[J]. Brain, 2000, 123 Pt 12: 2423-31.
3. Sasaki M, Shibata E, Tohyama K, et al. Neuromelanin magnetic resonance imaging of locus ceruleus and substantia nigra in Parkinson's disease[J]. Neuroreport, 2006, 17(11): 1215-8.
4. Azuma M, Hirai T, Yamada K, et al. Lateral Asymmetry and Spatial Difference of Iron Deposition in the Substantia Nigra of Patients with Parkinson Disease Measured with Quantitative Susceptibility Mapping[J]. AJNR Am J Neuroradiol, 2016, 37(5): 782-8.
5. Jin Z, Wang Y, Jokar M, et al. Automatic detection of neuromelanin and iron in the midbrain nuclei using a magnetic resonance imaging based brain template[J]. Human Brain Mapping, 2022, 43(6): 2011-2025.
6. Chen X, Huddleston D E, Langley J, et al. Simultaneous imaging of locus coeruleus and substantia nigra with a quantitative neuromelanin MRI approach[J]. Magn Reson Imaging, 2014, 32(10): 1301-6.
7. Liu Z, Spincemaille P, Yao Y, et al. MEDI+0: Morphology enabled dipole inversion with automatic uniform cerebrospinal fluid zero reference for quantitative susceptibility mapping[J]. Magn Reson Med, 2018, 79(5): 2795-2803.
Figures
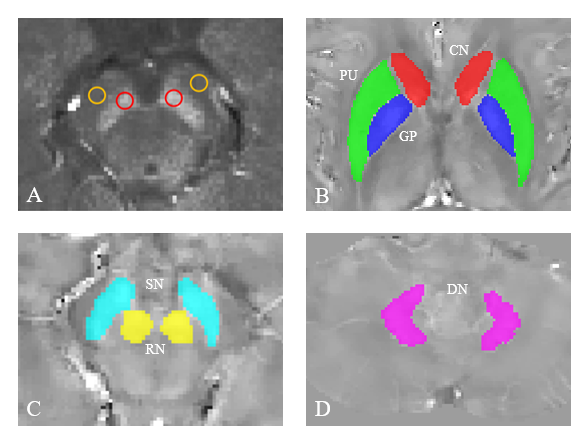
Fig. 1 Regions of interests (ROIs) for quantitative analysis of tissue contrast in neuromelanin (NM) sensitive images and susceptibility values in QSM images. (A) ROIs for NM analysis. Red and yellow circles were drawn for substantia nigra and reference areas, respectively. (B-D) ROIs for QSM analysis. CN, caudate nucleus; PU, putamen; GP, globus pallidus; RN, red nucleus; SN, substantia nigra; DN dentate nucleus.
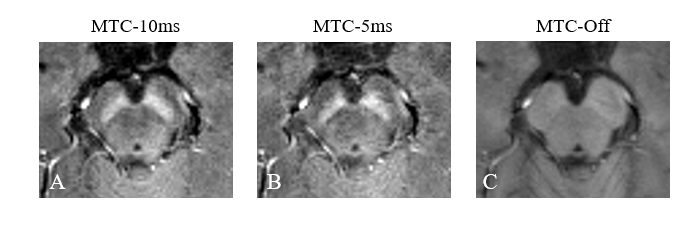
Fig. 2 The magnitude images with TE of 4.02 ms acquired by three different sequences. (A) 3D GRE sequence with MTC pulse lasting for 10 ms (MTC-10ms); (B) 3D GRE sequence with MTC pulse lasting for 5 ms (MTC-5ms); (C) 3D GRE sequence without MTC pulse (MTC-Off).
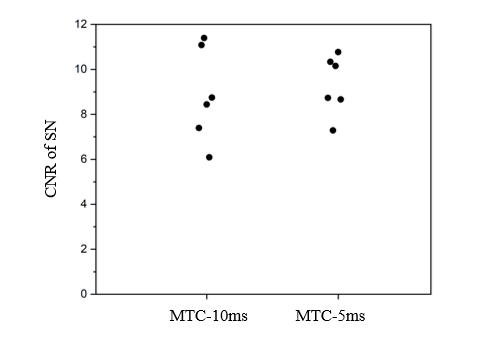
Fig. 3 The contrast-to-noise ratios (CNRs) between substantia nigra (SN) and surrounding reference area in neuromelanin sensitive images acquired with two different MTC pulses. The dots in the plots represent individual subjects.
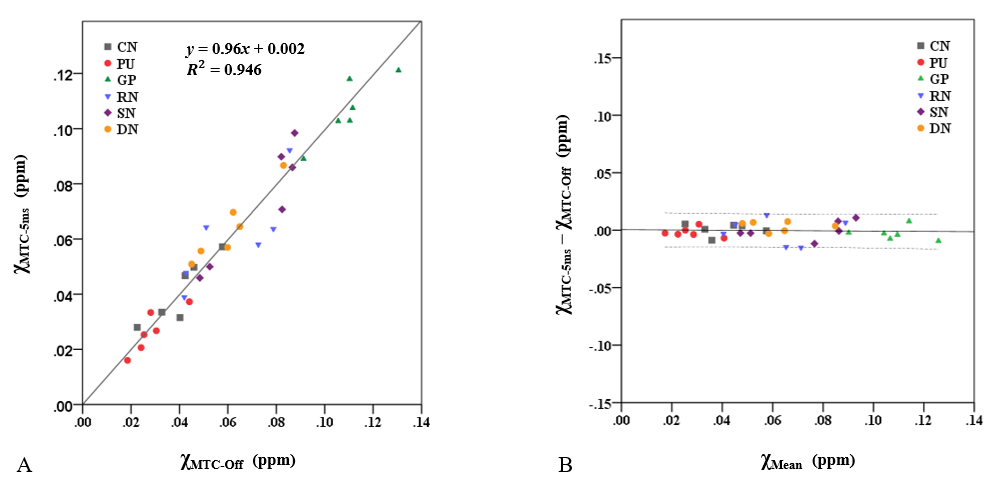
Fig. 4 Linear regression (A) and Bland–Altman (B) analysis demonstrate excellent agreement between MTC-5ms sequence and MTC-Off sequence on regional susceptibility measurements. The solid and dotted lines in (A) are the trend line of the linear regression and the line of equality, respectively. The solid and dotted lines in (B) indicate the mean difference and ±1.96 times the standard deviation of the difference, respectively.
DOI: https://doi.org/10.58530/2023/3279