3278
Asymmetric magnetization transfer ratio of locus coeruleus with sleep disorder: A 7T MRI study1Institute of Science and Technology for Brain-inspired Intelligence,Fudan university, Shanghai, China, 2MR Collaboration, Siemens Healthineers Ltd., Shanghai, China, 3Center of Naval Special Medicine, Naval Medical University, Shanghai, China, 4Key Laboratory of Computational Neuroscience and Brain-Inspired Intelligence (Fudan University), Ministry of Education, Shanghai, China
Synopsis
Keywords: CEST & MT, Magnetization transfer, locus coeruleus, magnetization transfer ratio, neuromelanin sensitive MRI
Neuromelanin (NM), mainly found in locus coeruleus (LC), is a well-known biomarker for neurodegenerative diseases such as Parkinson's disease (PD) and can be detected with neuromelanin-sensitive MRI (NM-MRI). However, whether NM content is associated with sleep disorders is largely unclear. We acquired 3D turbo flash MTC images from 20 normal and four dyssomnia adult males in a 7T scanner to examine the relationship between the sleep quality scores and the NM content in LC. Our preliminary results reveal that the magnetization transfer ratio (MTR), an indicator of NM concentration, of bilateral LC is significantly asymmetric in the dyssomnia group, and the mean value of MTR is lower in the left LC and higher in the right LC in dyssomnia group than normal group.
Introduction
The locus coeruleus (LC) in the brainstem constitutes the primary source of norepinephrine for the central nervous system and is a crucial arousal-promoting nucleus of the sleep-wake circuitry 1. Neuromelanin (NM) as an endogenous MR contrast agent can help distinguish LC in MR scans and decreased content NM has been recognized as a biomarker for neurodegeneration, such as Parkinson's disease (PD) 2-5. Previous findings suggest that NM depletion can also be associated with sleep disorders in PD 6, and a lateralization effect between left and right LC NM contrast ratio was reported 7. Nonetheless, whether changes in NM concentration are associated with sleep disorders alone is worth exploring. In this study, we used a prototype magnetization transfer-weighted 3D turbo flash sequence (MT-TFL) at 7T to reflect the level of neuromelanin in LC and explored the correlation between their sleep quality scores and NM content.Method
A prototype MT-TFL sequence was used in this study: (TR = 1200ms, TE = 3.48ms, flip angle = 8°, voxel size = 0.5 mm isotropic, number of slices = 176, partial Fourier = 6/8, center-out k-space sampling, TA ~ 7 min). The MT preparations consisted of a train of 20 Gaussian-shape RF-pulses at 6.72 ppm frequency offset (pulse-to-pulse time = 10ms, individual pulse length = 5.12 ms, flip-angle = 400°). Twenty-four participants (mean age 27.54 ± 4.755) were enrolled and scanned at a 7T MRI scanner (MAGNETOM Terra; Siemens Healthineers, Erlangen, Germany) using MTON and MT-OFF (identical to MTON without MT preparation). Twenty participants have Pittsburgh Sleep Quality Index (PSQI) scores of <7, and four have ≥7. The magnetization transfer ratios (MTR) map was calculated as MTR = ((MTOFF - MTON)/ MTOFF)*100%. An experienced radiologist manually drew the ROI of the LC in 3D Slicer (https://www.slicer.org/) based on the neuromelanin contrast in the native space of each participant (Figure 1). The contrast to noise ratio (CNR) map was computed based on the MT-on image for each subject as $$$𝐶𝑁𝑅 = (𝑉 – mean(𝑅𝐸𝐹))/ 𝑆𝐷(𝑅𝐸𝐹)$$$, which V denoted voxel value of LC and 𝑅𝐸𝐹 was the mean intensity of pons. Statistical analysis was performed with SPSS Version 20 (IBM Inc., Armonk, NY, USA). Paired t-tests were performed to examine the signal asymmetry between LC's left and right sides.Result
The difference between left and right LC MTR values in the dyssomnia group was significant (p=0.029) (Figure 2). The mean MTR values of the dyssomnia group (mean= 0.143, SD=0.002) were larger than those of the normal group (mean=0.129, SD=0.028) in the right LC, and the mean MTR values of the dyssomnia group (mean 0.115, SD=0.013) were smaller than that of the normal group (mean=0.124, SD=0.032) in left LC. However, there is no significant difference between volume size or CNR.Discussion
Our preliminary results from 24 adult males (20 normal, four dyssomnia) showed asymmetry of MTR values between the left and right LC in the dyssomnia group. The mean MTC value of the left LC was lower, and the right LC was higher in the dyssomnia group than in the normal group. These findings shed light on the current understanding of sleep disturbances and the content of NM in the LC. Although there was no significant difference in the volume of the LCs between the two groups, MTR values were significantly asymmetric between the left and right LCs in the dyssomnia group. These results suggest that although a reduction in LC volume, which is commonly observed in patients of PD or AD 3,8-11 is not found in patients with sleep disorders alone, but changes in the NM content of the LC can be observed.As the number of participants in this preliminary study is still relatively small, we will collect more data to confirm this finding in the future.
Conclusion
The MTR of neuromelanin-sensitive magnetic resonance imaging might be an imaging biomarker of sleep quality. Our preliminary results show that the asymmetry of MTR values between the left and right LC in the dyssomnia group is significant.Acknowledgements
No acknowledgement found.References
1. Aston-Jones et al. Role of the locus coeruleus-norepinephrine system in arousal and circadian regulation of the sleep–wake cycle. In G. Ordway, M. Schwartz, & A. Frazer (Eds.), Brain Norepinephrine: Neurobiology and Therapeutics 2007,157-195.Cambridge: Cambridge University Press.
2. Liebe T., et al. In vivo anatomical mapping of human locus coeruleus functional connectivity at 3 T MRI. Hum Brain Mapp. 2020 Jun 1;41(8):2136-2151.
3. Chen X., et al. Simultaneous imaging of locus coeruleus and substantia nigra with a quantitative neuromelanin MRI approach. Magn Reson Imaging. 2014 Dec;32(10):1301-6.
4. Sasaki et al. Neuromelanin magnetic resonance imaging of locus ceruleus and substantia nigra in Parkinson's disease. Neuro Report. 2006 July 31; 17(11):1215-1218.
5. Toshiki N., et al. Visualization of Neuromelanin in the Substantia Nigra and Locus Ceruleus at 1.5T Using a 3D-gradient Echo Sequence with Magnetization Transfer Contrast, Magnetic Resonance in Medical Sciences.2008;7(4): 205-210.
6. Thannickal TC., et al. Hypocretin (orexin) cell loss in Parkinson's disease. Brain. 2007;130: 1586–1595.
7. Liu, Kathy Y., et al. "In vivo visualization of age-related differences in the locus coeruleus." Neurobiology of aging. 2019;74: 101-111.
8. Castellanos G., et al. Automated neuromelanin imaging as a diagnostic biomarker for Parkinson's disease. Mov Disorder. 2015 Jun;30(7):945-52.
9. Schwarz ST., et al. In Vivo Assessment of Brainstem Depigmentation in Parkinson Disease: Potential as a Severity Marker for Multicenter Studies. Radiology. 2017 Jun;283(3):789-798.
10. Theofilas P., et al. Locus coeruleus volume and cell population changes during Alzheimer’s disease progression: a stereological study in human postmortem brains with potential implication for early‐stage biomarker discovery. Alzheimer’s Dementia. 2017;13(3):236-246.
11. Sun W., et al. A probabilistic atlas of locus coeruleus pathways to transentorhinal cortex for connectome imaging in Alzheimer’s disease. NeuroImage 2020 Dec;223:117301.
Figures
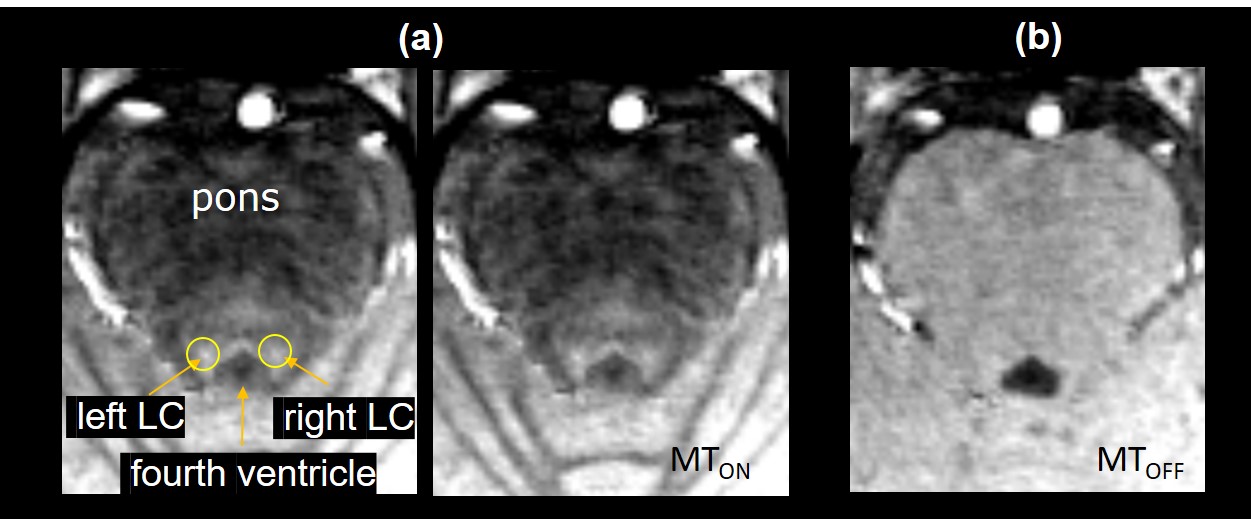
Figure 1. (a) Neuromelanin sensitive MT-TFL image (MTON). (b) TFL image with the same imaging parameter as MT-TFL without MT preparation (MTOFF). Anatomical structures are marked in (a): left and right locus coeruleus (LC), pons, and fourth ventricle.
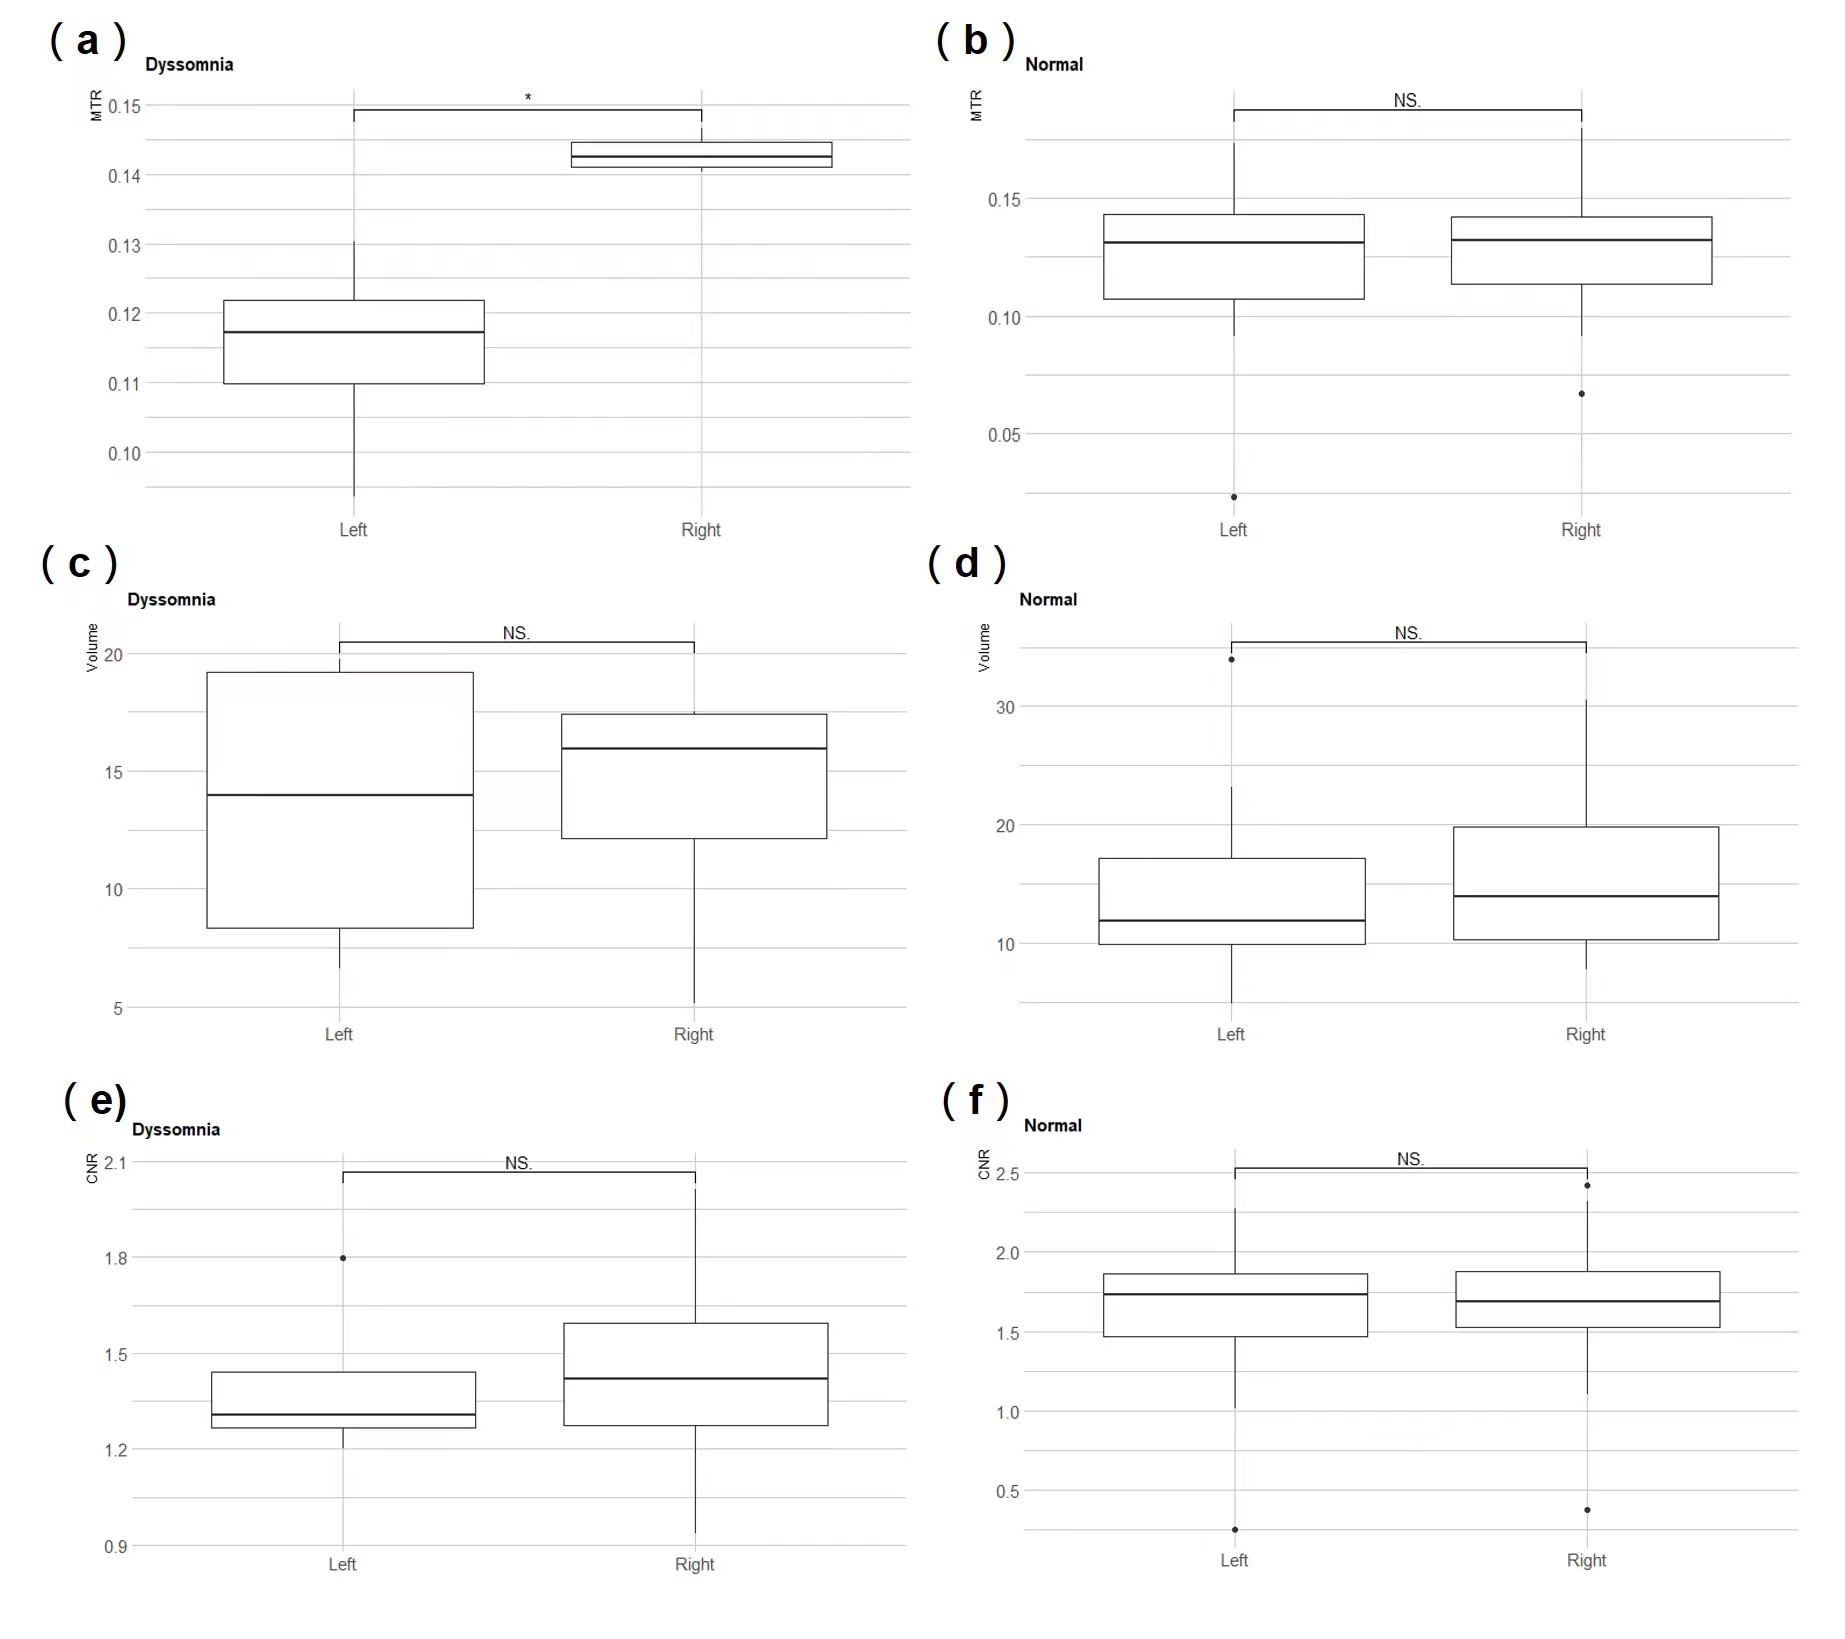
Figure 2. Box plots of the MTR value of the left and right LC in the Dyssomnia group(a) and in the Normal group(b). The volume values of the left and right LC were shown in the Dyssomnia group(c) and the Normal group(d). The CNR values can be found in (e, f).