3276
Imaging magnetization exchange between cerebrospinal fluid and brain parenchyma in humans at 3 T1Advanced Imaging Research Center, UT Southwestern Medical Center, Dallas, TX, United States
Synopsis
Keywords: Magnetization transfer, Neurofluids
Imaging mass exchange between cerebrospinal fluid (CSF) and brain parenchyma tissue is promising for enhancing our understanding about the role of CSF in clearance of metabolic waste and contributes to clinical diagnosis of neurological disorders and degeneration. In this study, we evaluated the feasibility of achieving this goal based on the magnetization transfer effect and CSF-selective spin echo contrast at 3 T in human subjects. The results suggested that techniques with low sensitivity to flow and partial volume effect are required for robust clinical application.Introduction
Mass exchange between cerebrospinal fluid (CSF) and brain parenchyma contributes to clearance of metabolic waste specifies which are risk factors of dementia [1]. Recently, imaging the water exchange noninvasively based on the magnetization transfer (MT) effect was demonstrated using mouse models of different age [2]. Because of the very different ventricle size and CSF velocity between mice and humans, it remains to be seen whether this contrast mechanism can be a useful tool for clinical applications. Here, we measured the MT saturation ratio (MTR) in CSF at 3 T.Methods
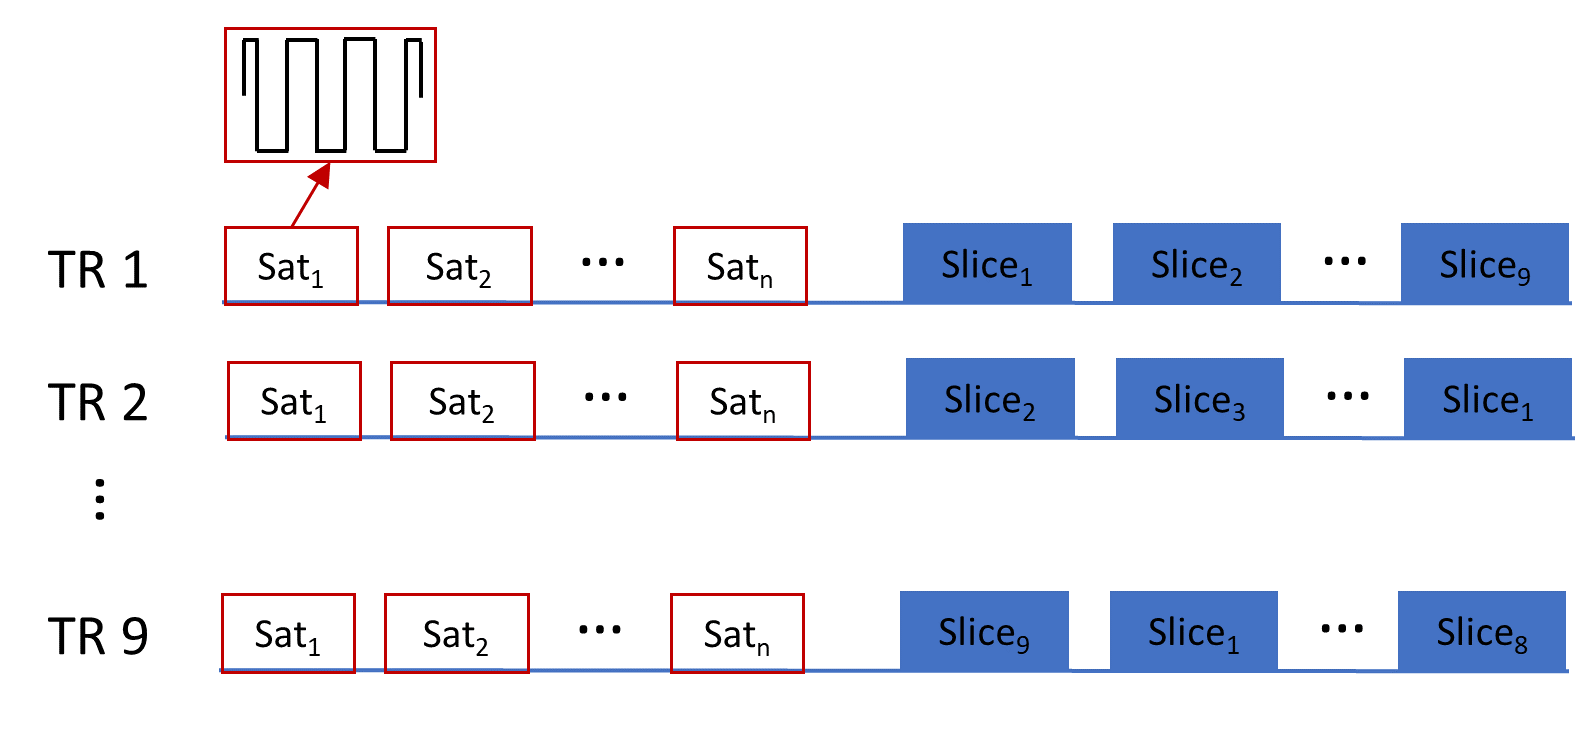
MRI experimentsExperiments were performed on a 3 T MRI scanner (Prisma, Siemens). Two young male subjects were enrolled according to an approved local IRB protocol. To selectively saturate parenchyma tissue, a series of on-resonance short T2-selective saturation pulses [3] were applied before image acquisition in 9 slices at 9 delay times (TD: 7 ms, 0.4, 0.8, 1.2, 1.6, 2, 3, 4 and 5 s) as shown in Fig. 1. The slice order was shifted over repetitions (TR) to acquire the saturation recovery signal at different TDs for all slices. Each block of saturation pulse was 6 ms long and included 16 hard pulses with an RF amplitude of 19.6 μT. Twelve such blocks were performed with a period of 250 ms in oneTR. Spin-echo (SE) images were acquired with a single shot EPI readout using a SENSE factor of 3, in-plane resolution of 2.5x2.5 mm2, slice thickness of 3 mm at five echo times (TE: 30, 60, 90, 160 and 320 ms). A control scan was carried out by turning off the saturation pulses.
Data analysis
The saturation ratio due to MT (MTR) was calculated based on the magnitude of the images from the saturation ON and OFF scans as 1-MagON/MagOFF, for each TE respectively. A CSF mask was generated based on the magnitude image at TE=320 ms. The decay rate R2 was calculated using least square nonlinear fitting of the multi-echo magnitude data at each TD. Variation of R2 across TDs was calculated. The rationale was that CSF voxels that were contaminated by tissue signal would show a TD (or saturation)-dependent R2 variation. CSF voxels were ranked based on this R2 variation level in five bins. The bin with the lowest variation was considered to encompass the least amount of partial volume effect from tissue.
Results
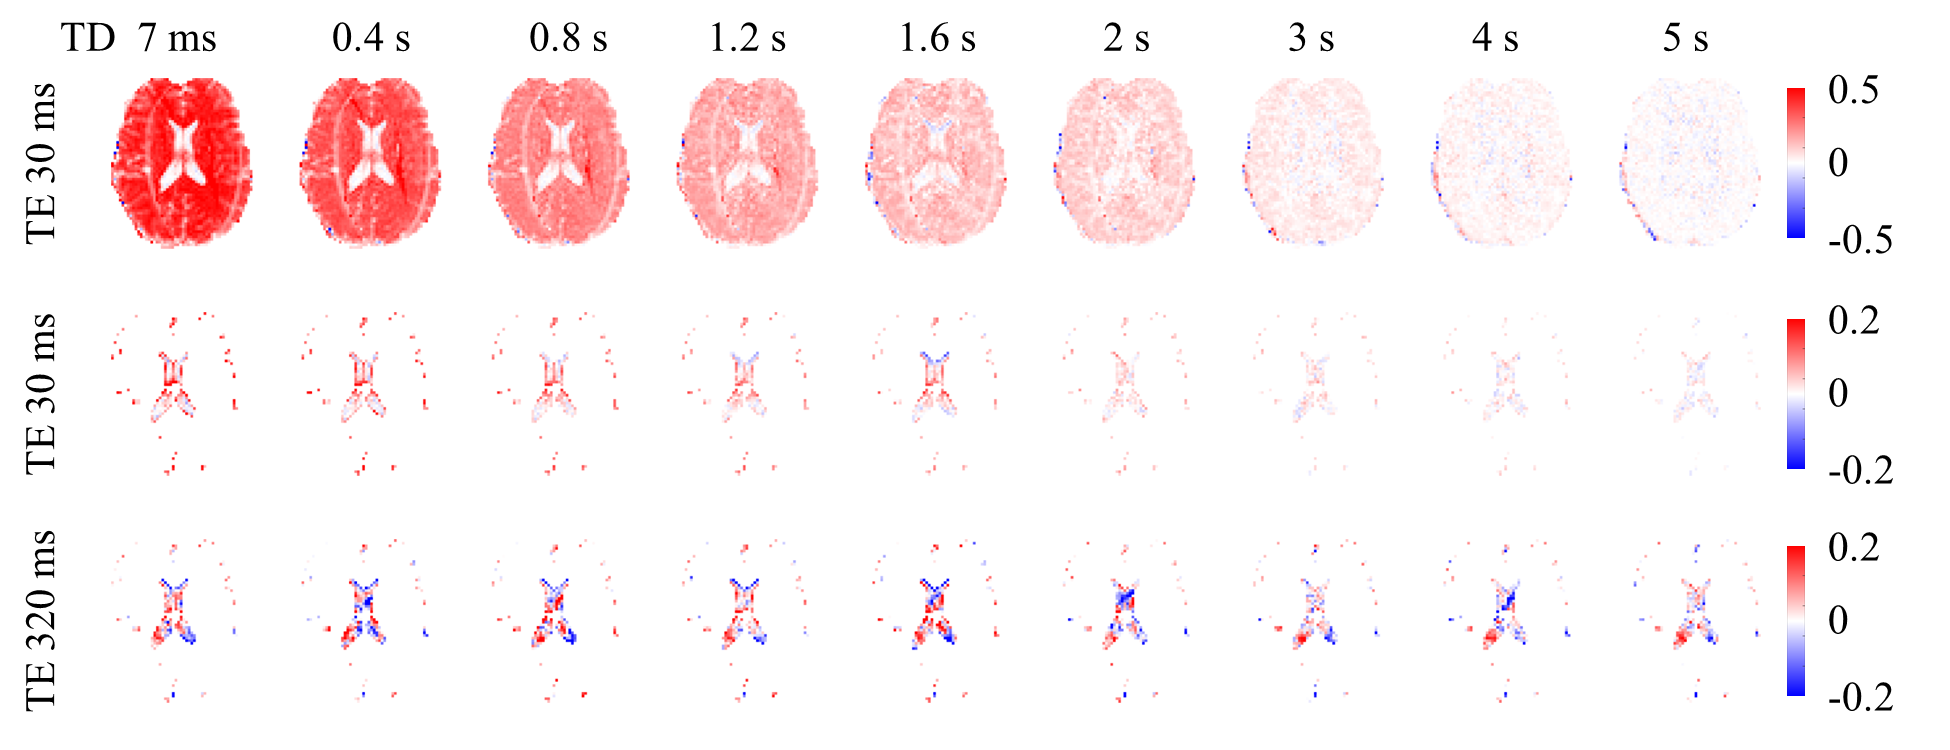
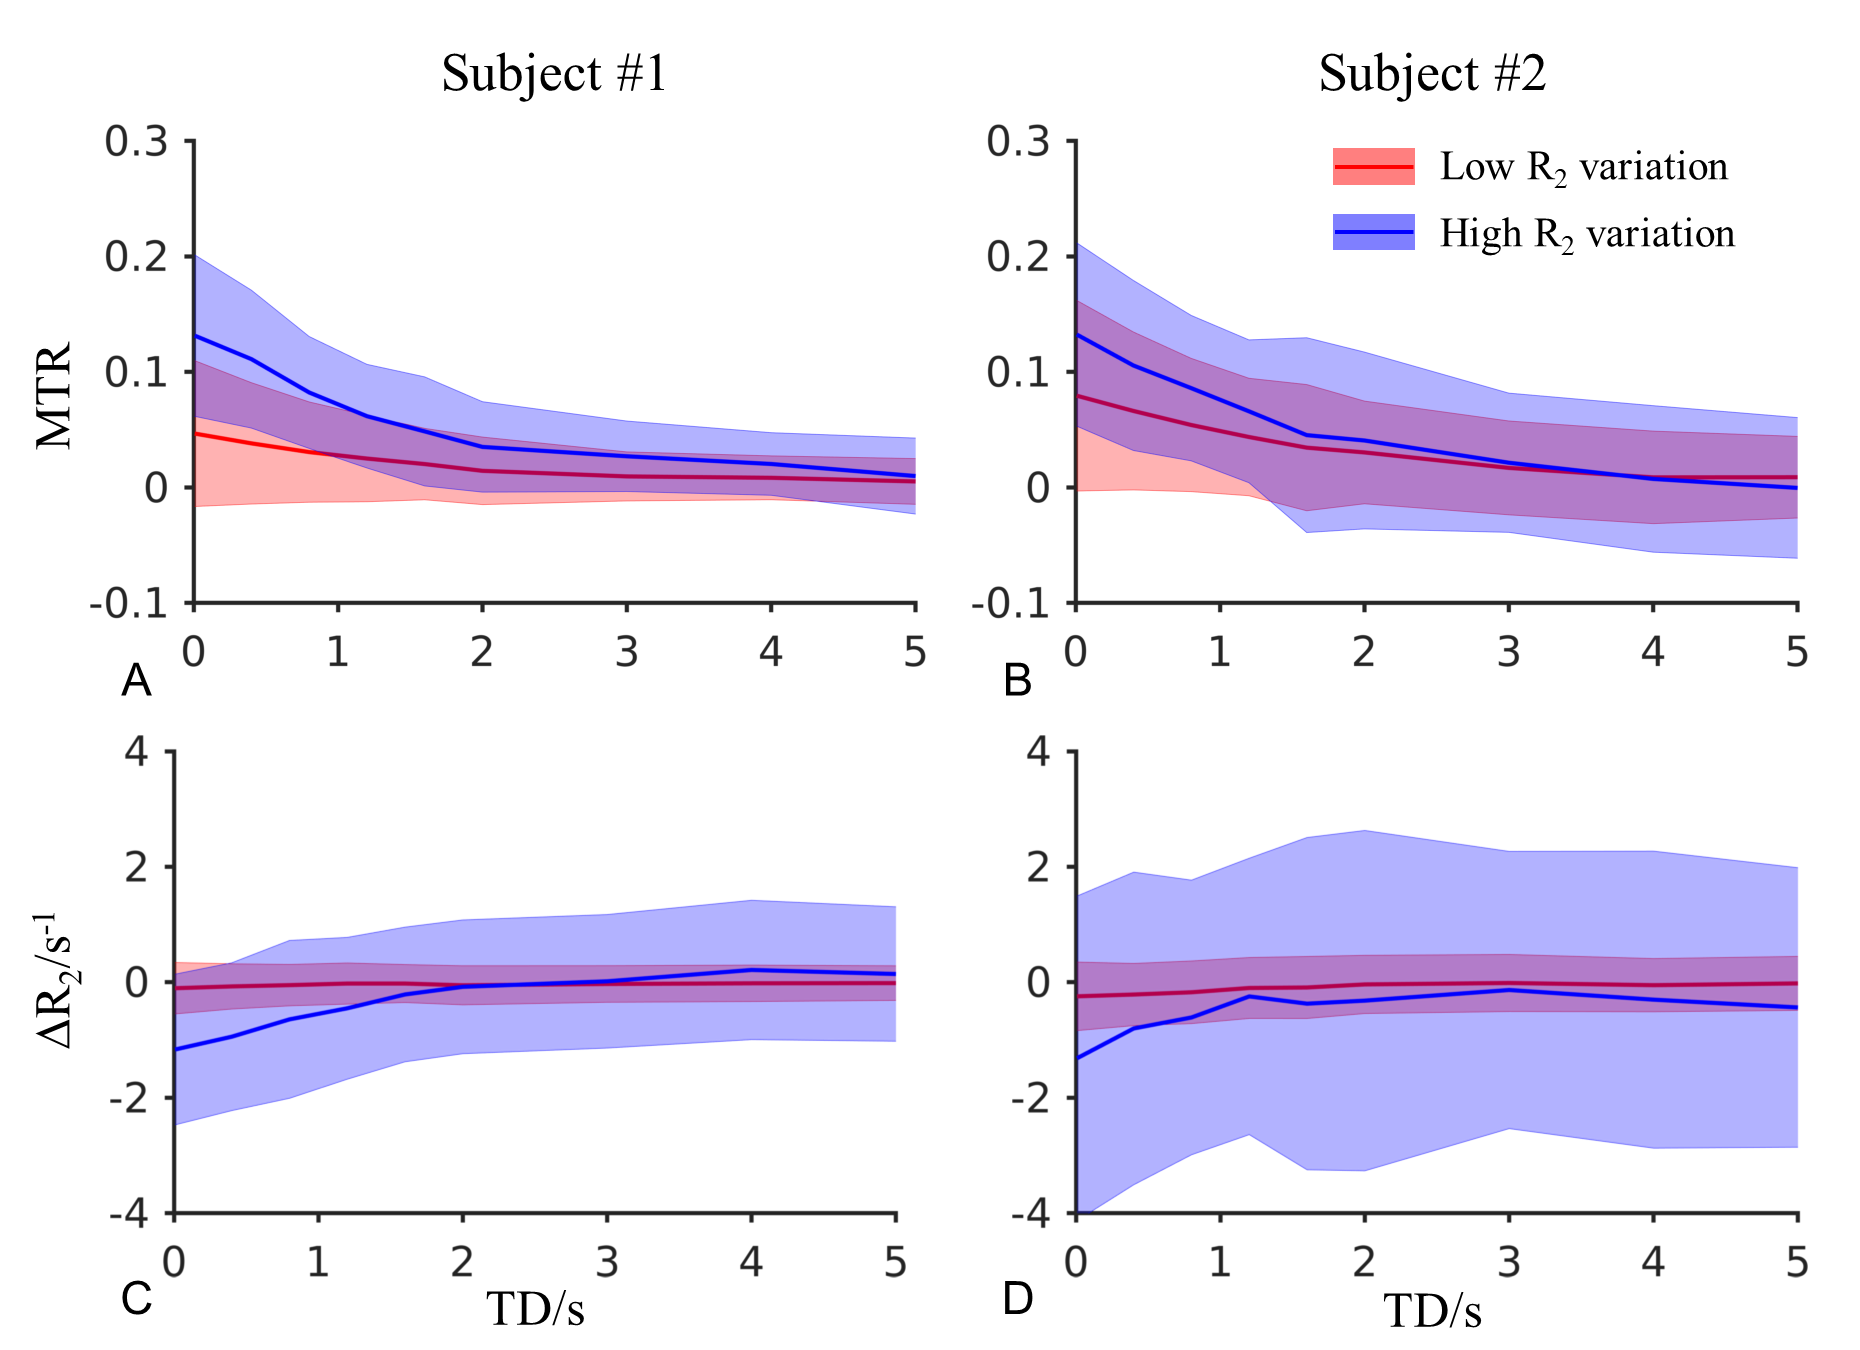
Fig. 2 shows the saturation level of MTR from one slice of one subject at different TEs and TDs. About 50% MTR was introduced in brain parenchyma at TD=7 ms and decreased at higher TDs (Fig. 2 top). In CSF voxels, those showing the highest MTR were near the border of the lateral ventricle or in the subarachnoid space around the brain (Fig. 2 middle). Interestingly, MTR in CSF voxels with the long TE=320 ms showed higher levels of positive and negative values, suggesting stronger signal instability (Fig. 2 bottom, see discussion).To isolate the partial volume effect, MTR at TE=30 ms from CSF voxels in the bins of the lowest and highest R2 variation are shown in Fig. 3 for two subjects, along with the difference of R2 relative to the control scan. It can be seen that the mean MTR from the low variation bin was 5% and 7% in the subjects at the first TD. There was a trend of saturation-induced R2 decrease at shorter TDs, especially in the high variation group, possibly due to the partial volume effect.
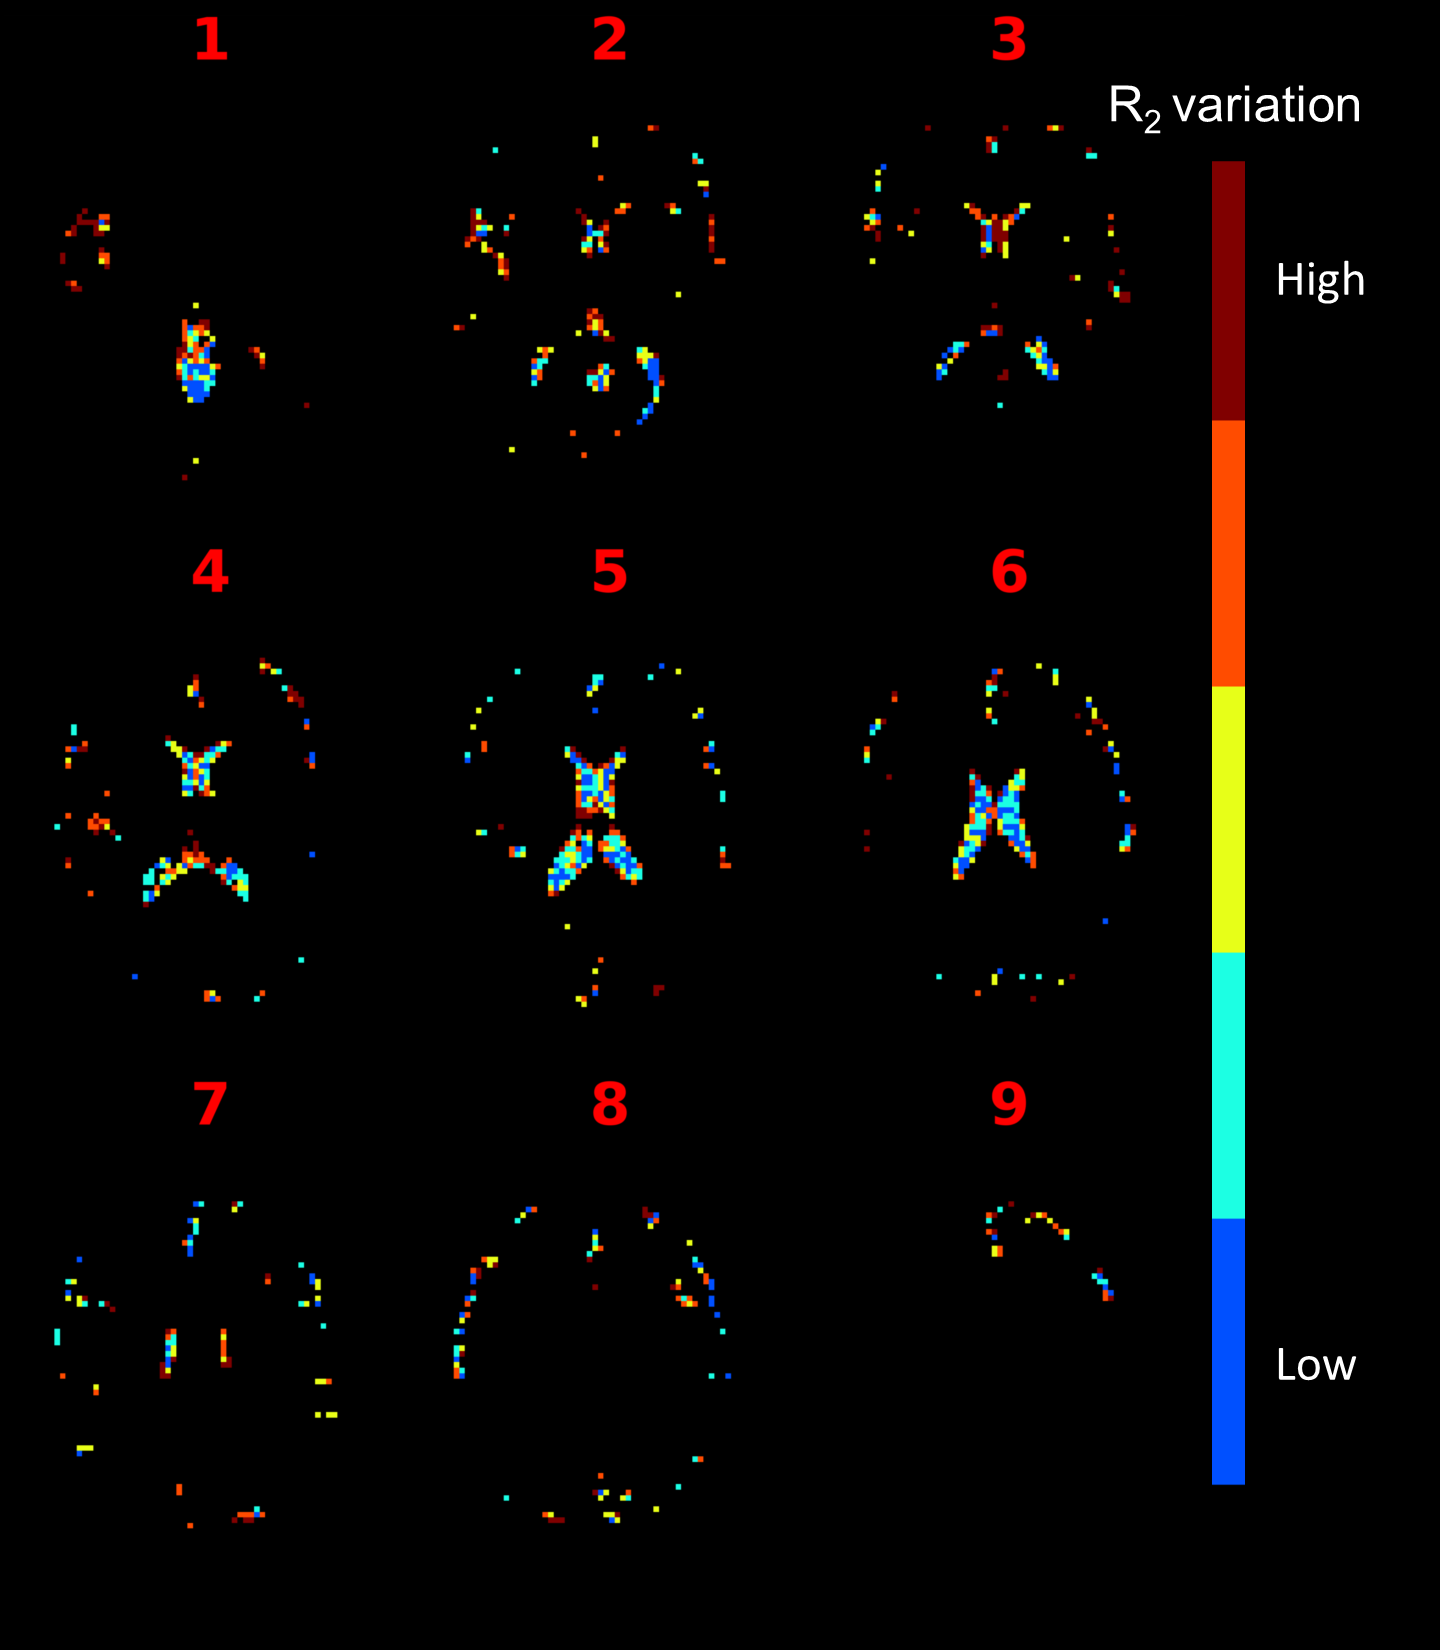
The distribution of CSF voxels with different levels of R2 variation is shown in Fig. 4 for one subject. Lower variation voxels tend to be found in the center of the lateral ventricle.
Discussion
In this study, the effect of saturation transfer between tissue and CSF was investigated in human subjects at 3 T. Between 5-10% of MT-induced saturation was observed in 20% of CSF voxels with the lowest cross-TD R2-variation. Whether this R2 variation-based filtering eliminates partial volume effect remains to be confirmed. Unlike the previous study based on mice [2], MTR in CSF calculated from long TE SE signal showed strong instability. This apparent effect could be caused by the fast CSF velocity in the order of tens of mm/s in human subjects compared to less than 1 mm/s in mice [4], which also depends on the physiological status [5]. Outflow effect can reduce the long TE signal by missing the refocusing RF pulse. Future studies can potentially improve the long TE signal stability by using non-selective refocusing pulse or gradient echo signal and flow-compensated acquisition. The observed MTR level in CSF was also smaller than that in mice, possibly caused by the reduced surface-to-volume ratio and stronger diluting effect due to faster flow in humans.Conclusion
Imaging water exchange between CSF and brain parenchyma based on magnetization transfer can potentially be used to assess the health condition of brain tissue. Methods that are less sensitive to partial volume and flow effect are needed to fully establish its validity in clinical applications.Acknowledgements
Thanks to Peter van Gelderen and Jeff Duyn for useful discussion and sharing the MRI sequence. This research was supported by the faculty startup fund from UT Southwestern Medical Center.References
[1] J. J. Iliff et al., “A Paravascular Pathway Facilitates CSF Flow Through the Brain Parenchyma and the Clearance of Interstitial Solutes, Including Amyloid β,” Science Translational Medicine, vol. 4, no. 147, pp. 147ra111-147ra111, Aug. 2012, doi: 10.1126/scitranslmed.3003748.
[2] A. M. Li, L. Chen, H. Liu, Y. Li, W. Duan, and J. Xu, “Age-dependent cerebrospinal fluid-tissue water exchange detected by magnetization transfer indirect spin labeling MRI,” Magnetic Resonance in Medicine, vol. 87, no. 5, pp. 2287–2298, 2022, doi: 10.1002/mrm.29137.
[3] P. van Gelderen, X. Jiang, and J. H. Duyn, “Rapid measurement of brain macromolecular proton fraction with transient saturation transfer MRI,” Magn Reson Med, vol. 77, no. 6, pp. 2174–2185, 2017, doi: 10.1002/mrm.26304.
[4] J. Li et al., “Whole-brain mapping of mouse CSF flow via HEAP-METRIC phase-contrast MRI,” Magnetic Resonance in Medicine, vol. 87, no. 6, pp. 2851–2861, 2022, doi: 10.1002/mrm.29179.
[5] Y. Wang et al., “Cerebrovascular activity is a major factor in the cerebrospinal fluid flow dynamics,” NeuroImage, vol. 258, p. 119362, Sep. 2022, doi: 10.1016/j.neuroimage.2022.119362.
Figures