3274
Characterization of semisolid proton $$$R_2$$$ orientation dependence in WM
Yuxi Pang1
1University of Michigan, Ann Arbor, MI, United States
1University of Michigan, Ann Arbor, MI, United States
Synopsis
Keywords: Relaxometry, White Matter
Quantitative magnetization transfer (qMT) imaging can indirectly probe $$$R_2$$$ orientation dependence in WM for semisolid methylene protons from lipid bilayers. Prior experimental and simulation studies indicate that the long lipid chain not only rotates rapidly around itself, but it also wobbles in a cone. The existing modeling methods, however, did not take the latter motional mode into account, potentially leading to a biased measure of myelin-specific anisotropic $$$R_2$$$ relaxation. This work thus proposes a new model encompassing both motional modes for better characterizing an anisotropic $$$R_2$$$ profile of semisolid protons in WM.INTRODUCTION
The anisotropic $$$R_2$$$ profile of semisolid protons in WM can be inferred from quantitative magnetization transfer (qMT) imaging and diffusion tensor imaging (DTI).1 The $$$R_2$$$ relaxation mechanism could be attributed to the typical “rotational diffusion”2 in contrast to the recently proposed “lateral diffusion”,3 with the former and the latter associated respectively with intra- and intermolecular residual dipolar interactions (RDI). An effective RDI for a long lipid chain is usually assumed along bilayer surface normal $$$\overrightarrow{m}$$$;4 consequently, RDI vectors within myelin sheath could be considered distributing concentrically around and thus perpendicular ($$$α$$$=90°) to axon primary direction $$$\overrightarrow{n}$$$.1,3 However, prior experimental and simulation studies indicate that the long lipid chain not only rotates rapidly around itself,4 but it also wobbles in a cone,5 indicating that individual lipid chains deviate from $$$\overrightarrow{m}$$$ by a definite angle $$$β$$$>0°.6 This work proposes a previously developed model,7-9 which intrinsically accounts for wobbling-in-a-cone motions, for better characterizing anisotropic $$$R_2$$$ of semisolid protons in WM.THEORY AND METHODS
(1) Theory: An apparent $$$R_2$$$ of semisolid protons, proportional to the second moment of Gaussian line shapes, reportedly depends on $$$P_2^2(cosθ)$$$ for macroscopically orientated lipid bilayers,10 with $$$P_2(cosθ)$$$ denoting the second Legendre polynomial and angle $$$θ$$$ formed between $$$\overrightarrow{m}$$$ and $$$B_0$$$ as shown in Fig. 1B. An individual lipid chain deviates from $$$\overrightarrow{m}$$$ by an angle $$$β$$$ based on an axially symmetric (or cone5) motional model (Fig. 1C). When multiple lipid bilayers wrapping around an axon (Fig. 1A),11 a new cone could be generated with a complementary opening angle $$$α$$$=90°-$$$β$$$ and the corresponding axis ($$$\overrightarrow{n}$$$) of symmetry will be collinear with the axon fiber as depicted in Figs. 1D-E. A general $$$R_2$$$ orientation dependence $$$f(α,ε)$$$ of this cylindrical distribution of semisolid protons has been known long before9 and recently reformulated as expressed in Eq. 1.8$$f(α,ε)=1/4 (3cos^2 α-1)^2 (3cos^2 ε-1)^2+9/8 (sin^4 α sin^4 ε+sin^2 2α sin^2 2ε) \quad(1)$$
Here, angle $$$ε$$$ is formed between $$$\overrightarrow{n}$$$ and $$$B_0$$$ as depicted in Fig. 2A. If $$$α$$$=90°,$$$f(α,ε)$$$ will become $$$(27⁄8)(cos^2ε-5⁄9)^2+1⁄3$$$ as previously demonstrated.3 On the other hand, if $$$α$$$=0°, $$$f(α,ε)$$$ will be reduced to the standard magic angle effect function $$$(3cos^2 ε-1)^2$$$.
(2) Method: The anisotropic $$$R_2$$$ profile of semisolid protons from healthy adult brain WM was extracted (http://www.graphreader.com/) from the graph (Fig. 7a) in a previously published paper.1 The main fiber direction $$$Φ$$$ was determined from the angle between the principal eigenvector from DTI and $$$B_0$$$. A typical imaging voxel contains tens of thousands of axon fibers, which are not always perfectly aligned in the same direction even in a highly compacted fiber bundle such as corpus callosum.12 For an axially symmetric diffusion tensor (Fig. 3B), individual axon fibers, viewed as a set of "sticks", could be considered distributing around the $$$D_∥$$$ direction and thus deviating from $$$Φ$$$ by a phase shift angle $$$ε_0=tan^{-1}(D_⊥⁄D_∥ )$$$. As a result, $$$R_2$$$ profile was modeled with Eq. 2 containing either four (“Fit A”, with $$$α$$$ varied) or three (“Fit B”, with $$$α$$$=90°) model parameters. $$$R_2^i$$$, $$$R_2^a$$$, and $$$ε_0$$$ were isotropic component, anisotropic component, and phase shift, respectively.
$$R_2 =R_2^i+R_2^a*f(α,Φ-ε_0) \quad(2)$$
Goodness of fits were characterized by root-mean-square error (RMSE) and F-test was used for comparing fitting performance. Statistical significance was set to P ≤ .05. The mean and standard deviation (SD) of the fits were reported unless otherwise stated. Data analysis and visualization were performed using in-house software written in IDL 8.8 (Harris Geospatial Solutions, Inc., Broomfield, CO, USA).
RESULTS AND DISCUSSION
Fig. 2B presents the $$$f(α,ε)$$$ map with $$$α$$$ and $$$ε$$$ simultaneously varying between -180° to 180°, illustrating multiple periodicities inherent in an axially symmetric system. For instance, $$$f(α,ε)$$$ and $$$f(ε,α)$$$ are equal and so are $$$f(α,ε)$$$, $$$f(α±90°,ε)$$$ and $$$f(α±180°,ε)$$$. Fig. 3A demonstrates some representative $$$f(α,ε)$$$ profiles with different $$$α$$$ settings, showing that $$$f(α,ε)$$$ is limited between 0 ($$$α$$$=0° and $$$ε$$$=54.7° or vice versa) and 4 ($$$α$$$=$$$ε$$$=0°). Fig. 3C compares the two fits and the corresponding fitting residuals, i.e.,$$$∆R_{2b}$$$=Fit-Exp, are displayed in Fig. 3D. These comparisons revealed that FitA (red line) significantly (P≤0.01) outperformed FitB (blue line) as indicated by substantially reduced RMSE, i.e., 0.707 vs. 1.535. The fit parameters (FitA vs. FitB) were as follows: $$$R_2^i$$$(103 1/s)=46.9±1.3 vs. 60.0±0.6, $$$R_2^a$$$(103 1/s)=50.0±2.3 vs. 17.5±0.7, $$$α$$$(°)=69.6±0.2 vs. 90.0±0.0 (fixed), and $$$ε_0$$$(°)=31.6±0.4 vs. -7.0±0.6. The fitted $$$α\sim70°$$$(FitA) is consistent with the literature where $$$β\sim30°$$$ was found in membrane model systems.6 Based on the comparable $$$R_2^i$$$ and $$$R_2^a$$$ (FitA), the specific contribution from WM to the measured $$$R_2$$$ could be estimated to $$$4R_2^a⁄(R_2^i+4R_2^a)\approx80$$$%. The findings from this work suggest that the recently proposed “lateral diffusion model”3 has less explanatory power because of the predicted orientation dependence $$$f(90°,ε)$$$ regardless of the specific relaxation mechanism. On the other hand, in the original publication,1 an orientation dependence of $$$P_2(cosθ)$$$, rather than $$$P_2^2(cosθ)$$$ as previously reported,10 was evaluated in a cylindrical model with a fixed $$$α$$$=90°, leading to some discrepancies between simulated and experimental data either at lower orientation angles ($$$T_{2b}$$$=13.5 μs) or at higher orientation angles ($$$T_{2b}$$$=13 μs) when simulating based on different $$$T_{2b}$$$ values.CONCLUSION
The previously developed generalized magic angle effect function or cone model can better quantify anisotropic $$$R_2$$$ of semisolid protons in WM, thereby shedding new light on biophysical interpretation of myelin-specific contents in qMT studies.Acknowledgements
The author is grateful to Dr. Harald E. Möller (Max Planck Institute for Human Cognitive and Brain Sciences, Leipzig, Germany) for his insightful comments on the proposed cone model.References
- Pampel A, Müller DK, Anwander A, Marschner H, Möller HE. Orientation dependence of magnetization transfer parameters in human white matter. Neuroimage. 2015;114:136-146.
- Kroon PA, Kainosho M, Chan SI. Proton magnetic resonance studies of lipid bilayer membranes experimental determination of inter-and intramolecular nuclear relaxation rates in sonicated phosphatidylcholine bilayer vesicles. Biochimica et Biophysica Acta (BBA)-Biomembranes. 1976;433(2):282-293.
- Sukstanskii AL, Yablonskiy DA. Microscopic theory of spin–spin and spin–lattice relaxation of bound protons in cellular and myelin membranes–a lateral diffusion model (LDM). Magnet Reson Med. 2022;
- Wennerström H. Proton nuclear magnetic resonance lineshapes in lamellar liquid crystals. Chemical Physics Letters. 1973;18(1):41-44.
- Pastor RW, Venable RM, Feller SE. Lipid bilayers, NMR relaxation, and computer simulations. Accounts of chemical research. 2002;35(6):438-446.
- Bocian DF, Chan SI. NMR studies of membrane structure and dynamics. Annual review of physical chemistry. 1978;29:307-335.
- Pang Y. Anisotropic transverse relaxation in the human brain white matter induced by restricted rotational diffusion. In: Proceedings of the International Society of Magnetic Resonance Medicine, Virtual, 2021. (abstract: 1711):
- Pang Y. Characterization of anisotropic T2W signals from human knee femoral cartilage: The magic angle effect on a spherical surface. NMR Biomed. 2021;34(7):e4535.
- Berendsen HJC. Nuclear magnetic resonance study of collagen hydration. J Chem Phys. 1962;36(12):3297-3305.
- Morris SR, Frederick R, MacKay AL, Laule C, Michal CA. Orientation dependence of inhomogeneous magnetization transfer and dipolar order relaxation rate in phospholipid bilayers. J Magn Reson. 2022;338:107205.
- Simons M, Nave K-A. Oligodendrocytes: myelination and axonal support. Cold Spring Harbor perspectives in biology. 2016;8(1):a020479.
- Budde MD, Annese J. Quantification of anisotropy and fiber orientation in human brain histological sections. Frontiers in integrative neuroscience. 2013;7:3.
Figures
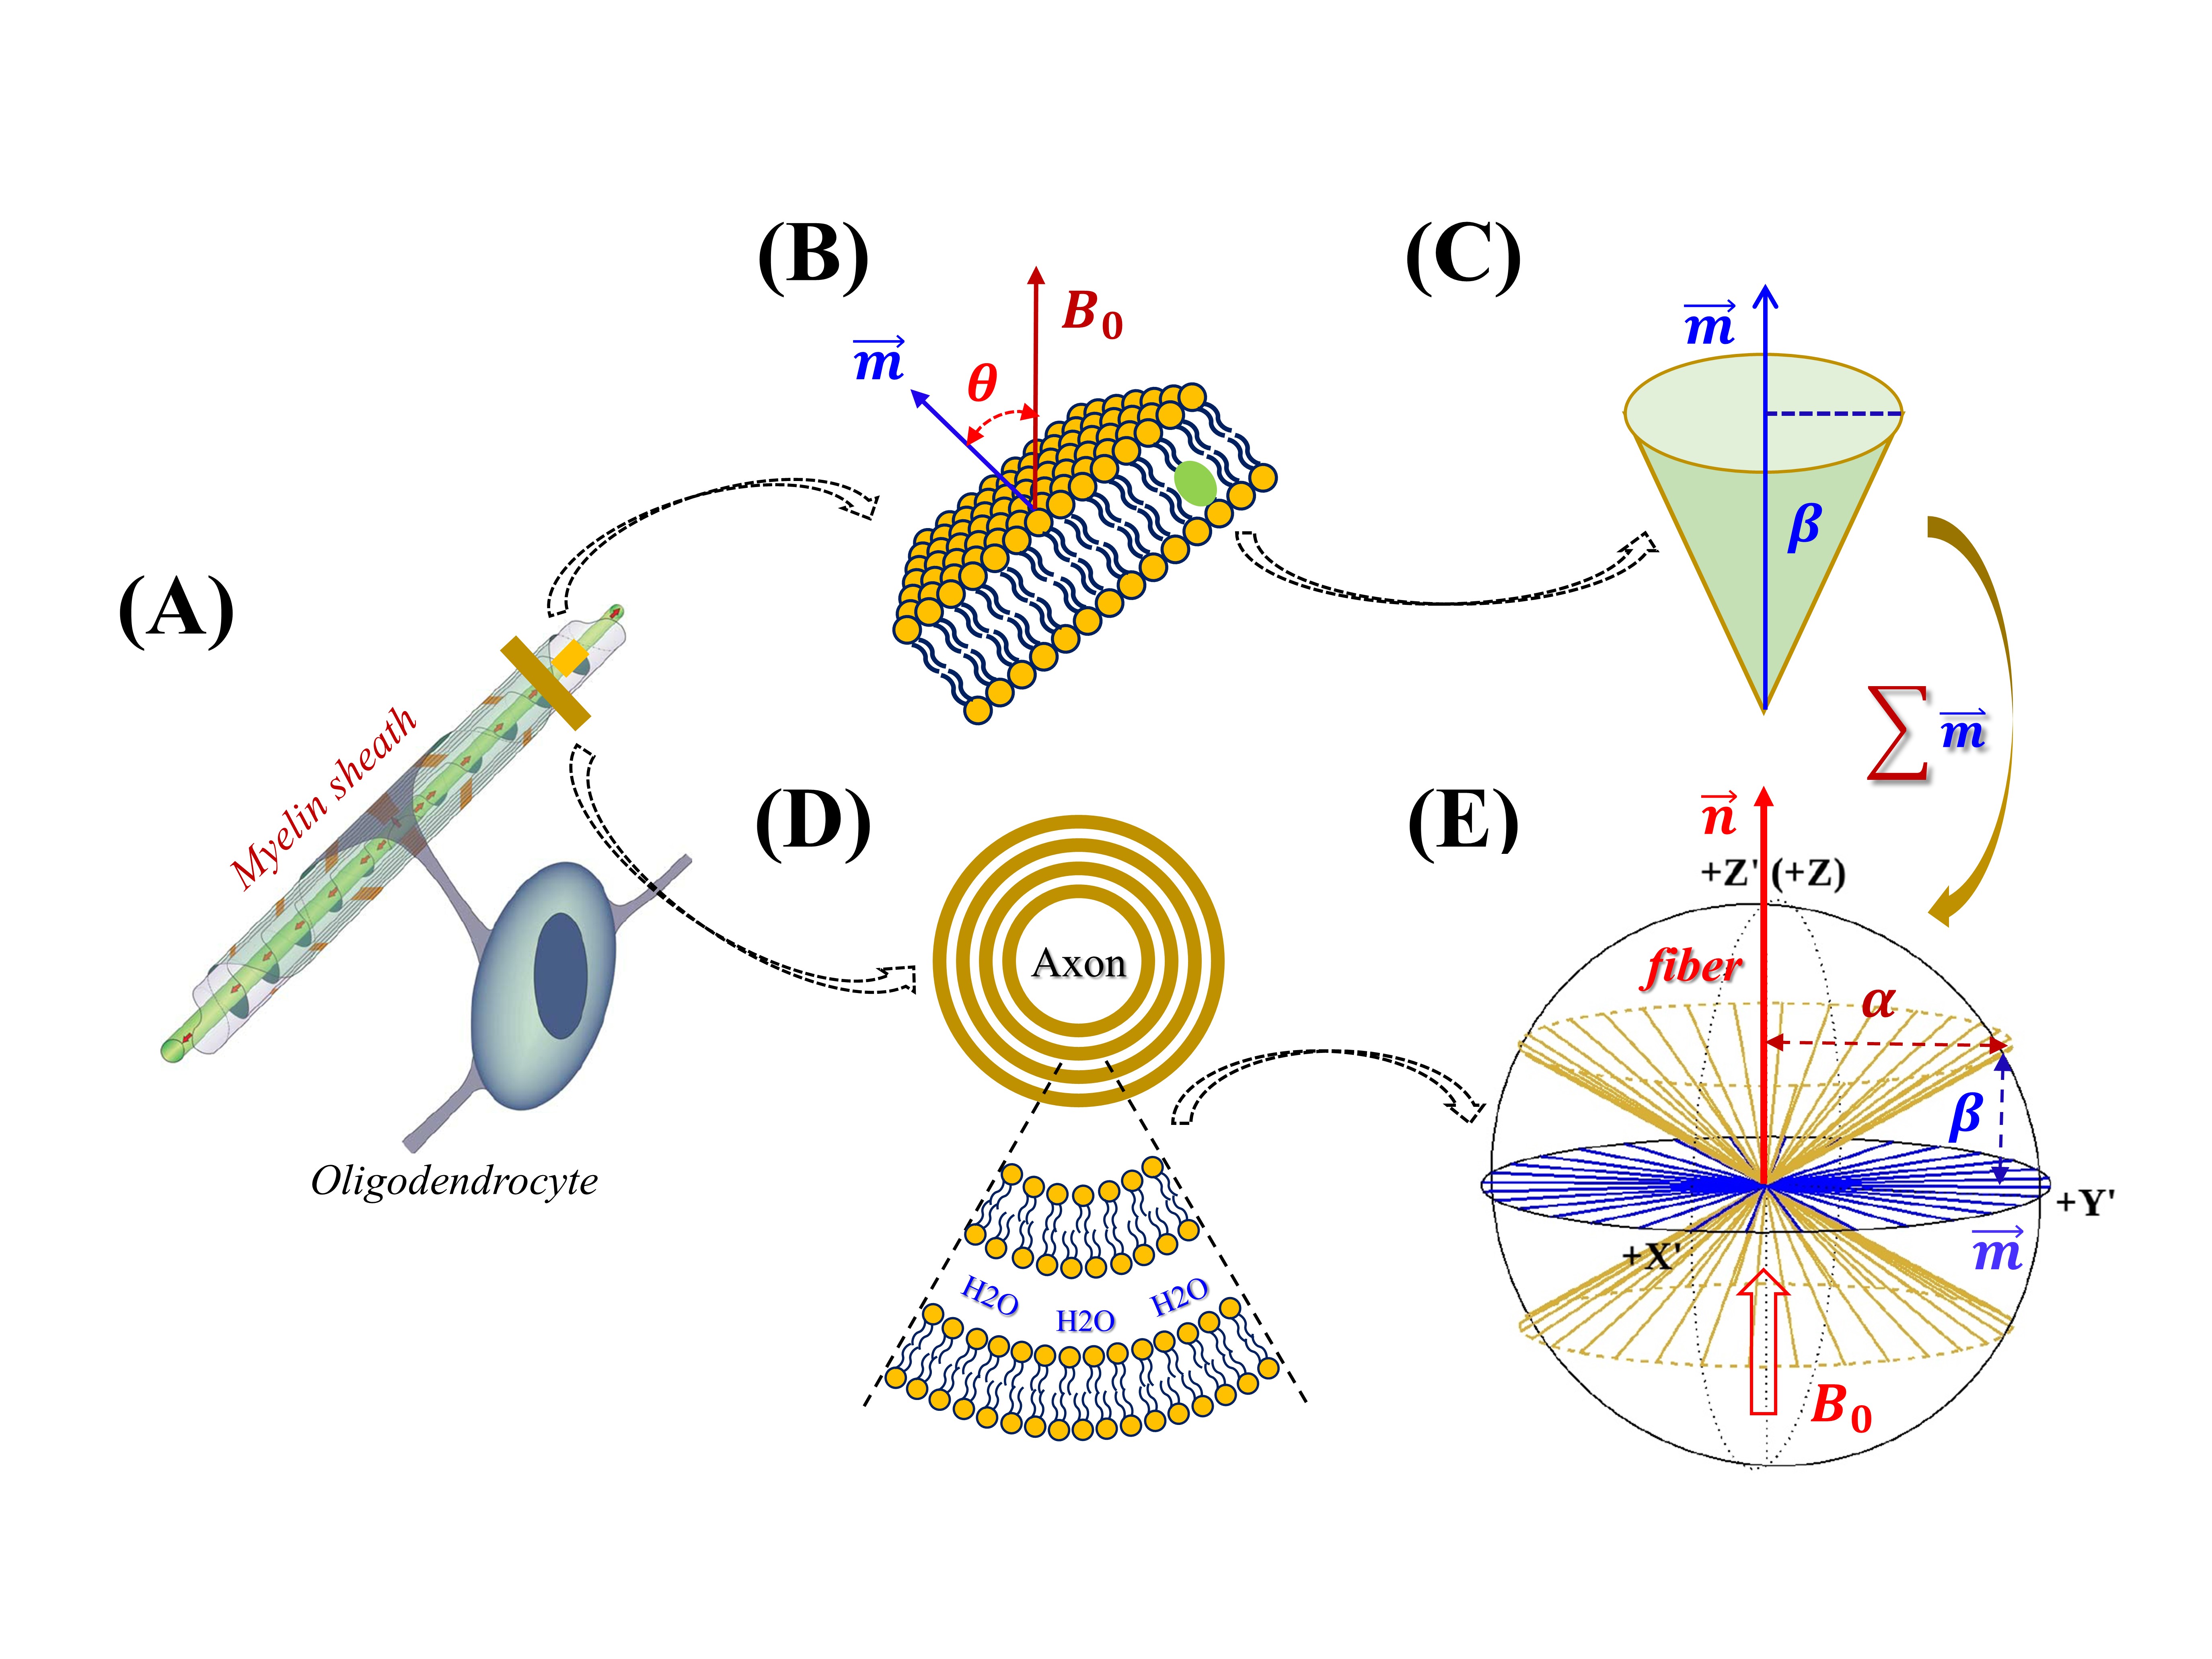
FIG. 1
Schematics of developing an axially symmetric model (E) for multiple lipid
bilayers (D) wrapping around an axon fiber (A). The motion of an individual lipid
carbon-chain (B) can be described as a cylinder wobbling in a cone, with a cone
angle $$$β$$$ (C), while
multiple lipid chains in myelin sheath can be collectively characterized by a
different cone (E), with a cone angle $$$α$$$=90°-$$$β$$$. The graph of myelinated axon (A) was adapted from
Figure 3 in the reference.11
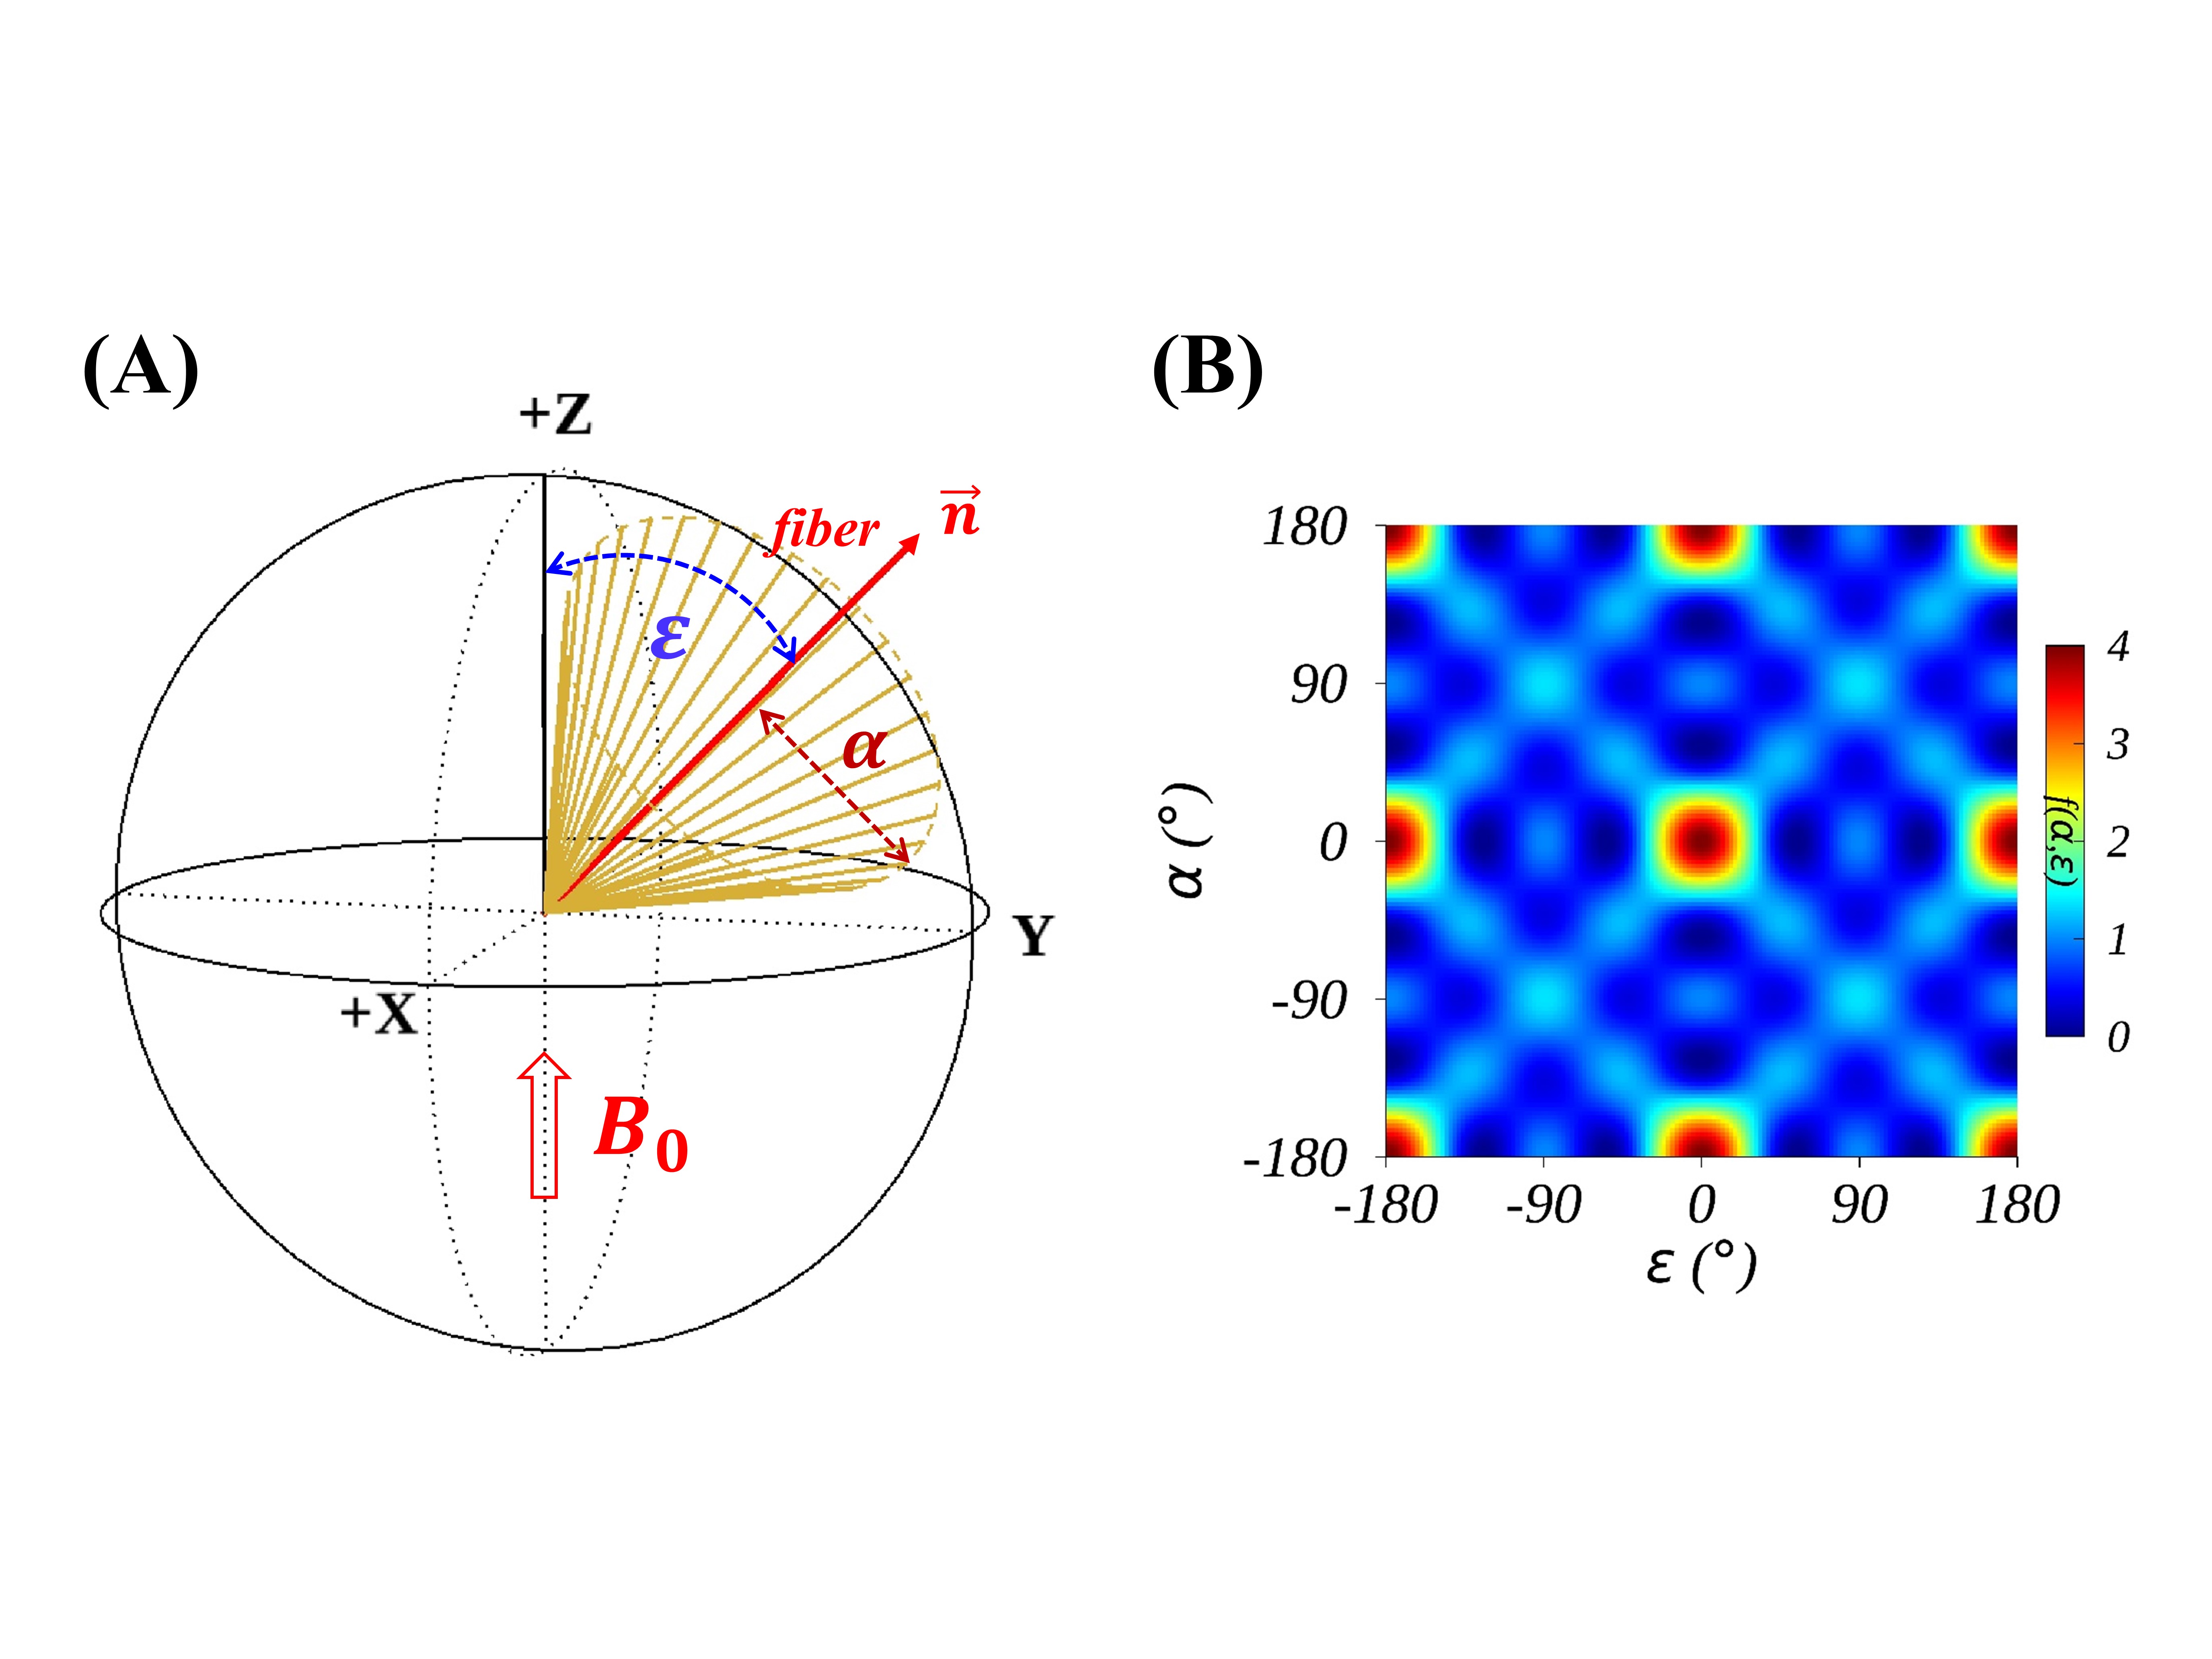
FIG. 2. Schematic
of an axially symmetric model inclined at angle $$$ε$$$ to $$$B_0$$$(A) and the corresponding $$$R_2$$$ orientation dependence $$$f(α,ε)$$$ revealing multiple symmetries (B).
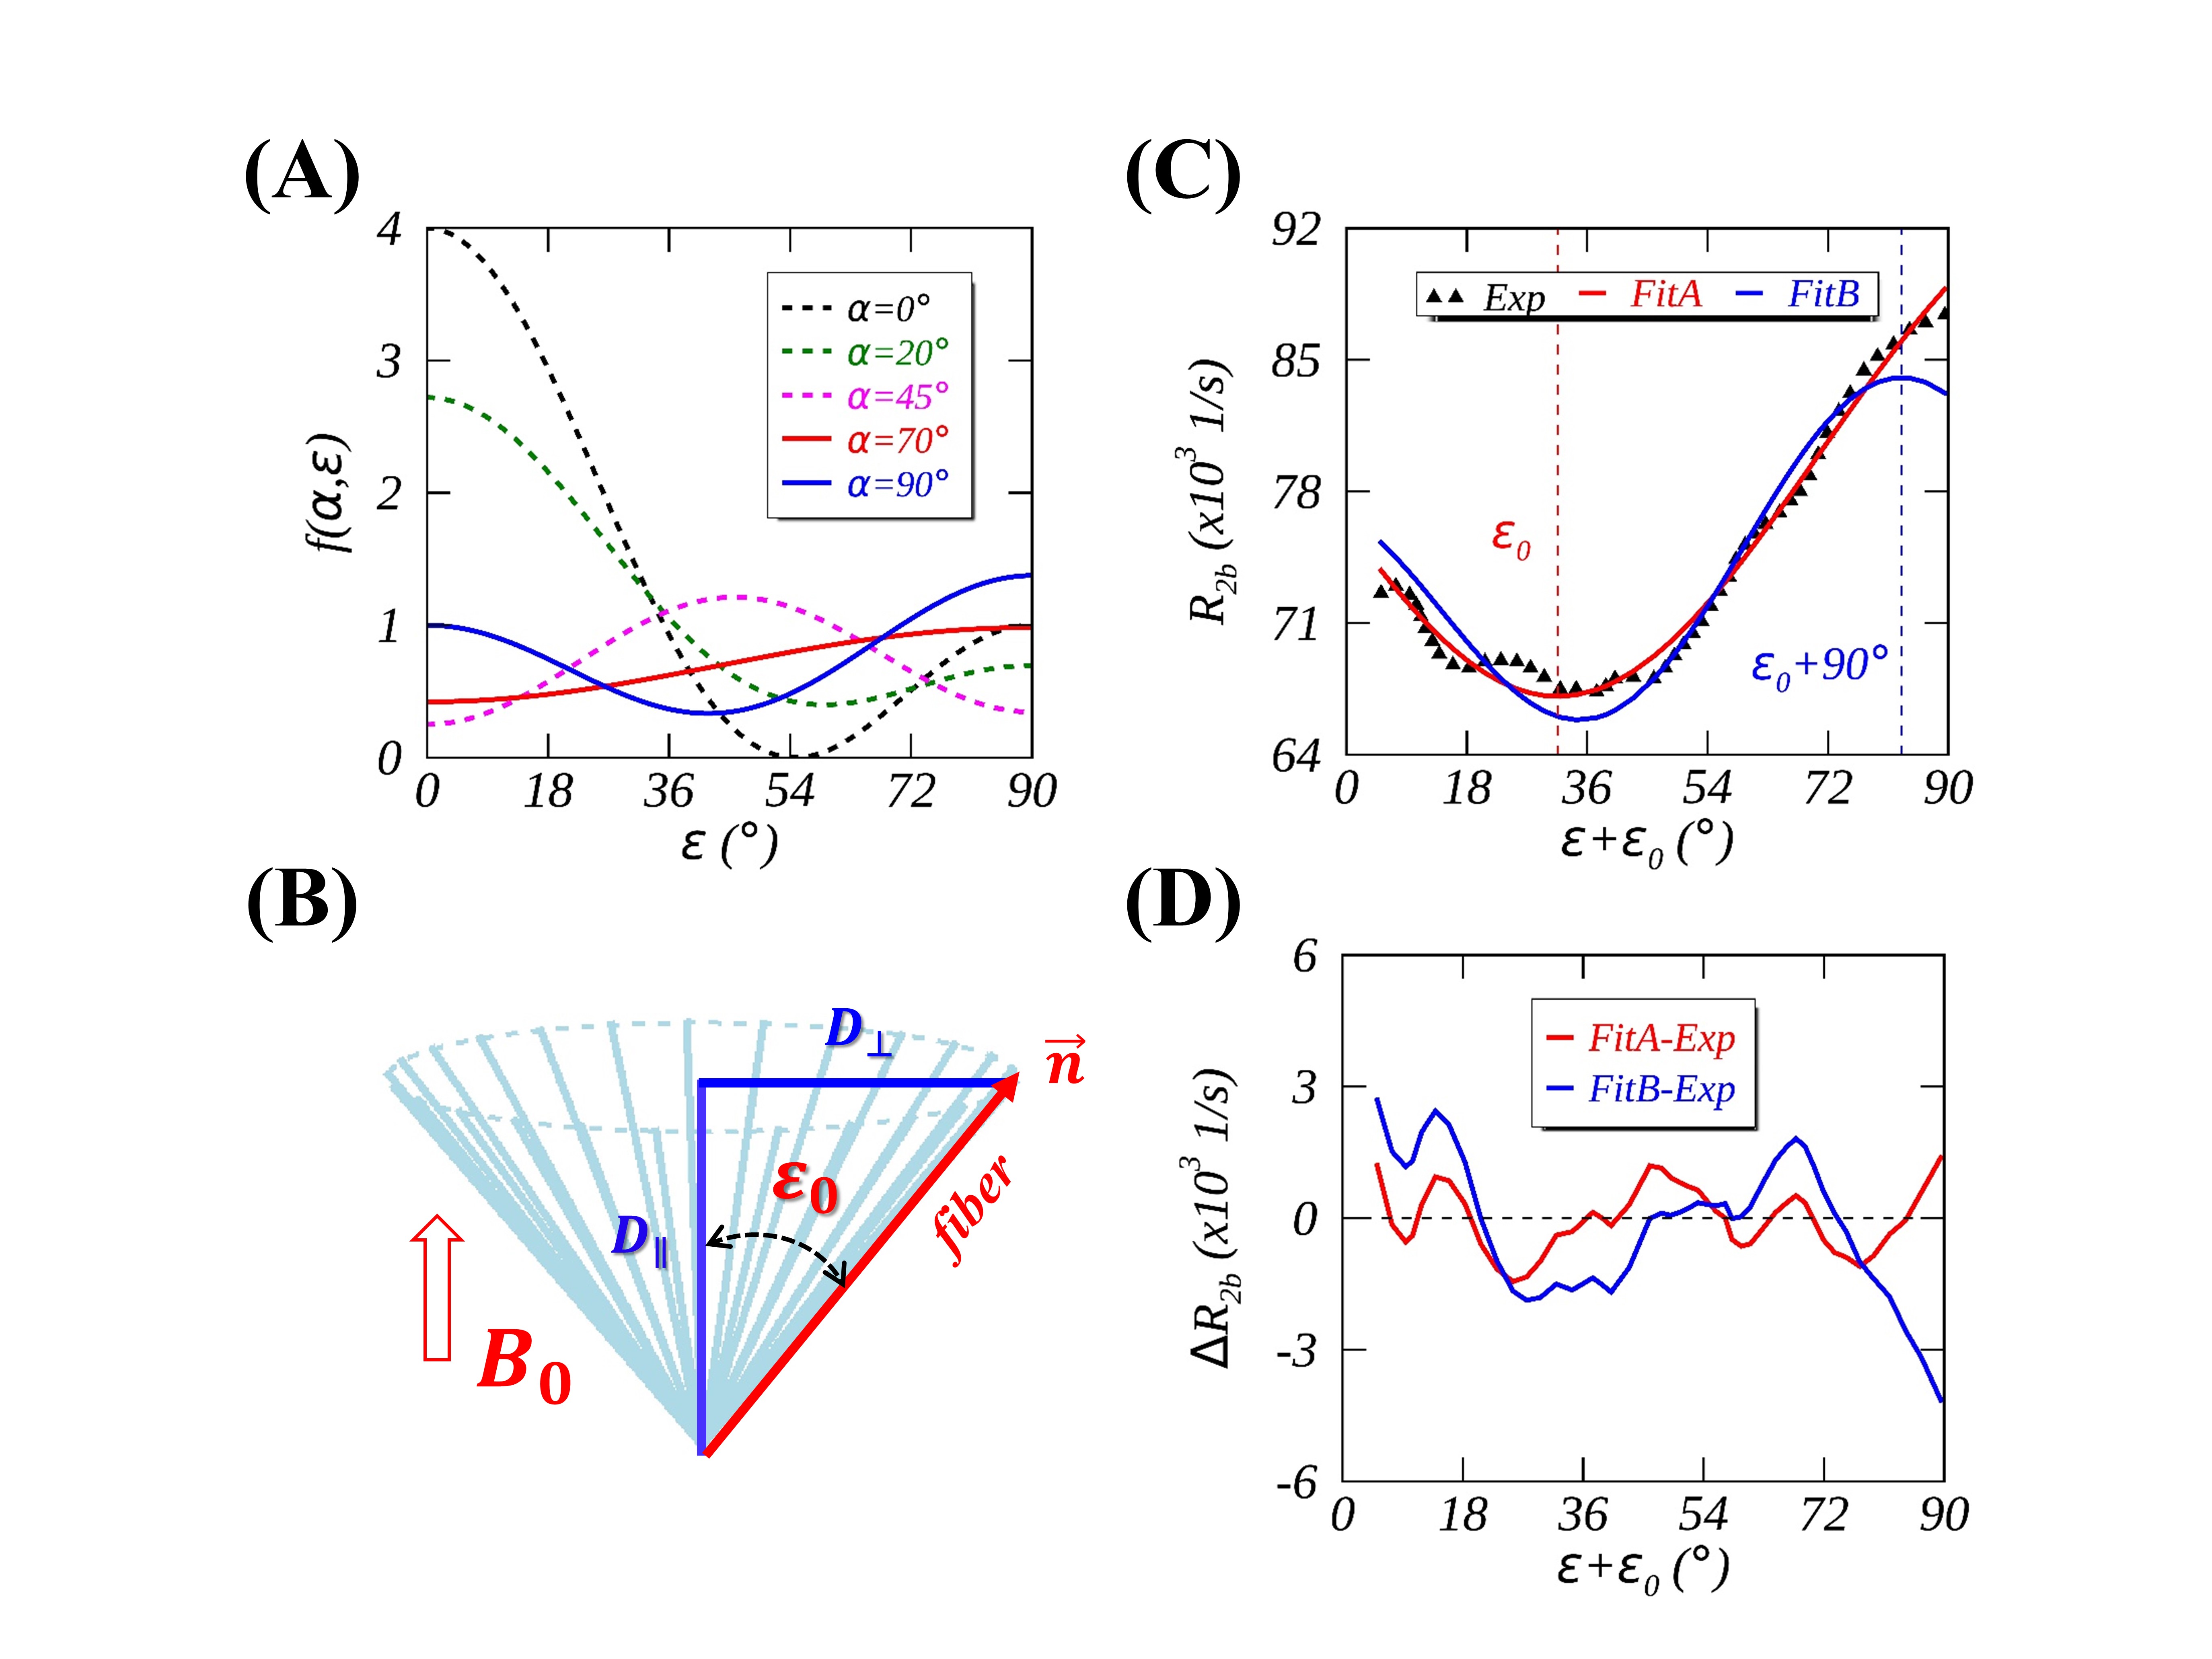
FIG. 3. Theoretical $$$f(α,ε)$$$ profiles with
different cone angles $$$α$$$ (A) and a
predicted phase shift $$$ε_0$$$ of $$$f(α,ε)$$$ for an
individual axon fiber in an imaging voxel (B). Fig. 3C shows experimental data1 (diamond in black) fittings when $$$α$$$ varied (FitA,
red line) or fixed to 90° (FitB, blue line), and the corresponding fitting
residuals are given in Fig. 3D.
DOI: https://doi.org/10.58530/2023/3274