3273
Quantitative Magnetisation Transfer Imaging using bSSFP to assess diffuse myocardial fibrosis.1The University of Manchester, Manchester, United Kingdom, 2MCMR, Manchester University NHS Foundation Trust, Manchester, United Kingdom
Synopsis
Keywords: Magnetization transfer, Cardiovascular
Patients with chronic kidney disease often suffer from cardiac complications where increased diffuse myocardial fibrosis is present. Gadolinium is contraindicated in these patients, so cannot benefit from techniques such as ECV.
We present a bSSFP based quantitative magnetisation transfer technique to assess diffuse myocardial fibrosis through the calculation of a pool size ratio and compare against ECV.
6 bSSFP images, T1, and T2 maps were acquired where a two pool model was fitted. No significant correlation between PSR and T1 in healthy patients was found. Significant correlations were found between PSR and T1 and PSR and ECV in clinical patients.
Introduction
Patients with advanced chronic kidney disease often suffer from cardiac complications as a result of their condition. Increased levels of diffuse myocardial fibrosis are frequently associated with secondary cardiomyopathy and has prognostic significance. The calculation of ECV is the current gold standard for assessing myocardial fibrosis, however this requires the use of gadolinium, which is contraindicated in these patients.Native T1 mapping has been shown to correlate with fibrosis but is not a direct measure of collagen content and hence non-specific to fibrosis.
Quantitative magnetisation transfer (qMT) imaging has been suggested as a technique more specific to the concentration of collagen present, as the signal is influenced by the exchange of magnetisation between protons ‘bound’ to collagen, and unsaturated ‘free’ protons such as those in the extra-cellular space. qMT allows for the calculation of a ‘Pool Size Ratio’ (PSR) defined as the ratio of bound proton density to free proton density.[1]
López et al reported a reduction in PSR in areas of late gadolinium enhancement in acute myocardial infarction patients, indicative of increased focal fibrosis.[2] While an increase in collagen might be expected to increase PSR, it was hypothesised that the reduction is due to the expansion of the extracellular space, increasing the size of the free pool. There have been no previous studies investigating qMT to assess diffuse myocardial fibrosis.
In this study, we assess a bSSFP based method, first introduced by Gloor et al, to calculate myocardial PSR in patients with diffuse fibrosis and compare the calculated PSR to the gold-standard ECV.[1]
Methods
Magnetisation transfer imaging has been explored to a greater extent in the brain than in the heart, in which Gloor et al [1] proposed a two-pool model modification of the Freeman-Hill equation:$$M_{xy}=M_0sinα\frac{(1- E_1)B+C}{A-BE_1 E_2-(BE_1-AE_2)cosα}$$
Where:
$$A=1+F-f_wE_1(F+ f_k)$$ $$B=1+f_k(F-f_wE_1(F+1))$$ $$C=F(1-E_1)(1-f_k)$$ $$f_w=e^{-WT_{RF}}$$ $$f_k= e^{(-k_f+k_r)/TR}$$
$$W(Δ)= \frac{\pi}{T_{RF}}\int_{0}^{T_{RF}}ω_1^2(t)dtG(Δ)$$ $$E_1= e^{-R_1TR}$$ $$E_2= e^{-R_2TR}$$
Here, F is the pool size ratio PSR, W is the mean saturation rate, TRF is the RF pulse duration, kf and kr are the magnetisation exchange rates to the free pool and bound pool respectively.
Data were acquired from 39 healthy volunteers (16 male, age range 19-72) in a heathy reference range study, and 12 patients attending for clinical scanning (perfusion, viability, hypertrophic cardiomyopathy, or myocarditis), using a Siemens Magnetom Vida 3T system running XA20 software. Six bSSFP based cine acquisitions, a T1 MOLLI map, and a T2 map were acquired. Post-contrast T1 MOLLI maps were only acquired in clinical patients and used to calculate ECV. The flip angles and RF pulse durations used for the bSSFP acquisition were 5° at the longest RF pulse duration, 20° at the shortest and fastest RF pulse durations, and 30° at the shortest, normal, and longest RF pulse durations.
ROIs were drawn in the myocardial septum, to ensure B1 was as homogenous as possible, avoiding any regions of myocardial scar. Equation 1 was fitted to the data to obtain PSR, M0 and a B1 scaling factor, s. kr was set equal to kf/F, kf and G(0) were set to their literature values of 4.2s-1, and 1.2e-5s-1 respectively. [2-4] A correction to T2 was applied to correct for non-instantaneous sinc RF pulses.[5]
Results
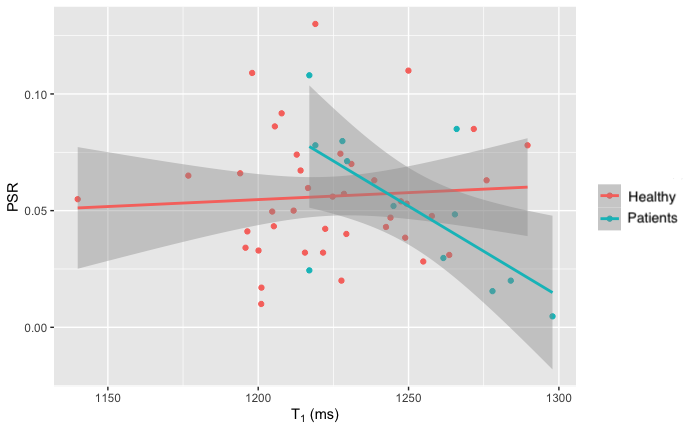
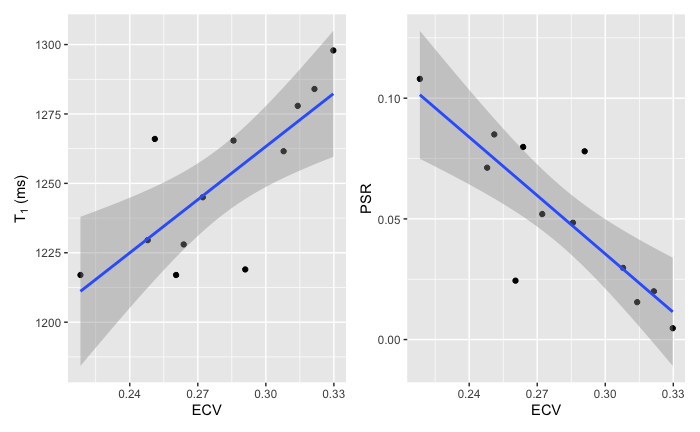
Figure 1 shows the relationship between PSR and T1 in the healthy and patient groups. In healthy volunteers, there was no correlation between PSR and native T1 (Pearson’s r = 0.066, p = 0.6), whereas in clinical patients a significant negative correlation was observed (r = -0.67, p = 0.017).Figure 2 presents the relationship between T1, PSR and ECV in the patient group. Native T1 showed the expected positive correlation with ECV, and PSR was found to negatively correlate. Simple linear regression revealed that both relationships were statistically significant with p = 0.0041 for T1 vs ECV and p = 0.00078 for PSR vs ECV. Fitting a multiple linear regression model for ECV and comparing nested models using analysis of variance revealed that the combination of T1 and PSR better predicted ECV than T1 alone (p = 0.024) whereas the combination of T1 and PSR did not significantly improve the prediction of ECV over PSR alone (p = 0.12).
Discussion
Our results correspond well with those reported by Lopez et al, in that a reduction in PSR corresponds with increased myocardial fibrosis, indicated by ECV. This suggests that in diffuse fibrosis as in myocardial scar, the effect of increasing extracellular volume on the free pool outweighs any increase in the bound pool fraction that may occur due to increased collagen content.No correlation was observed between PSR and T1 in healthy volunteers demonstrating that the two techniques provide complimentary information. Regression analysis suggests that PSR may potentially provide a stronger predictor of ECV than T1 alone, however the number of subjects in the present study is small and larger studies are needed to confirm this result.
Conclusion
We have shown that quantitative magnetisation transfer negatively correlates with the gold-standard method of assessing diffuse myocardial fibrosis, ECV. This makes it a viable non-contrast method for assessing diffuse myocardial fibrosis. As this method uses standard sequences, it can be rapidly deployed into routine clinical use where gadolinium is contraindicated.Acknowledgements
No acknowledgement found.References
1. Gloor, M., K. Scheffler, and O. Bieri, Quantitative magnetization transfer imaging using balanced SSFP. Magnetic Resonance in Medicine, 2008. 60(3): p. 691-700.
2. López, K., et al., Quantitative magnetization transfer imaging for non‐contrast enhanced detection of myocardial fibrosis. Magnetic Resonance in Medicine, 2021. 85(4): p. 2069-2083.
3. Gloor, M., K. Scheffler, and O. Bieri, Nonbalanced SSFP-based quantitative magnetization transfer imaging. Magnetic Resonance in Medicine, 2010. 64(1): p. 149-156.
4. Stanisz, G.J., et al., T1, T2 relaxation and magnetization transfer in tissue at 3T. Magnetic Resonance in Medicine, 2005. 54(3): p. 507-512.
5. Bayer, F.M., et al., Unbiased signal equation for quantitative magnetization transfer mapping in balanced steady‐state free precession MRI. Magnetic Resonance in Medicine, 2022. 87(1): p. 446-456.
6. Beltrami, C.A., et al., Structural basis of end-stage failure in ischemic cardiomyopathy in humans. Circulation, 1994. 89(1): p. 151-163.
Figures