3270
The Value of dynamic contrast-enhanced MRI in differential diagnosis of solid ovarian tumors with diffusion restriction
Ying Meng1, Yuting Liang1, Xinlian Wang1, Keyang Wang1, and Lizhi Xie2
1Beijing Obstetrics and Gynecology Hospital, Capital Medical University, Beijing, China, 2GE healthcare, Beijing, Beijing, China
1Beijing Obstetrics and Gynecology Hospital, Capital Medical University, Beijing, China, 2GE healthcare, Beijing, Beijing, China
Synopsis
Keywords: Pelvis, Pelvis
DWI can differentiate benign and malignant lesions by reflecting the diffusion of water molecules in lesions, which has become a routine sequence of MRI examination of gynecological tumors. Generally, DWI signal is high, which will alert to the possibility of malignancy, while benign tumors also show high DWI signal. For solid ovarian tumors with high signal intensity on DWI, the differential diagnosis of ovarian tumors is still a difficult point in routine MRI sequence diagnosis. The results of this study showed that DCE-MRI quantitative parameters of solid ovarian masses were helpful for differential diagnosis of benign and malignant.Objective
To explore the value of DCE-MRI sequence in differentiating benign and malignant ovarian tumors.Methods
The clinical, pathological and imaging data of patients with ovarian tumors who underwent MRI examination in our hospital from January 2019 to December 2021 were collected retrospectively. MRI images of solid ovarian tumors with diffusion restriction were analyzed. All MRI examinations were performed in the supine position using a 3.0-T superconducting magnet (Discovery MR750 3.0 T, General Electric Medical Systems) with an 8-channel torso phased-array coil. For each patient, one precontrast image and six postcontrast images using LAVA sequence were acquired after beginning the intravenous administration of gadobutrol. The VOI was manually delineated on the stage 6 of postcontrast series, which is usually the most enhanced of all the time series and hence is usually useful for visual inspection. Tumor VOI was mapped to all the image series. Data analysis was performed using the publicly available software Pyradiomics in Python (version 3.6, Python Software Foundation). The following parameters were obtained: DWI signal intensity when b value was 1000 s/mm2 and average ADC value (ADCmean), the time-intensity curves (TIC) were drawn with the signal intensity of each series of DCE-MRI scanning. The precontrast image (S0), the intermediate postcontrast image (S3), which usually represents the highest enhancement value, and the last postcontrast image series (S6), which represents a washout two and four minutes after the acquisition of S0, were analyzed, and the enhancement rate formulated as follows: (S3-S0)/S0, (S6-S0)/S0 and (S6-S3)/(S3-S0) (termed R1, R2 and R3, respectively). The clinical pathological features were recorded. The differences of the above parameters between the two groups were compared by t test, Mann-Whitney U test, χ2 test or Fisher exact probability, depending on the data type. The diagnostic performance of different parameters was judged by the receiver-operating characteristic curve (ROC) analysis. ROC curve was utilized to analyze the predictive efficacy of DCE quantitative parameters for differentiating benign and malignant ovarian tumors.Results
54 patients were divided into benign and malignant groups according to pathological diagnosis, among which 39 patients were benign, aged 21-65 years, with an average age of 50.2 years; and 15 cases were malignant lesions, ranging from 20 to 73 years old, with an average age of 48.2 years. There was no significant difference in DWI signal intensity and average ADC value (ADCmean) between the two groups(P> 0.05). Type I was the main type of TIC curve in benign group, and type II was the main type in malignant group (Figure 1), there was significant difference between the two groups (P< 0.001). The enhancement rate of R1 and R2 in malignant tumors were higher than those in benign tumors (P< 0.001, P= 0.003), while R3 was lower than that in benign tumors (P< 0.001) (Table 1). ROC curve analysis ROC analysis (Figure 2) showed that the AUC of R1, R2 and R3 were 0.817, 0.768 and 0.834 respectively, and the sensitivity and specificity were 100%, 86.7%, 86.7% and 74.4%, 74.4%, 76.9%, respectively (Table 2).Discussion
It is difficult to differentiate between benign and malignant ovarian solid tumors with diffusion restriction, which just affects the formulation of the scope of surgery, the choice of adjuvant treatment and the judgment of prognosis. It is suggested that the type of TIC curve is helpful to differentiate benign and malignant tumors for this kind of solid tumors. The results of this study showed that the enhancement rates R1 and R2 of malignant tumors were higher than those of benign tumors, indicating that the enhancement degree of malignant tumors is higher than that of benign tumors, while the enhancement rate R3 of malignant tumors was lower than that of benign tumors, indicating that the early enhancement of malignant tumors was obvious, which is mainly because the new microvessels of ovarian malignant tumor are not only abundant, but also immature, and the lack of muscular layer increases the permeability, and the contrast agent is easier to enter the gap of cancer tissue quickly.Conclusion
For solid ovarian tumors with high signal intensity on DWI, the TIC curve and enhancement rate of DCE-MRI sequence were helpful to differentiate benign and malignant, in which the quantitative parameters R1 and R3 were the best in differential diagnosis.Acknowledgements
No acknowledgement found.References
1.Sadowski EA, Maturen KE, Rockall A, et al. Ovary: MRI characterisation and O-RADS MRI. Br J Radiol (2021);94:20210157.
2.Vargas H A , Woo S . Quantitative versus Subjective Analysis of Dynamic Contrast-enhanced MRI for O-RADS?[J]. Radiology, 2022(3):303
3.Ming Fan, Yajing Cui, Chao You, et al. Radiogenomic Signatures of Oncotype DX Recurrence Score Enable Prediction of Survival in Estrogen Receptor–Positive Breast Cancer: A Multicohort Study. Radiology 2021; 000:1–9.
Figures
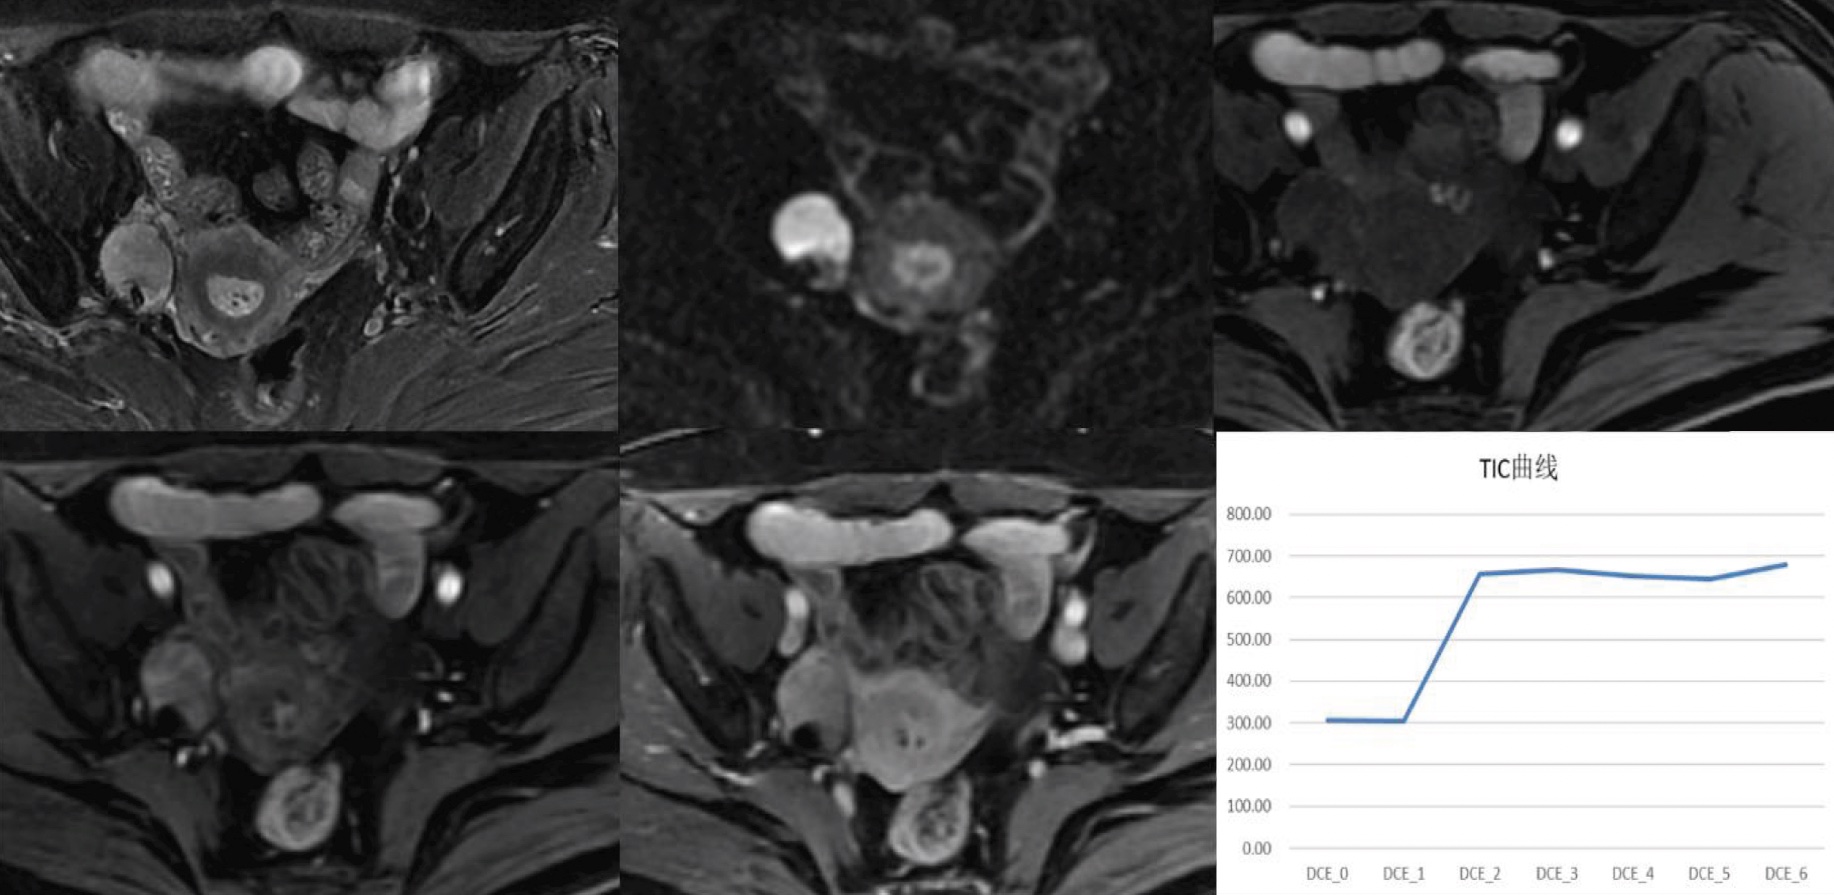
Figure.1 mages showed a 58 year-old woman
with solid ovarian mass on the right side, pathologically diagnosed as
granulosa cell tumor after operation. Axial DWI image showed high signal
intensity, and the TIC curve was type II.
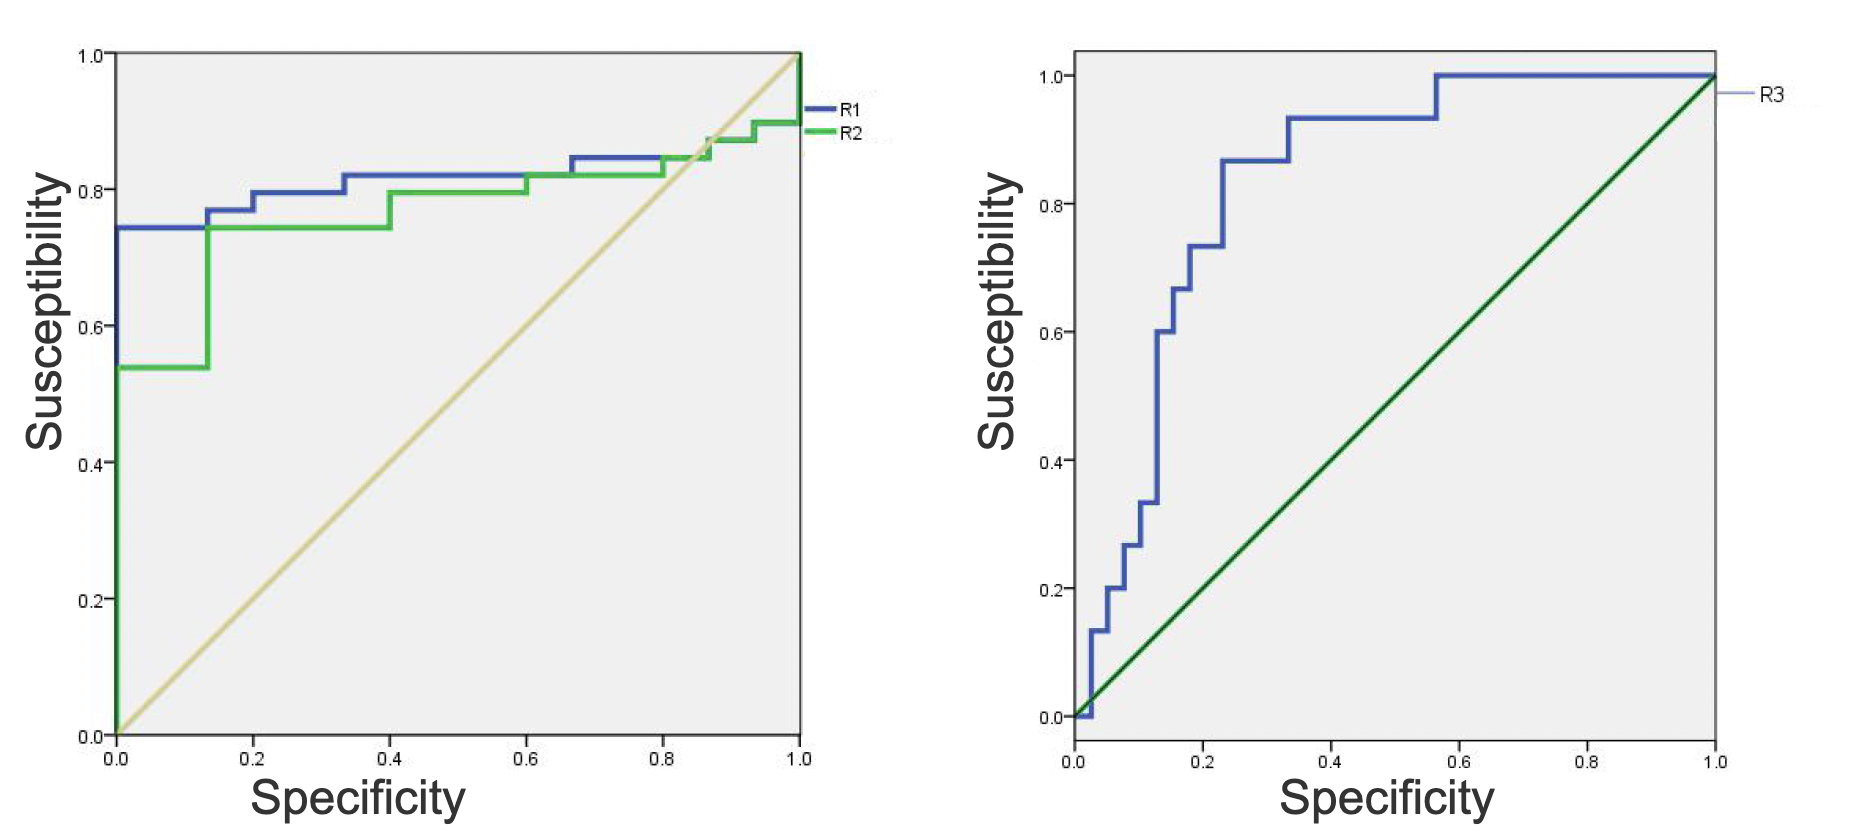
Figure.2 ROC curve analysis of the
diagnostic performance of R1,R2 and R3.
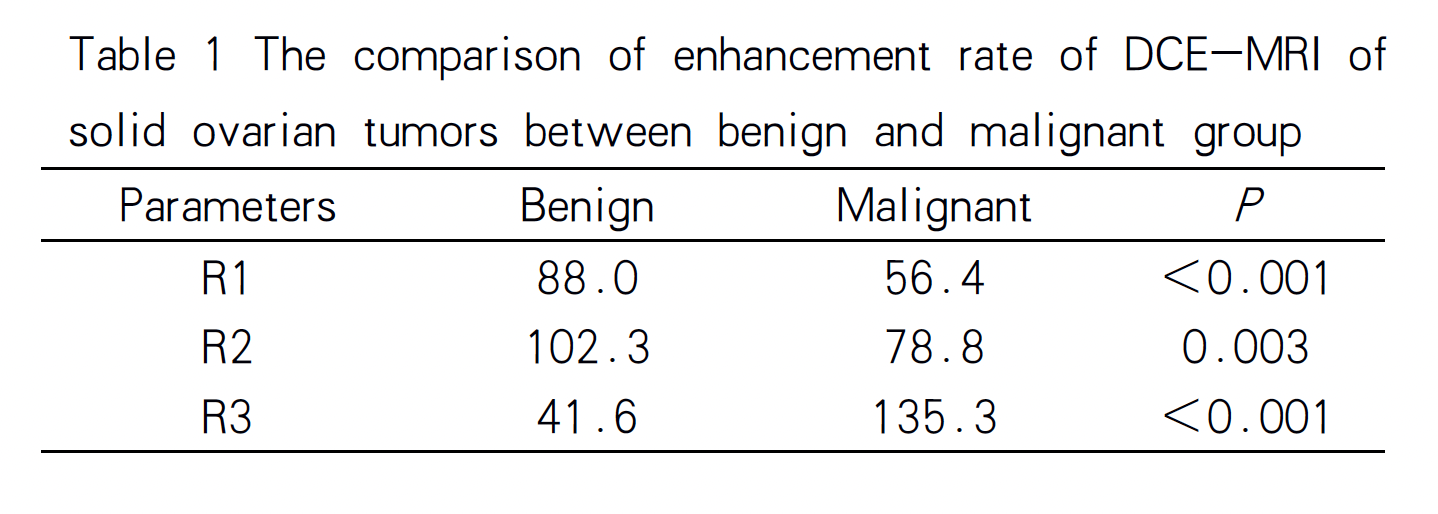
Table 1 The comparison of enhancement rate
of DCE-MRI of
solid ovarian tumors between benign and
malignant group
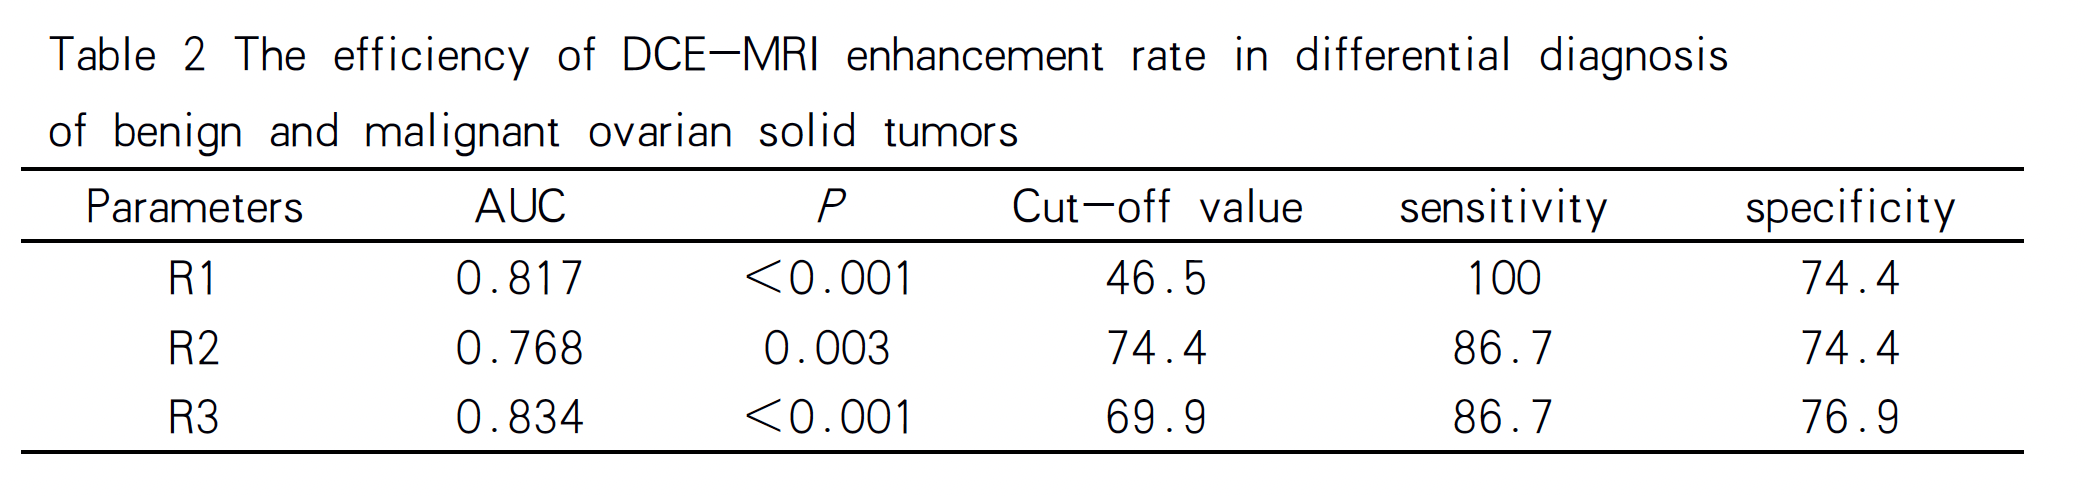
Table 2 The efficiency of DCE-MRI
enhancement rate in differential diagnosis
of benign and malignant ovarian solid
tumors
DOI: https://doi.org/10.58530/2023/3270