3268
Multicenter consistency of quantitative MRI in cervical cancer1Radiation Oncology, The Netherlands Cancer Institute, Amsterdam, Netherlands, 2Clinical Medicine, Aarhus University Hospital, Aarhus, Denmark, 3Radiotherapy, Institute of Oncology Ljubljana, Ljubljana, Slovenia, 4Faculty of Medicine, University of Ljubljana, Ljubljana, Slovenia, 5Radiotherapy, Leiden University Medical Center, Leiden, Netherlands, 6Radiotherapy, Erasmus MC Cancer Institute, University Medical Center Rotterdam, Rotterdam, Netherlands
Synopsis
Keywords: Cancer, Quantitative Imaging, cervical cancer
The reproducibility of quantitative MRI parameters in a multicenter setting is not trivial. In this study we evaluated the in-vivo multicenter consistency of quantitative MRI parameters in cervical cancer patients. DWI, T2 mapping and T1 mapping were available from 66 patients from 3 institutes. ADC values were measured consistently across institutes despite differences in acquisition protocols. For T2 and T1 values differences between institutes were observed, which need to be accounted in future evaluation of the quantitative MRI parameters in relation to treatment outcome.Introduction
Quantitative MRI parameters derived from for example diffusion weighted imaging (DWI) and dynamic contrast-enhanced (DCE) MRI have shown potential to predict treatment outcome in cervical cancer1,2. The next step in the validation of such biomarkers is to test them in a larger multicenter setting. However, the reproducibility of quantitative MRI parameters in a multicenter setting is not trivial. Phantom QA was performed before the start of the IQ-EMBRACE trial to minimize the differences between institutional acquisition protocols3. The aim of this study was to evaluate the in-vivo multicenter consistency of quantitative MRI parameters in cervical cancer patients.Methods
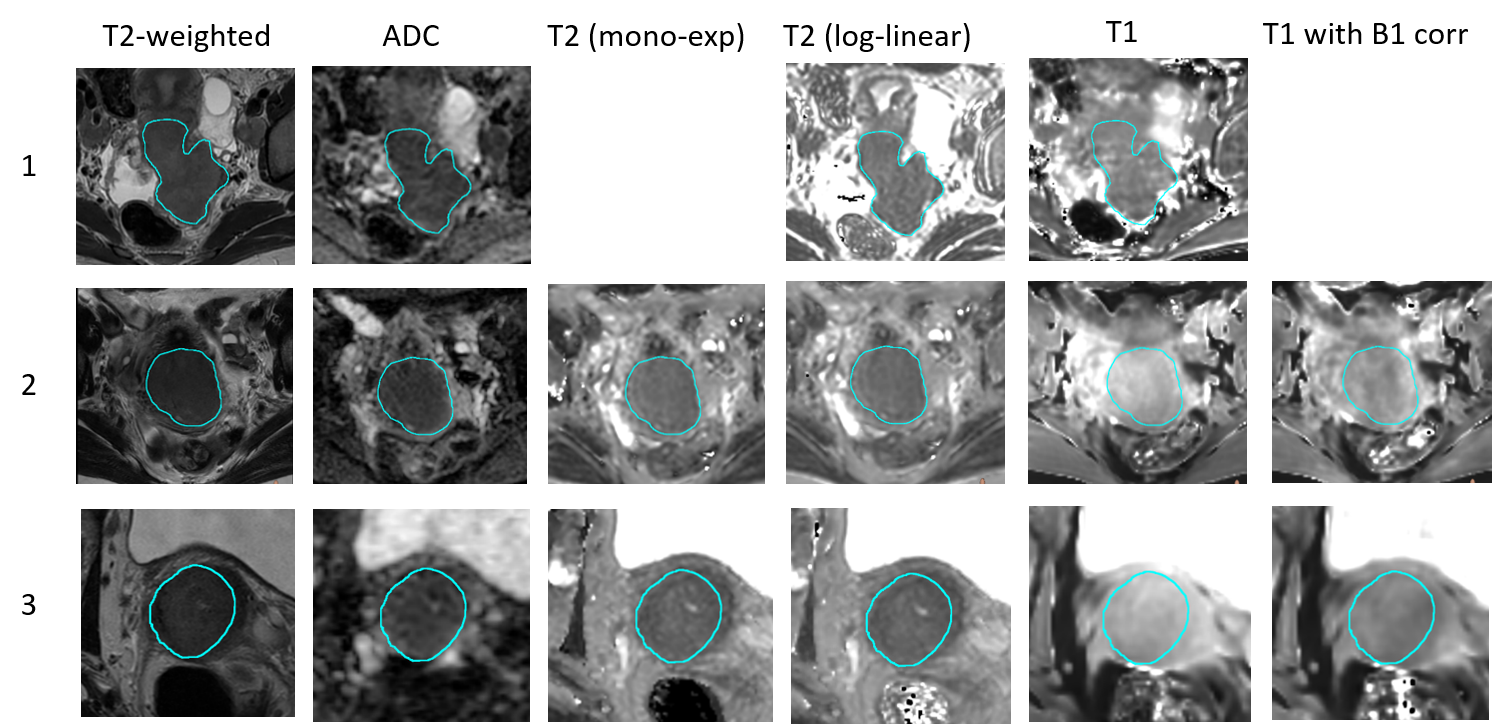
93 patients were included in IQ-EMBRACE in six institutes (clinicaltrials.gov NCT03210428). The study was approved by the institutional research boards and all patients sigend informed consent for participation in the study. For reproducibility assessment the data from the institutes with more than ten patients were included (n = 85, 3 institutes). A pre-treatment MRI exam was performed including a transversal T2-weighted image, diffusion weighted imaging, T2 mapping, T1 mapping with variable flip angle approach (Table 1). An ADC map was generated with a log-linear fit using b-values above 200 s/mm2. T2 maps were generated at the scanner with a mono-exponential fit for institute 2 and 3. For institute 1 these were not available and generated offline with a log-linear fit to the signal intensities of all echo times. For comparison, additional T2 maps were generated for institute 2 and 3 with the same software and the same number of echoes. T1 maps were derived using linear-least squares implementation. For the measurements done at 3T, the T1 map was calculated with and without B1 correction. Tumors were delineated in each center on the T2-weighted MRI according to the EMBRACE guidelines. Median values for the tumor were determined per patient and compared on institutional-level with a non-parametric Kruskal-Wallis test (p < 0.05).Results
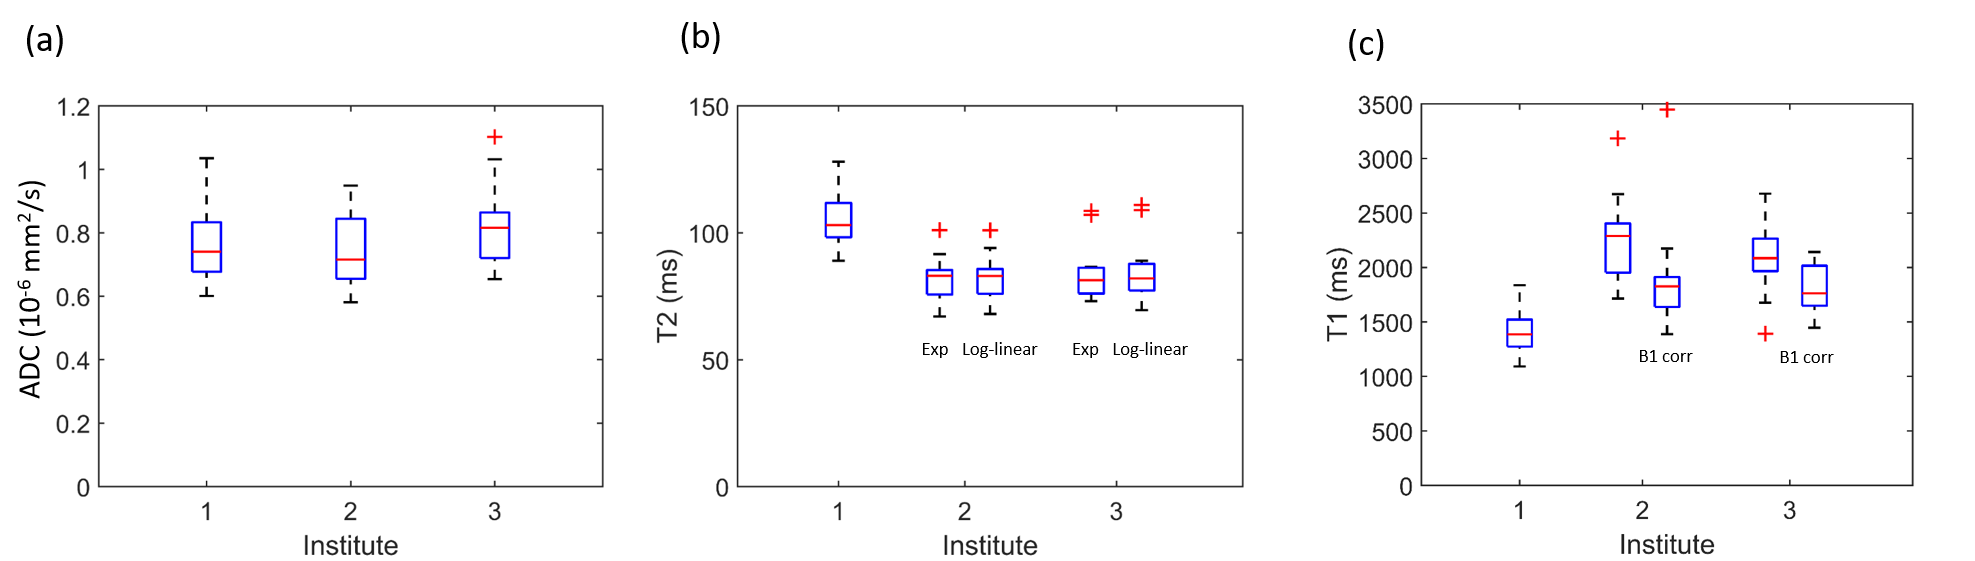
From the 85 patients, 5 patients were excluded due to technical reasons (wrong protocol or issue with data import), whereas for 14 patients the tumor delineations were not available yet. This resulted in a total of 66 data sets analysed (n = 36 for institute 1, n = 15 for institute 2, n = 15 for institute 3). Table 2 shows the patient characteristics per institute. Furthermore, in 2 cases a T2 map could not be calculated due to incomplete data, and in 3 cases the ADC map could not be used due to geometrical distortions.Example images for each institute are shown in Fig. 1. Median ADC values between institutes were not significantly different (p=0.19, Fig. 2). The median T2 values of institute 1 were significantly higher compared to the T2 values of institute 2 and 3 (p < 0.001). The T2 values fitted with a mono-exponential fit were similar to the T2 values estimated with a log-linear fit. The median T1 values were significantly lower in institute 1 compared to the T1 values without B1 correction of institute 2 and 3 (p < 0.001). The T1 values decreased with B1 correction for both institutes.
Discussion
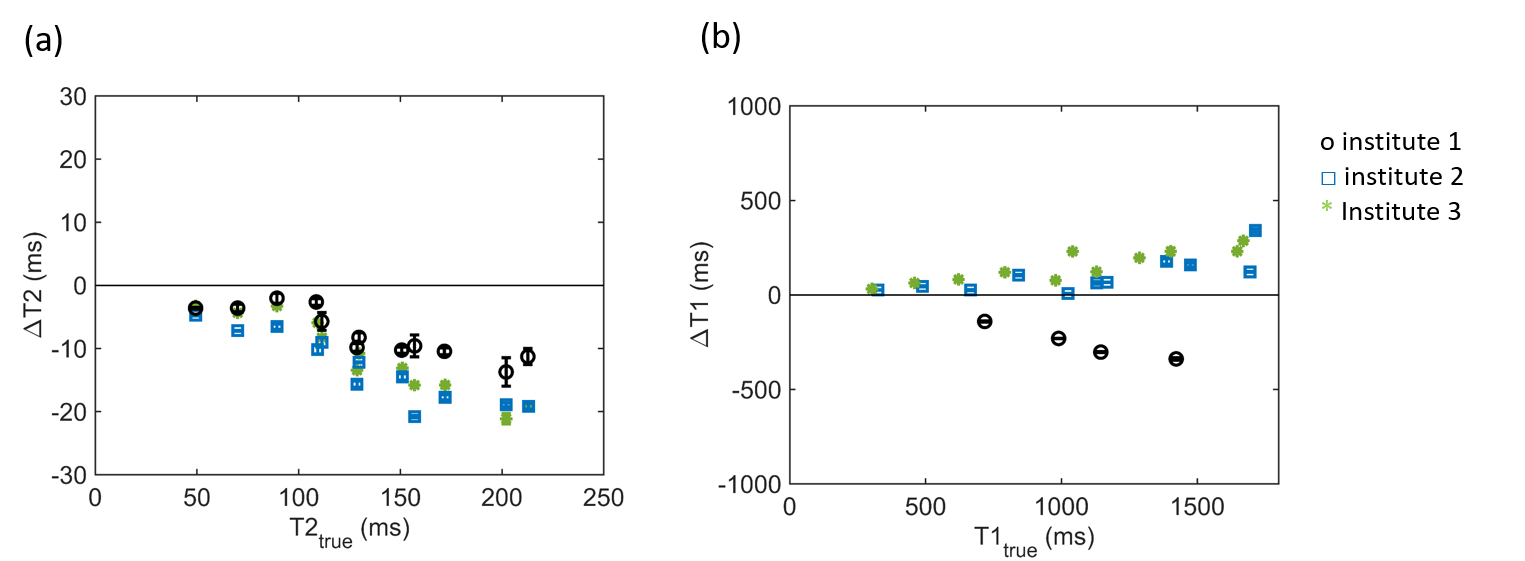
ADC values were measured consistently across institutes despite differences in acquisition protocols. The differences in T2 values may be attributed to the different acquisition methods used, where in institute 1 a series of single echo spin echo acquisitions was acquired, whereas in institute 2 and 3 multi-echo spin echo acquisitions were used. Higher T2 values were also observed with the phantom measurements for institute 1, although the difference was not as large as in the in-vivo data (see Fig. 3a). For T1, a difference in T1 values was observed with previous phantom measurements as well (see Fig. 3b). In addition, the in-vivo differences can also be explained by the difference in field strength, as T1 values are typically 30% higher at 3 T compared to 1.5 T.In-vivo reproducibility assessment requires the same subject to be scanned on different systems, which is logistically challenging. In this study we tried to evaluate multicenter consistency by comparing the median values of tumor tissue between institutes. However, tumors differ across patients. An alternative might be to investigate a representative healthy reference region which is more comparable between patients, for example the healthy myometrium or a muscle. However, the menstrual cycle of a patient can influence the quantitative values in the myometrium4. Muscles have lower signal intensity on T2-weighted images and DWI compared to tumor tissue, resulting in a lower signal-to-noise ratio. Therefore, the differences found with these reference structures might not be representative for differences between institutes in the range of values of tumor tissue.
Conclusion
In this study, the consistency of quantitative MRI parameters in a multi-center setting was shown. ADC values were measured consistently across institutes, whereas differences were found between institutes for T2 and T1 mapping. These differences need to be accounted in future evaluation of the quantitative MRI parameters in relation to treatment outcome.Acknowledgements
This work was funded by a research grant from Varian Medical Systems.References
1. Halle C, Andersen E, Lando M, Aarnes EK, Hasvold G, Holden M, Syljuåsen RG, Sundfør K, Kristensen GB, Holm R, Malinen E, Lyng H. Hypoxia-induced gene expression in chemoradioresistant cervical cancer revealed by dynamic contrast-enhanced MRI. Cancer Res. 2012 Oct 15;72(20):5285-95. doi: 10.1158/0008-5472.
2. Skipar K, Hompland T, Lund KV, Løndalen A, Malinen E, Kristensen GB, Lindemann K, Nakken ES, Bruheim K, Lyng H. Risk of recurrence after chemoradiotherapy identified by multimodal MRI and 18F-FDG-PET/CT in locally advanced cervical cancer. Radiother Oncol. 2022 Sep 14;176:17-24. doi: 10.1016/j.radonc.2022.09.002.
3. van Houdt PJ, Kallehauge JF, Tanderup K, Nout R, Zaletelj M, Tadic T, van Kesteren ZJ, van den Berg CAT, Georg D, Côté JC, Levesque IR, Swamidas J, Malinen E, Telliskivi S, Brynolfsson P, Mahmood F, van der Heide UA; EMBRACE Collaborative Group. Phantom-based quality assurance for multicenter quantitative MRI in locally advanced cervical cancer. Radiother Oncol. 2020 Dec;153:114-121. doi: 10.1016/j.radonc.2020.09.013.
4. Kido A, Kataoka M, Koyama T, Yamamoto A, Saga T, Togashi K. Changes in apparent diffusion coefficients in the normal uterus during different phases of the menstrual cycle. Br J Radiol. 2010 Jun;83(990):524-8. doi: 10.1259/bjr/11056533. PMID: 20505034; PMCID: PMC3473588.
Figures