3266
Multi-exponential model of diffusion signal with fixed ADCs in healthy and cancerous cervix tissues1Radiology, University of California San Diego, La Jolla, CA, United States, 2Surgical Sciences, Uppsala University, Uppsala, Sweden, 3Radiology, Uppsala University, Uppsala, Sweden, 4Radiation Medicine, University of California San Diego, La Jolla, CA, United States, 5Neurosciences, University of California San Diego, La Jolla, CA, United States, 6Ob/Gyn & Reproductive Sciences, University of California San Diego, La Jolla, CA, United States
Synopsis
Keywords: Pelvis, Cancer
Restriction spectrum imaging (RSI) has shown potential to become a DWI-based, contrast-free diagnostic tool for cancer as it separates the different water pools in tissues. Here, we describe the diffusion signal of cancerous and healthy cervical tissues using RSI. Multi-exponential models with fixed ADCs were determined and the signal contribution of each component estimated. Initial results indicate that the slowest diffusion compartment of a tetra-exponential RSI model has the potential to isolate cervical cancer signal from that of surrounding tissues. This model may increase the sensitivity and specificity of DWI to evaluate response to treatment of cervical cancer patients.Introduction
Cervical cancer is the fourth most common cause of cancer and cancer mortality in women worldwide.1 The standard of care to evaluate response to treatment is PET/CT before radiation or chemoradiation therapy to PET/CT 3 months post-treatment.2 This delay allows post-treatment edema and inflammation to subside, avoiding false indication of post-treatment disease progression.3,4 As a result, women with true post-treatment disease progression wait 3 months to receive proper treatment. Imaging techniques that can evaluate response to treatment earlier would improve care management for these patients.Restriction spectrum imaging (RSI) is an advanced DWI technique that uses multi-shell data to identify different water pools and demonstrates tumor discrimination from post-treatment edema in brain cancer patients.5 RSI also shows potential in increasing cancer conspicuity in prostate6,7 and breast7,8 by removing signals from benign tissues on estimated diffusion-derived maps. Here, we present initial work tailoring RSI to cervical cancer imaging by establishing a unified multi-exponential model to describe cancerous and healthy cervical tissues.
Methods
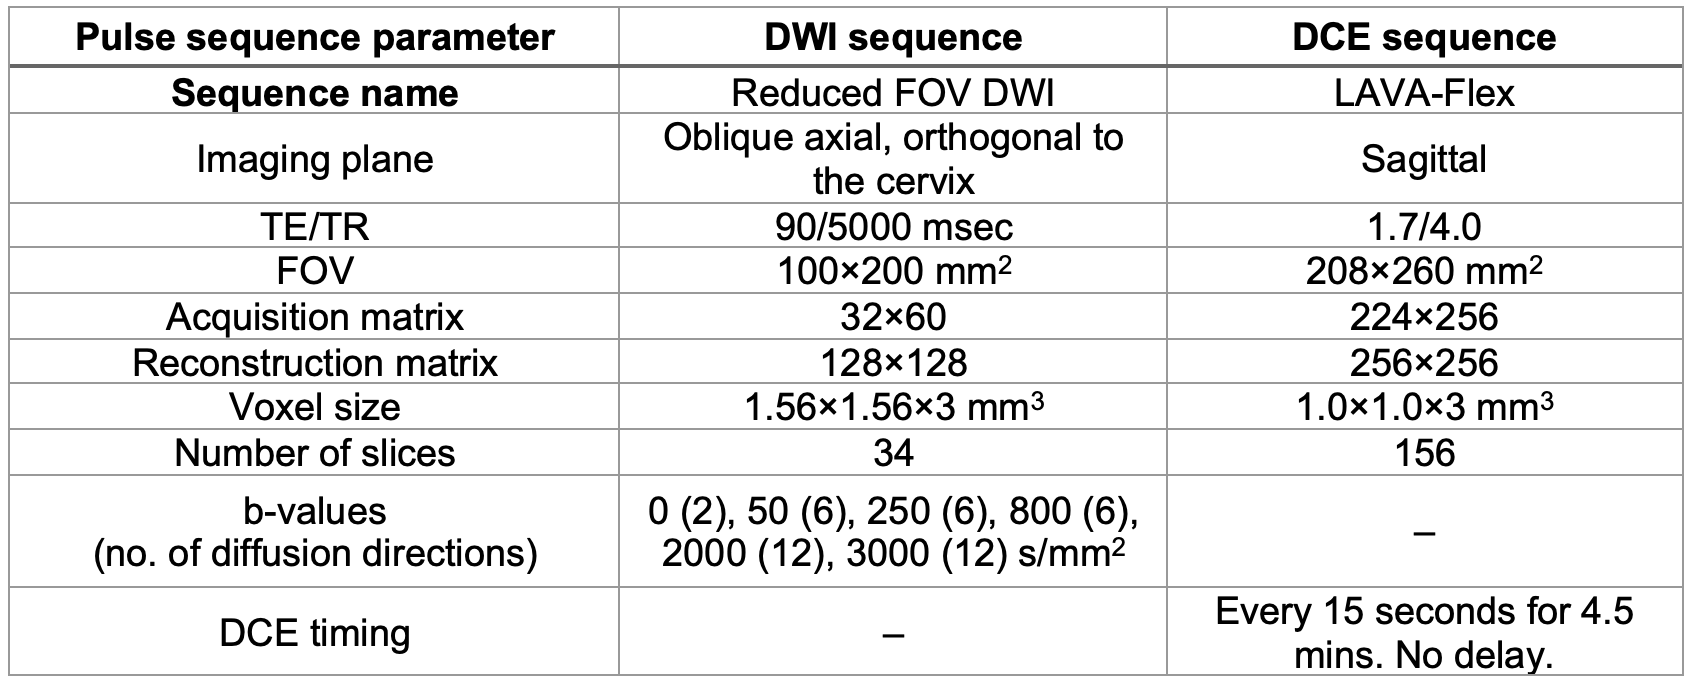
Diagnostic or surveillance MRI at 3T was performed in a group of 6 pathology-proven cervical cancer patients (before treatment) and 5 healthy controls. The DWI and dynamic contrast enhanced (DCE) pulse sequence parameters are shown in Table 1. Reduced field-of-view (FOV) was used to reduce the magnitude of artifacts caused by B0-inhomogeneties.All analyses were performed in Matlab (Version 2022a. Natick, Massachusetts. The MathWorks Inc.) and SPSS (Version 28.0, Arkmonk, NY. IBM). Healthy cervix and cancer ROIs (informed by DCE and anatomical images) were drawn on DWI images from healthy controls and cancer patients by two body Radiologists.
In RSI, global apparent diffusion coefficients (ADCs) are first estimated across all voxels from cervix and cancer ROIs using multi-exponential models. The number of exponentials is organ-specific and is limited by the number of non-zero b-values. Once the fixed ADCs are determined, the signal contributions, Ci,N, for all voxels can be estimated. This strategy allows the use of a single model throughout all voxels to compare signal contributions across water compartments.
DWI data from healthy cervix and cancer lesions were first averaged across diffusion directions for each b-value, distortion and noise corrected, and normalized by the 95th percentile of signal intensity value in b=0 s/mm2 volume (to preserve T2 information).7 The diffusion signal was then modeled as the linear combination of multiple exponential decays:
$$S_{diff}(b,N) = S_0\sum_{i}^{N}e^{-bD_{i,N}} = \sum_{i}^{N}C_{i,N}e^{-bD_{i,N}} (1)$$
where N is the total number of exponential decays (here 2, 3 or 4), Ci,N are the signal contributions of each exponential component, b are the b-values in s/mm2, and Di,N are the ADCs of each exponential component (D1,N<Di,N). The relative Bayesian information criterion (BIC) was estimated for all multi-exponential models; it was selected because it penalizes the number of parameters.9 Lower BIC values indicate improved model fitting. Signal contributions Ci,N were compared between healthy and cancerous cervical tissues across RSI models with different number of exponentials using a two-way repeated-measures analyses of variance with Sidak post hoc tests.
Results
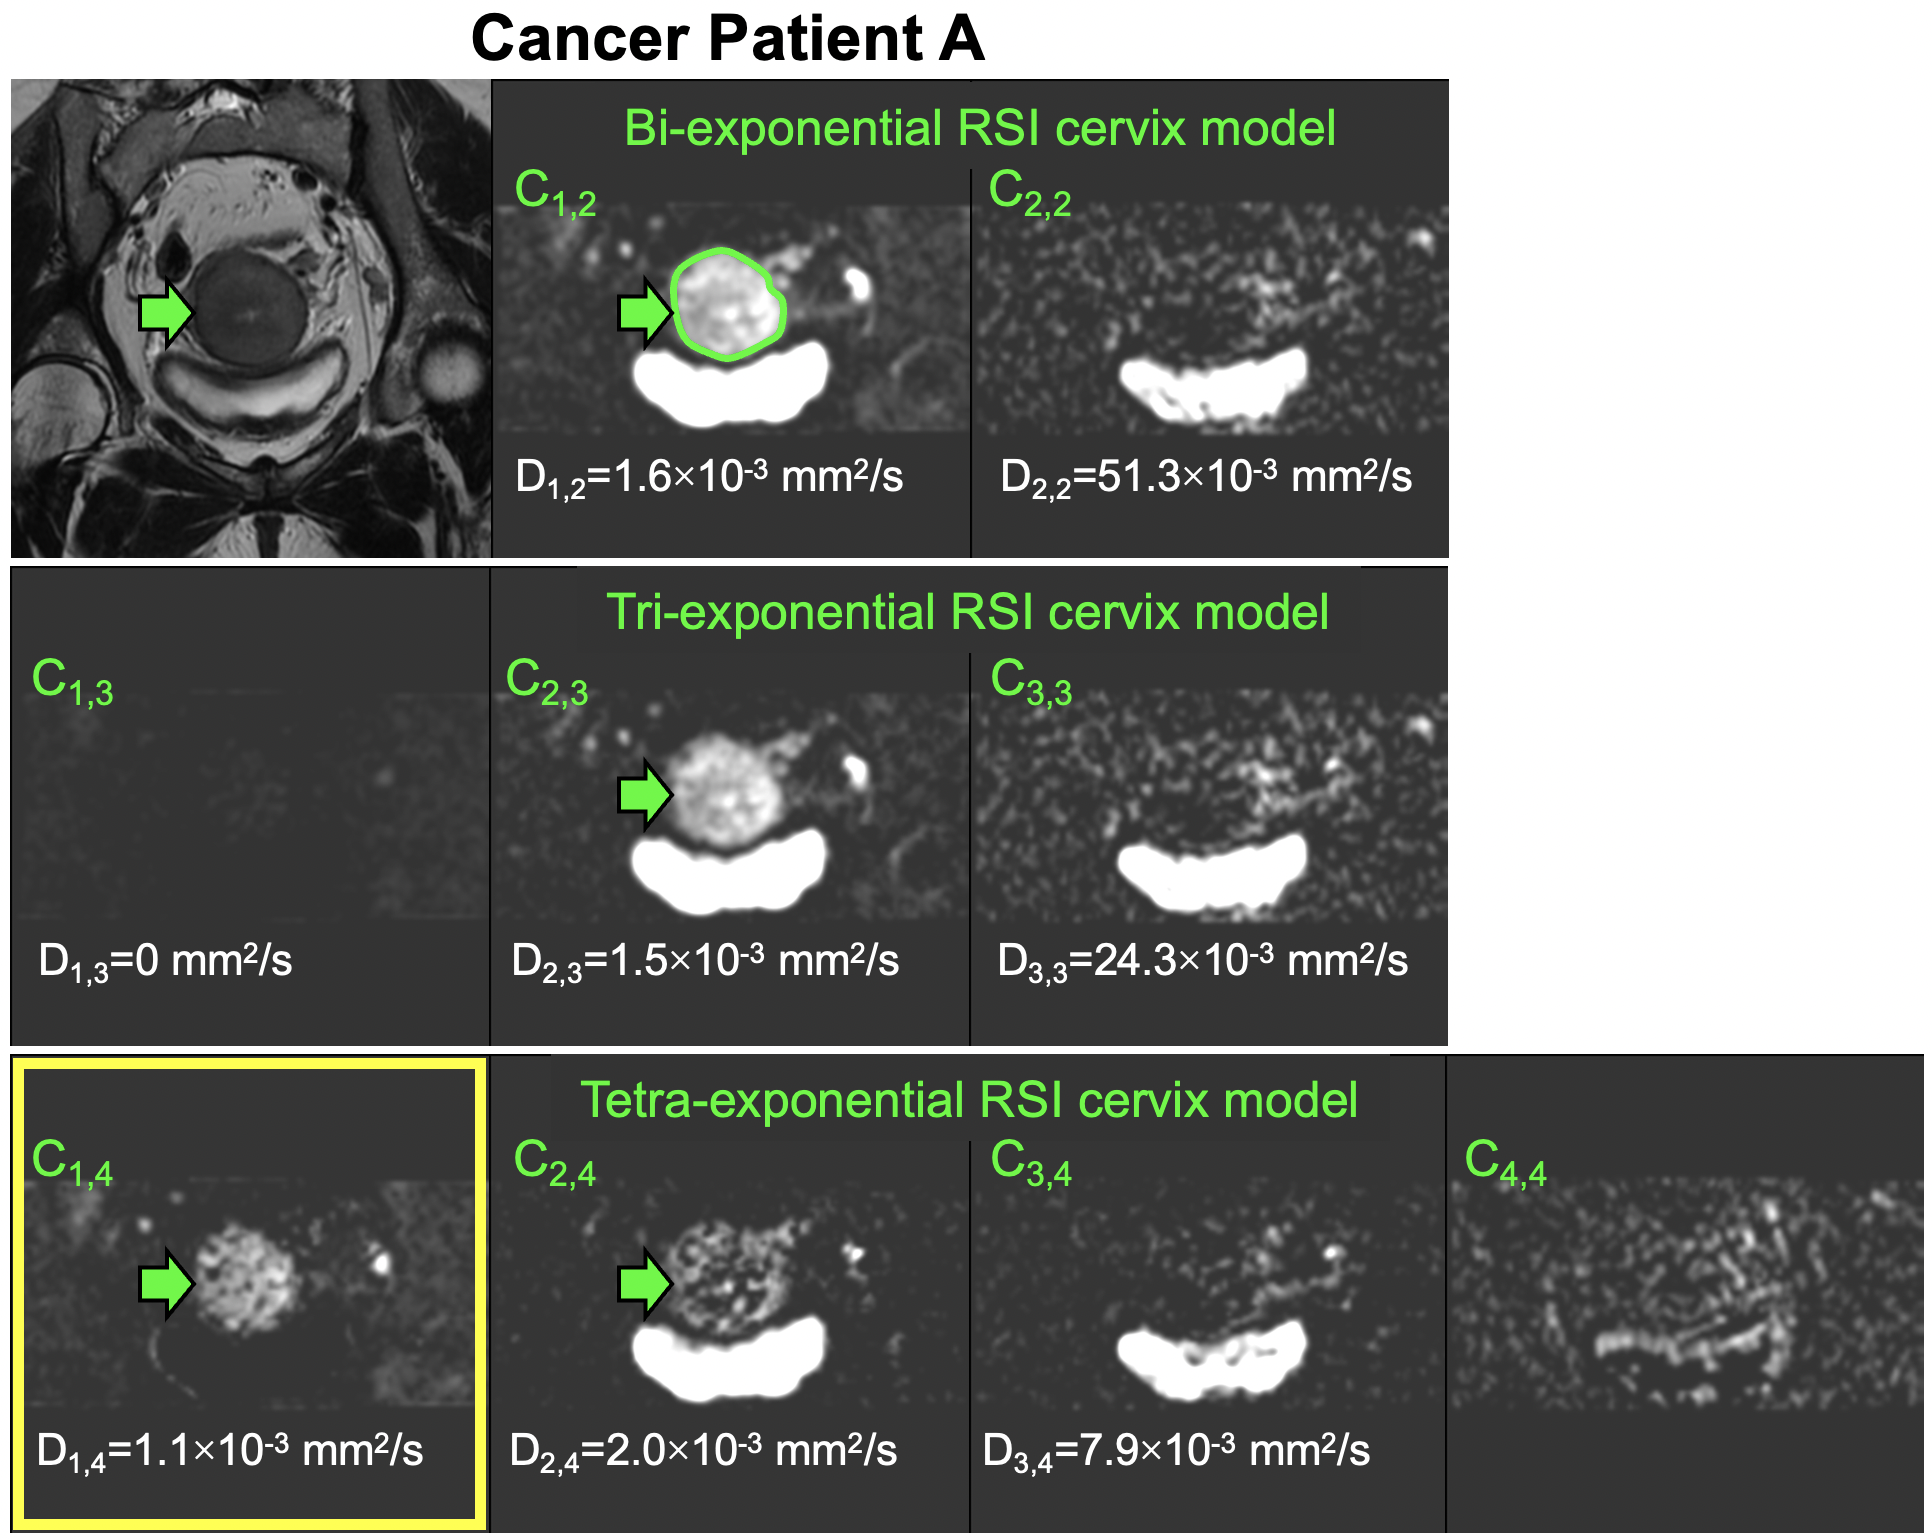
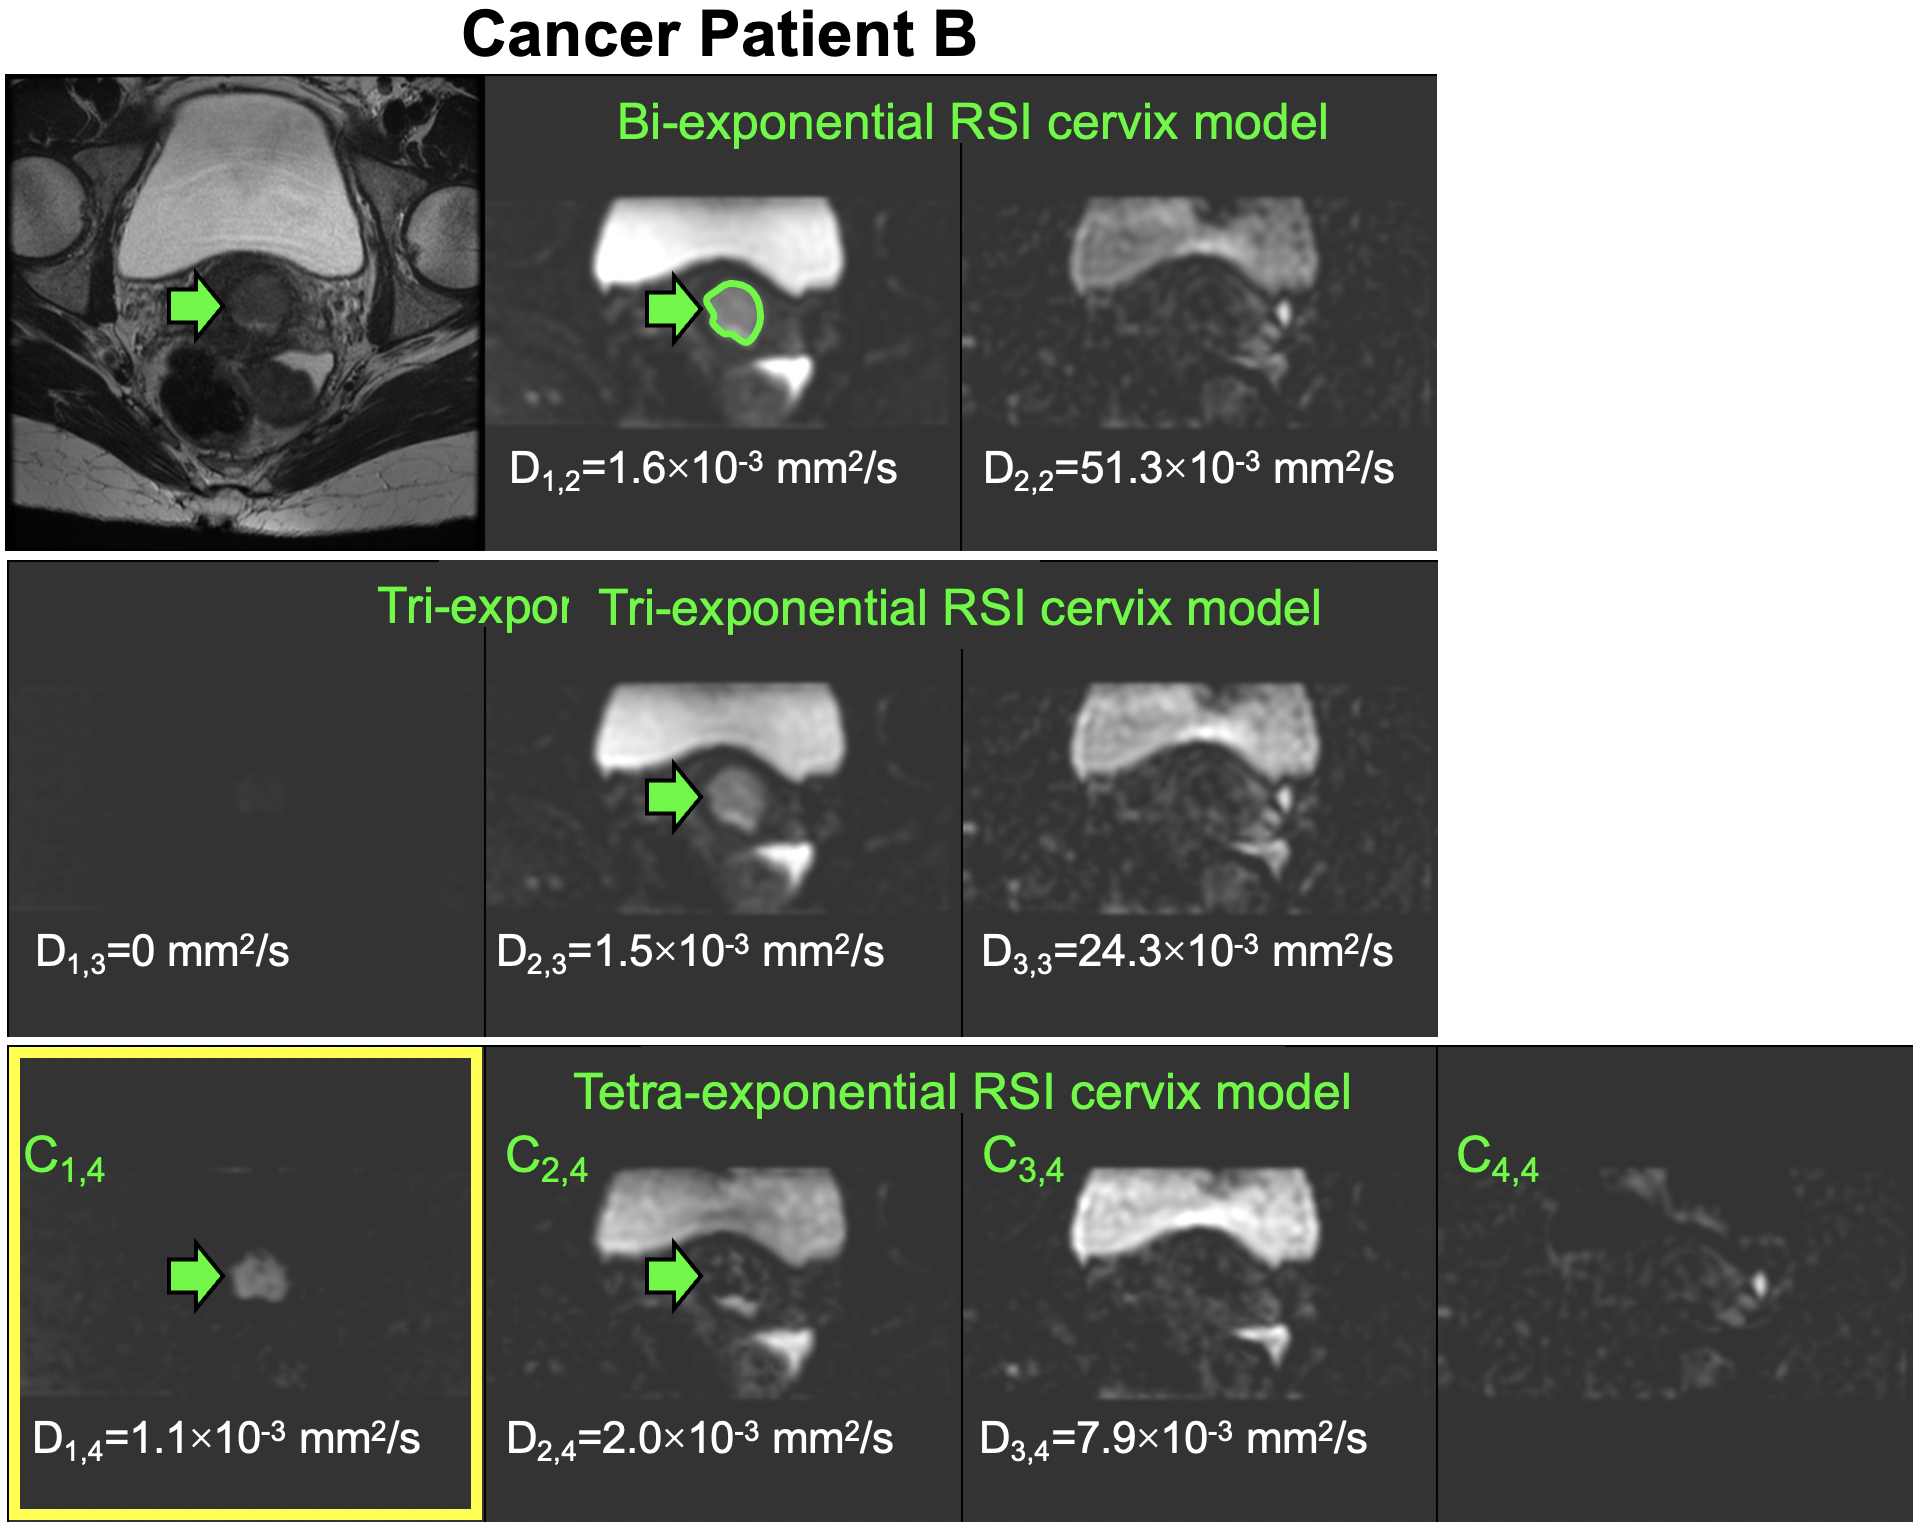
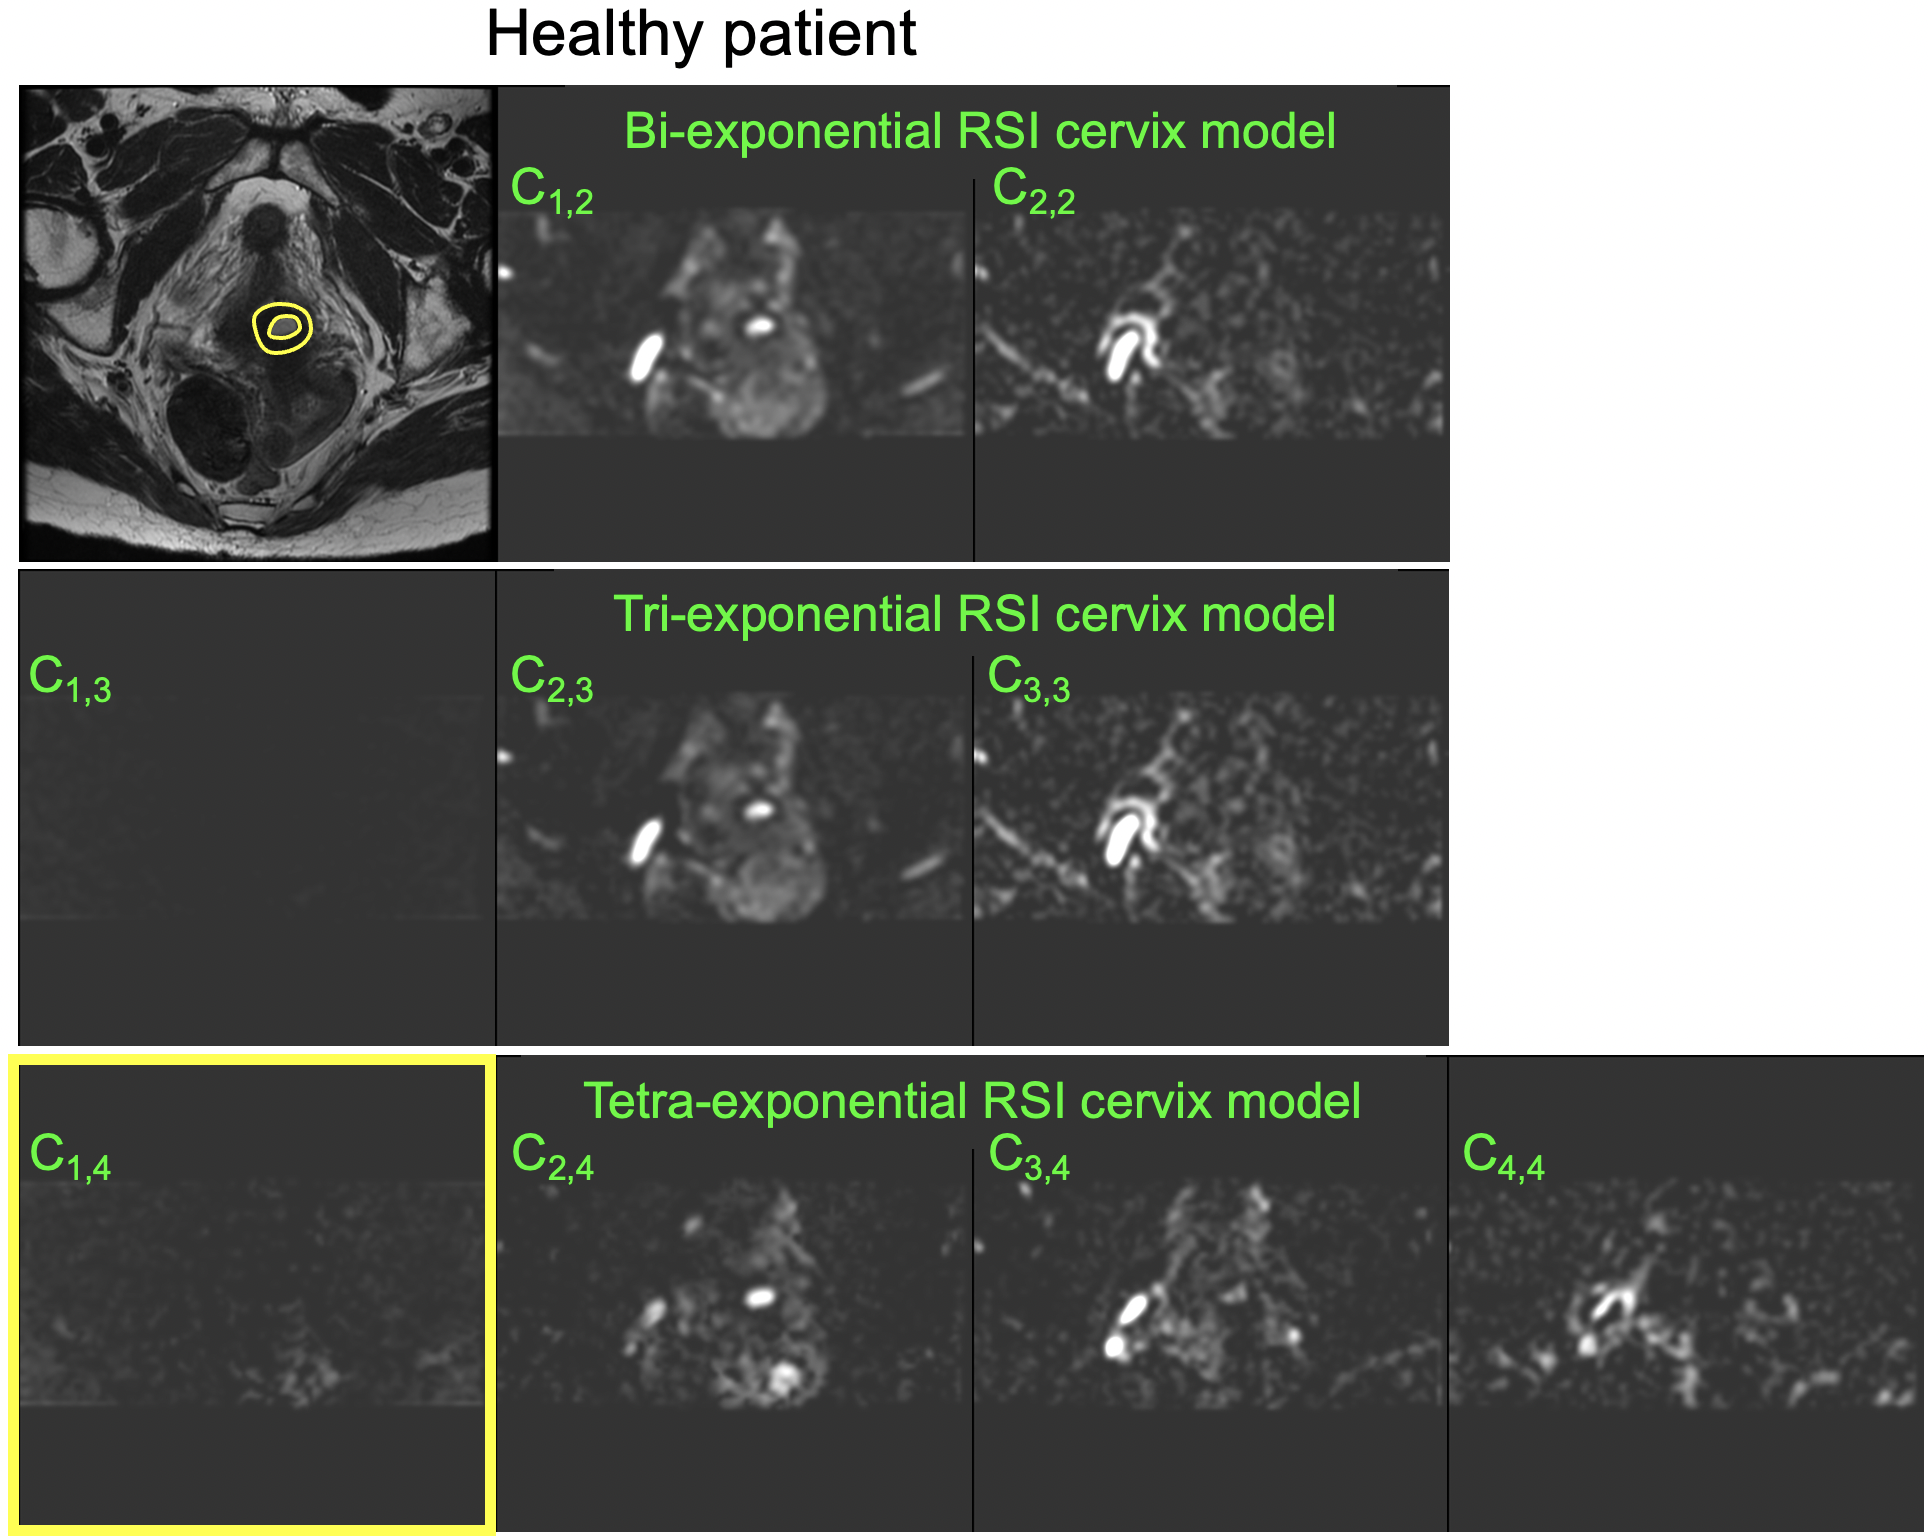
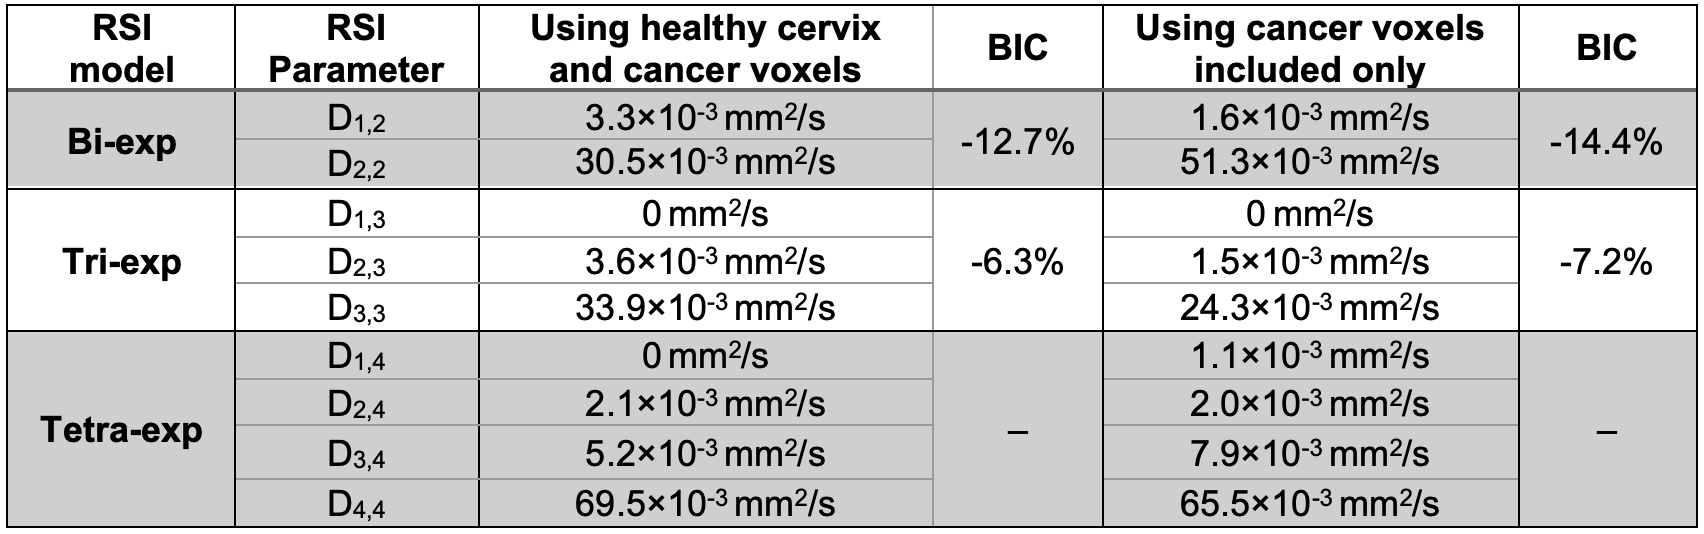
Data from 4 patients were excluded from the analysis because the lesion size was <1mm3. Initially, we fitted the RSI multi-exponential models (Eq.1) to data from both healthy cervix and cancer, using a similar approach to that previously used for other organs.7 However, given that healthy cervix signal was observed to have almost completely decayed at TE=90msec, we decided to only fit cancer DWI data into the RSI multi-exponential models. The differences in estimated Di,N and BIC values are shown in Table 2. The BIC scores indicate that bi-exponential models are sufficient for describing the diffusion-weighted signal. From here on, we only present results from the cervical cancer RSI model.In general, the RSI signal contribution maps from bi- and tri-exponential models were similar (Figs. 1&2). However, the slowest diffusion compartment C1,4 of the tetra-exponential RSI model appears to isolate cancer signal from most other surrounding tissues, including the bladder (Figs. 1&2, yellow box). The tumor is also somewhat visible in C2,4. The same maps are shown for a healthy patient in Fig. 3. No differences (p>0.05) were found between signal contributions Ci,N between cervical and cancer tissues.
Discussion and Conclusions
In this work, we have shown the potential of RSI to isolate cervical cancer signal from other tissues in the FOV using a tetra-exponential model, without exogenous contrast. This model contains a restricted, hindered, and two fast diffusion components. We interpret the origin of the restricted compartment as cancer cells, while the two fast compartments originate from tissues with long T2 and vascular flow.In contrast with other tissues, the cervix RSI model is unique in that it benefits from modeling the signal of cancer on its own. We attribute this to the hypointense signal of the healthy cervix at long TEs. As further model refinement and testing are necessary, future work will focus on adding more patients, incorporating DWI data from post-treatment imaging to characterize the edema signal present early after treatment, and evaluating the diagnostic value of multi-exponential models in an independent cohort compared to DCE-MRI and PET/MRI.
Acknowledgements
Supported by NIH R37CA249659 and a research grant from General Electric Healthcare.References
1 Bray, F. et al. Global cancer statistics 2018: GLOBOCAN estimates of incidence and mortality worldwide for 36 cancers in 185 countries. CA Cancer J Clin 68, 394-424, doi:10.3322/caac.21492 (2018).
2 Koh, W. J. et al. Cervical Cancer, Version 3.2019, NCCN Clinical Practice Guidelines in Oncology. J Natl Compr Canc Netw 17, 64-84, doi:10.6004/jnccn.2019.0001 (2019).
3 Ho, K. C. et al. Correlation of apparent diffusion coefficients measured by 3T diffusion-weighted MRI and SUV from FDG PET/CT in primary cervical cancer. Eur J Nucl Med Mol Imaging 36, 200-208, doi:10.1007/s00259-008-0936-5 (2009).
4 Schwarz, J. K., Siegel, B. A., Dehdashti, F. & Grigsby, P. W. Association of posttherapy positron emission tomography with tumor response and survival in cervical carcinoma. JAMA 298, 2289-2295, doi:10.1001/jama.298.19.2289 (2007).
5 White, N. S. et al. Improved conspicuity and delineation of high-grade primary and metastatic brain tumors using "restriction spectrum imaging": quantitative comparison with high B-value DWI and ADC. AJNR Am J Neuroradiol 34, 958-964, S951, doi:10.3174/ajnr.A3327 (2013).
6 Feng, C. H. et al. Voxel-level Classification of Prostate Cancer on Magnetic Resonance Imaging: Improving Accuracy Using Four-Compartment Restriction Spectrum Imaging. J Magn Reson Imaging 54, 975-984, doi:10.1002/jmri.27623 (2021).
7 Rodriguez-Soto, A. E. et al. Characterization of the diffusion signal of breast tissues using multi-exponential models. Magn Reson Med 87, 1938-1951, doi:10.1002/mrm.29090 (2022).
8 Andreassen, M. M. S. et al. Discrimination of Breast Cancer from Healthy Breast Tissue Using a Three-component Diffusion-weighted MRI Model. Clin Cancer Res 27, 1094-1104, doi:10.1158/1078-0432.CCR-20-2017 (2021).
9 Schwarz, G. Estimating the Dimension of a Model. The Annals of Statistics 6, 461-464 (1978).
Figures