3262
The value of multimodal functional magnetic resonance imaging in differentiating p53abn from p53wt endometrial carcinoma1Department of Radiology, the First Affiliated Hospital of Dalian Medical University, Dalian, China
Synopsis
Keywords: Cancer, Uterus
p53 genotyping is important for EC lymph node metastasis and prognosis determination.Multimodal MRI techniques APTw, T2 mapping, mDIXON-Quant and DWI are new tools to determine p53 genotyping.Results of this study indicate the APT value and R2* value in the p53abn group were higher than those in the p53wt group, while the ADC value was lower than those in the p53wt group.Therefore, APTw, mDIXON-Quant and DWI techniques can quantitatively identify p53abn and p53wt EC, it provides a new way for preoperative quantitative evaluation of EC molecular typing.Objective
To explore the value of multimodal functional magnetic resonance imaging in differentiating p53 abnormal (p53abn) from p53 wild-type (p53wt) endometrial carcinoma (EC).Materials and Methods
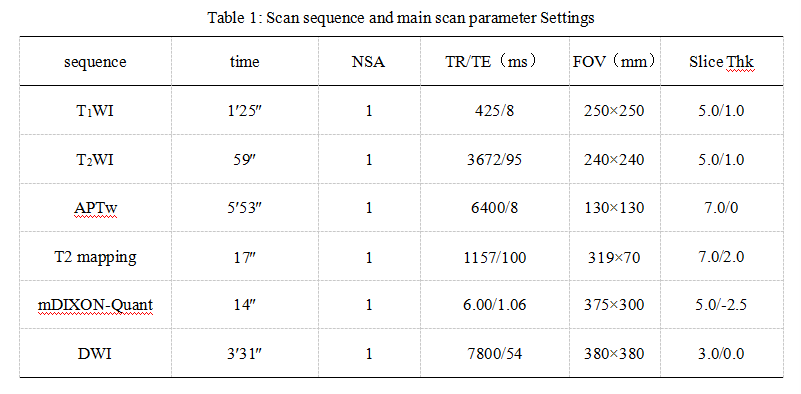
The data of 47 EC patients confirmed by surgery and pathology were analyzed retrospectively, including 14 cases of p53abn and 33 cases of p53wt. The preoperative MR scanning sequences included amide proton transfer weighted (APTw) imaging, T2 mapping, mDIXON-Quant imaging, diffusion weighted imaging (DWI). After post-processing, APT, T2, lateral relaxation rate (R2*), fat fraction (FF), and apparent diffusion coefficient (ADC) maps were obtained. The APT, T2, R2*, FF and ADC values of the two groups of cases were measured by two observers respectively. Intra class correlation coefficients (ICC) were used to test the consistency of the measurement results of the two observers for each parameter value of the two groups of cases. Independent sample t-test or Mann Whitney U test was used to compare the differences of each parameter value of the two groups of cases, ROC curve was used to evaluate the parameters with statistical differences and the efficacy of the combination in identifying p53abn and p53wt EC, and Delong test was used to compare the differences between area under curve (AUC).Results
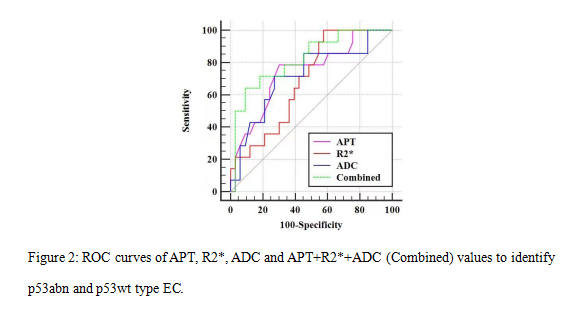
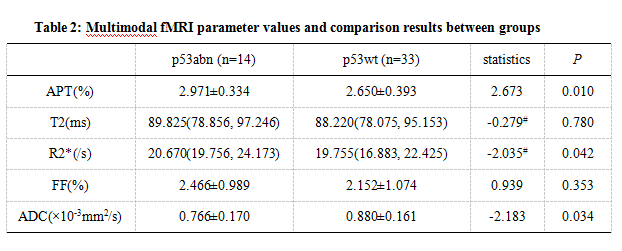
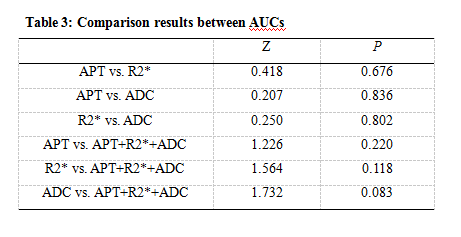
The consistency of the data measured by the two observers were good (ICC value>0.75). The APT value and R2* value in the p53abn group were higher than those in the p53wt group, while the ADC value was lower than those in the p53wt group, with a statistically significant difference (P<0.05). There was no statistically significant difference in T2 value and FF value between the two groups (P>0.05). The AUCs of APT, R2*, ADC and APT+R2*+ADC values for identification of p53abn and p53wt EC were 0.739, 0.689, 0.718 and 0.820, respectively. There were no statistical difference between each AUC (P>0.05).Conclusion
APTw, mDIXON-Quant and DWI techniques can quantitatively identify p53abn and p53wt EC, it provides a new way for preoperative quantitative evaluation of EC molecular typing, which has certain clinical application value.Acknowledgements
noneReferences
[1] Sung H, Ferlay J, Siegel RL, et al. Global Cancer Statistics 2020: GLOBOCAN Estimates of Incidence and Mortality Worldwide for 36 Cancers in 185 Countries. CA Cancer J Clin, 2021, 71(3):209-249.
[2] Li Y, Feng J, Zhao C, et al. A new strategy in molecular typing: the accuracy of an NGS panel for the molecular classification of endometrial cancers. Ann Transl Med, 2022, 10(16):870.
[3] Li JJX, Ip PPC. Endometrial Cancer: An Update on Prognostic Pathologic Features and Clinically Relevant Biomarkers. Surg Pathol Clin, 2022, 15(2):277-299.
[4] Canar J, Manandhar-Sasaki P, Bargonetti J. Mutant C. elegans p53 Together with Gain-of-Function GLP-1/Notch Decreases UVC-Damage-Induced Germline Cell Death but Increases PARP Inhibitor-Induced Germline Cell Death. Cancers (Basel), 2022, 14(19):4929.
[5] Raffone A, Travaglino A, Cerbone M, et al. Diagnostic accuracy of p53 immunohistochemistry as surrogate of TP53 sequencing in endometrial cancer. Pathol Res Pract, 2020, 216(8):153025.
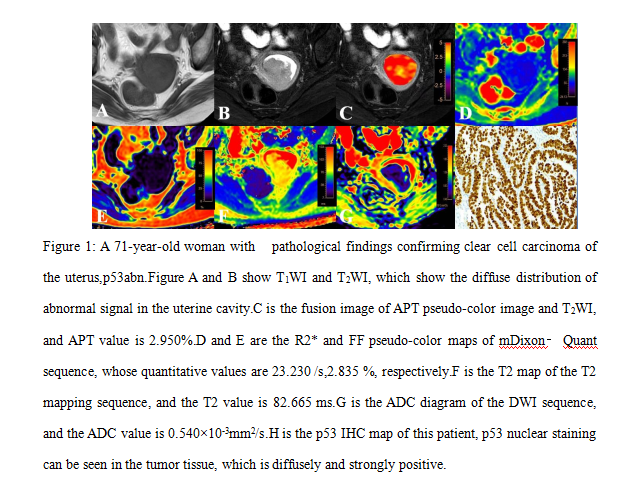
Figures