3257
Quantitative assessment of HIF-1a expression in endometrial cancer by DCE-MRI combined ESWAN multiparameter imaging
Xie Zongyuan1, Tian Shifeng1, and Liu Ailian1
1Department of Radiology, the First Affiliated Hospital of Dalian Medical University, Dalian, China
1Department of Radiology, the First Affiliated Hospital of Dalian Medical University, Dalian, China
Synopsis
Keywords: Uterus, Cancer
Hypoxia -inducible factor (HIF-1α) is a major transcriptional factor regulating gene expression under hypoxic conditions. High expression of HIF-1α contributes to high aggressiveness or poor prognosis of cervical carcinoma. Multimodal MRI techniques DCE-MRI and ESWAN are new tools to determine the expression of HIF-1α.Its quantitative parameters Ktrans , Kep R2 * and T2* values were correlated with HIF-1a expression . Therefore,both DCE-MRI and ESWAN techniques can effectively evaluate HIF-1a expression in endometrial cance.Objective
To explore the value of dynamic contrast-enhanced magnetic resonance imaging(DCE-MRI) and enhanced T2* weighted angiography(ESWAN) quantitative parameters in evaluating hypoxia -inducible factor (HIF-1a )expression in endometrial carcinoma (EC).Materials and Methods
The data of 122 patients with EC confirmed by surgery and pathology were analyzed retrospectively, including 65 patients with high expression of HIF-1a and 57 patients with low expression of HIF-1a.The preoperative MR scanning sequence included DCE-MRI and ESWAN. After post-processing, volume transfer constant( Ktrans), leakage Space(Ve),rate constant(Kep),magnitude,phase,R2*,T2 * images were obtained.Measurement of DCE-MRI quantitative parameters: Ktrans, Ve, Kep values, ESWAN quantitative parameters: amplitude, phase, R2*, T2* values in two groups of cases.The differences of the parameters of the two groups were compared by independent sample t-test or Mann Whitney U test. ROC curve was used to evaluate the parameters with statistical differences and to evaluate the effectiveness of evaluating HIF-1a expression after combination.Results
The Ktrans, Ve, Kep values and amplitude value, phase value, R2 * and T2 * values of the HIF-1a high expression group were 0.448±0.178 /min,0.314±0.265,2.167±1.104/min, 862.947±285.665,0.031±0.032,14.593±4.060 Hz,97.316±55.089 ms.The above parameter values of the HIF-1a low expression group were 0.360±0.143/min,0.324±0.219,1.540±0.798/min,838.800±303.054,0.0364±0.040,11.998±2.84 0Hz,116.110±52.368 ms.The Ktrans , Kep and R2 * values of the HIF-1a high expression group were higher than those of the HIF-1a low expression group (P<0.05),T2* value was lower than in the HIF-1a low expression group (P<0.05),and there was no difference in Ve, amplitude and phase values between the two groups (P>0.05). The AUCs of Ktrans, Kep, R2*, T2*, and Ktrans+ Kep+R2*+T2* values evaluating HIF-1a expression were 0.634,0.677,0.697,0.680,0.803, and there was no significant difference among the AUC values (P>0.05).Conclusion
Both DCE-MRI and ESWAN techniques can effectively evaluate HIF-1a expression in endometrial cance, and their combined application can improve the evaluation efficiency.Acknowledgements
noneReferences
[1] Ironi G, Mapelli P, Bergamini A, et al. Hybrid PET/MRI in Staging Endometrial Cancer: Diagnostic and Predictive Value in a Prospective Cohort. Clin Nucl Med, 2022, 47(3):e221-e229.
[2] Bi Q , Bi G, Wang J, et al. Diagnostic Accuracy of MRI for Detecting Cervical Invasion in Patients with Endometrial Carcinoma: A Meta-Analysis.J Cancer. 2021 ,12(3):754-764.
[3]Ye Z, Ning G, Li X, et al. Endometrial carcinoma: use of tracer kinetic modeling of dynamic contrast-enhanced MRI for preoperative risk assessment.Cancer Imaging. 2022 Mar 9;22(1):14-24.
Figures
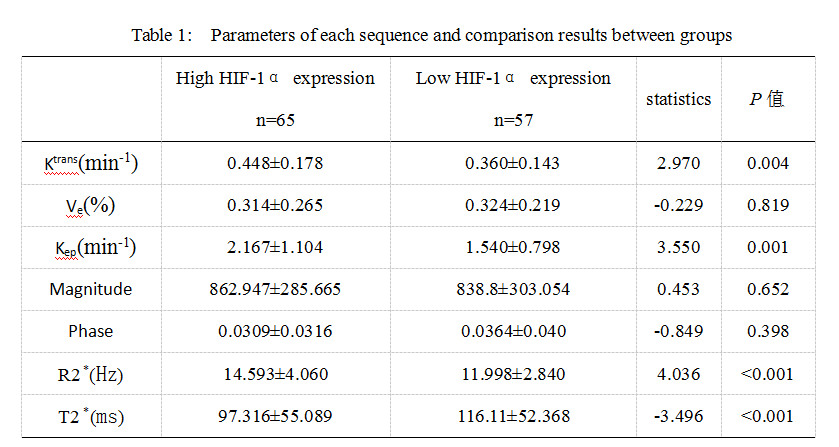
Table 1: Parameters of each sequence and comparison results between groups
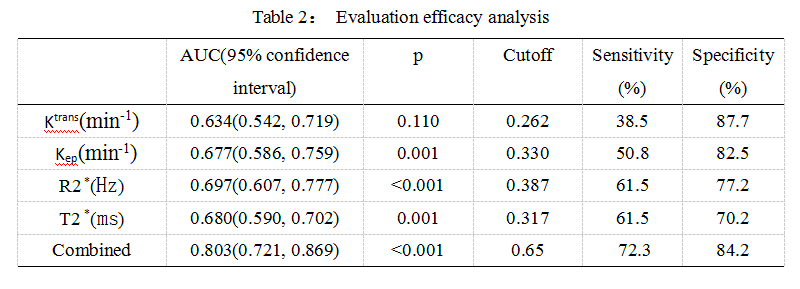
Table 2: Evaluation efficacy analysis
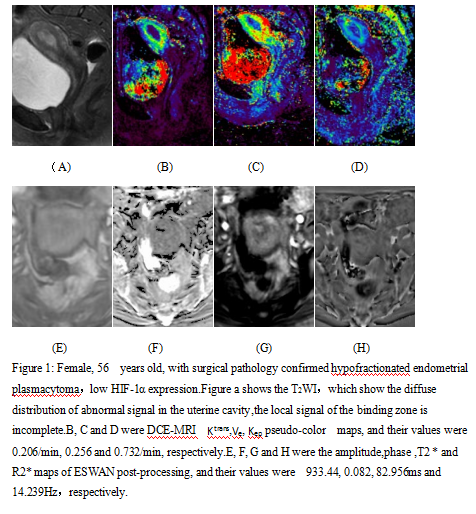
Figure 1: Female, 56 years old, with surgical pathology confirmed hypofractionated endometrial plasmacytoma,low HIF-1α expression.
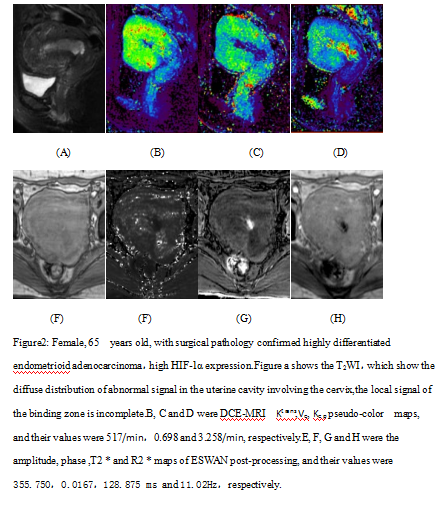
Figure2: Female, 65 years old, with surgical pathology confirmed highly differentiated endometrioid adenocarcinoma,high HIF-1α expression.
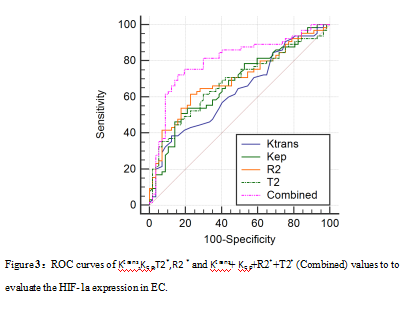
Figure 3:ROC curves of Ktrans,Kep,T2*,R2 * and Ktrans+ Kep+R2*+T2* (Combined) values to to evaluate the HIF-1a expression in EC.
DOI: https://doi.org/10.58530/2023/3257