3255
Quantitative MRI of DCE andIVIM for differentiating low-risk from non-low-risk early-stage endometrial carcinoma1Department of MR, the First Affiliated Hospital, Xinxiang Medical University, Weihui, China, 2Department of Neurology, the First Affiliated Hospital, Xinxiang Medical University, Weihui, China, 3MR Research China, GE Healthcare, Beijing, China
Synopsis
Keywords: Pelvis, Cancer
Finding a noninvasive and effective means for the risk stratification of early-stage EC is of great benefit to patients. This study aim to investigate the value of dynamic contrast-enhanced MRI (DCE-MRI) and intravoxel incoherent motion (IVIM) in differentiating low-risk from non-low-risk early-stage endometrial carcinoma (EC). Results showed that both DCE-MRI and IVIM facilitate the preoperative identification of low-risk and non-low-risk early-stage EC. Compared with each single parameter, the combination of Ktrans, Ve, and f provided better predictive power and may serve as a superior imaging marker.Background
Approximately 80% of newly diagnosed endometrial carcinoma (EC) patients are in the early stage (stage IA, IB), which can be classified into low, intermediate, high-intermediate, and high risk levels based on the histologic subtype, grade, International Federation of Gynecology and Obstetrics (FIGO) stage, and lymphovascular space invasion (LVSI) [1, 2]. To investigate the value of dynamic contrast-enhanced MRI (DCE-MRI) and intravoxel incoherent motion (IVIM) in differentiating low-risk from non-low-risk early-stage endometrial carcinoma (EC). Dynamic contrast-enhanced MRI (DCE-MRI) is a promising imaging tool that can quantitatively detect blood supply in biological tissues by analyzing the dynamic distribution of contrast agents through pharmacokinetic models [3, 4]. Intravoxel incoherent motion (IVIM) can also be used to reflect blood perfusion, and compared to DCE-MRI, it not only eliminates the need for contrast agents but also provides additional information on the diffusion of water molecules within the lesion [5, 6] . Recently, some authors have used IVIM and DCE-MRI for EC-related studies. However,they either used IVIM or DCE-MRI alone or the subjects did not have early-stage EC. The purpose of this study was to build a combination model based on quantitative parameters of DCE-MRI and IVIM to differentiate low-risk from non-low-risk early-stage EC, evaluate the diagnostic efficacy, verify its reliability, and analysis correlation of the relevant derived parameters, and in order to provide a potential reference for the clinical management of early-stage EC.Methods
A total of 74 patients (44 low-risk and 30 non-low-risk) underwent pelvic MRI. A 1.5 T MR system (Optima MR360, GE Healthcare, Waukesha, WI, USA) with a 12-channel phased-array body coil was used in this study. Parameters Ktrans, Kep, Ve, D, D*, and f were compared. The optimal model was investigated by logistic regression, visualized by nomogram, and evaluated by bootstrap (1000 samples), receiver operating characteristic (ROC) curves, calibration curves, and decision curve analysis (DCA). Pearson correlation was used to describe the correlation between different parameters.Results
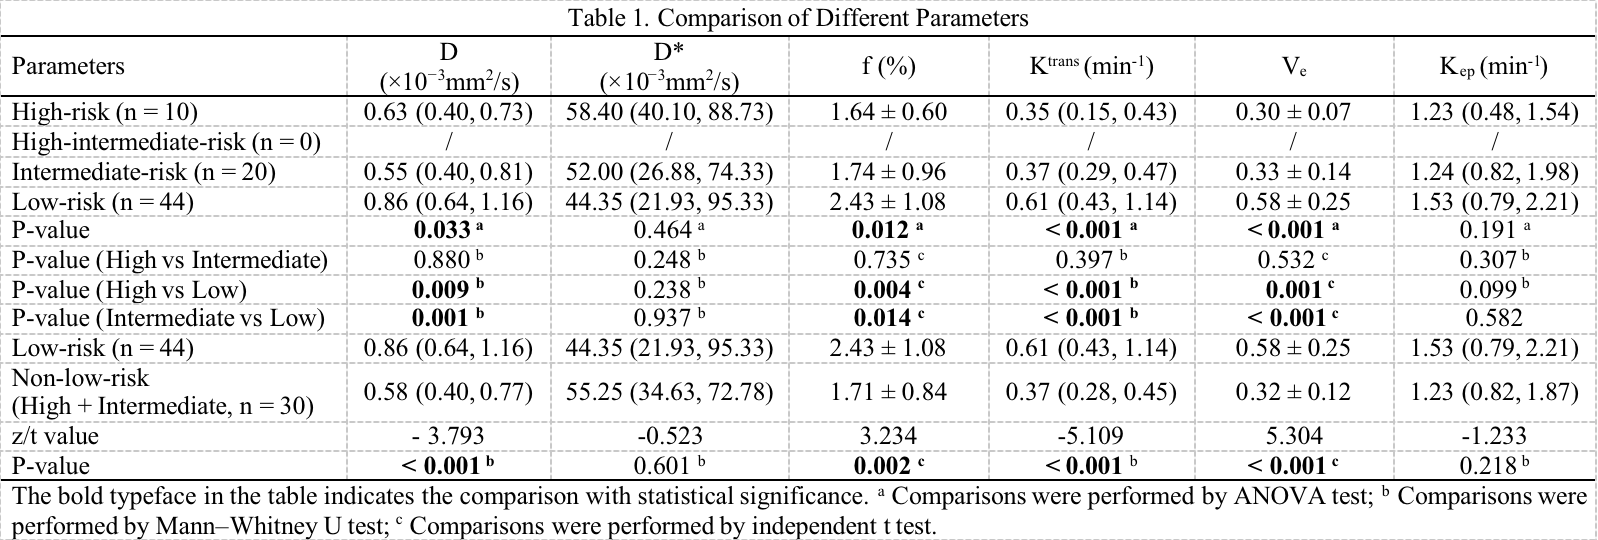
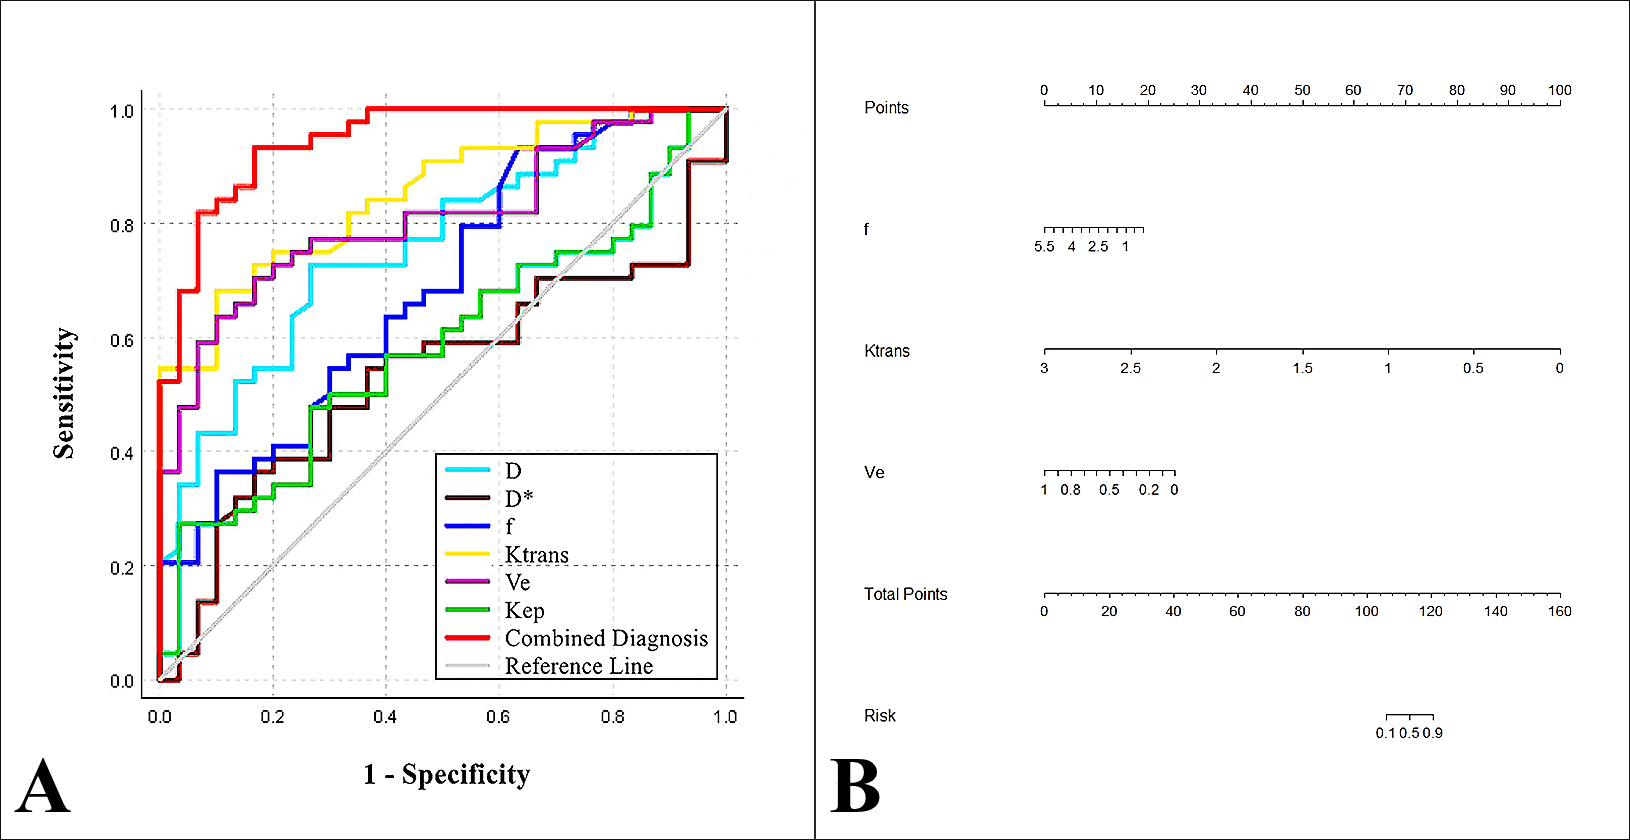
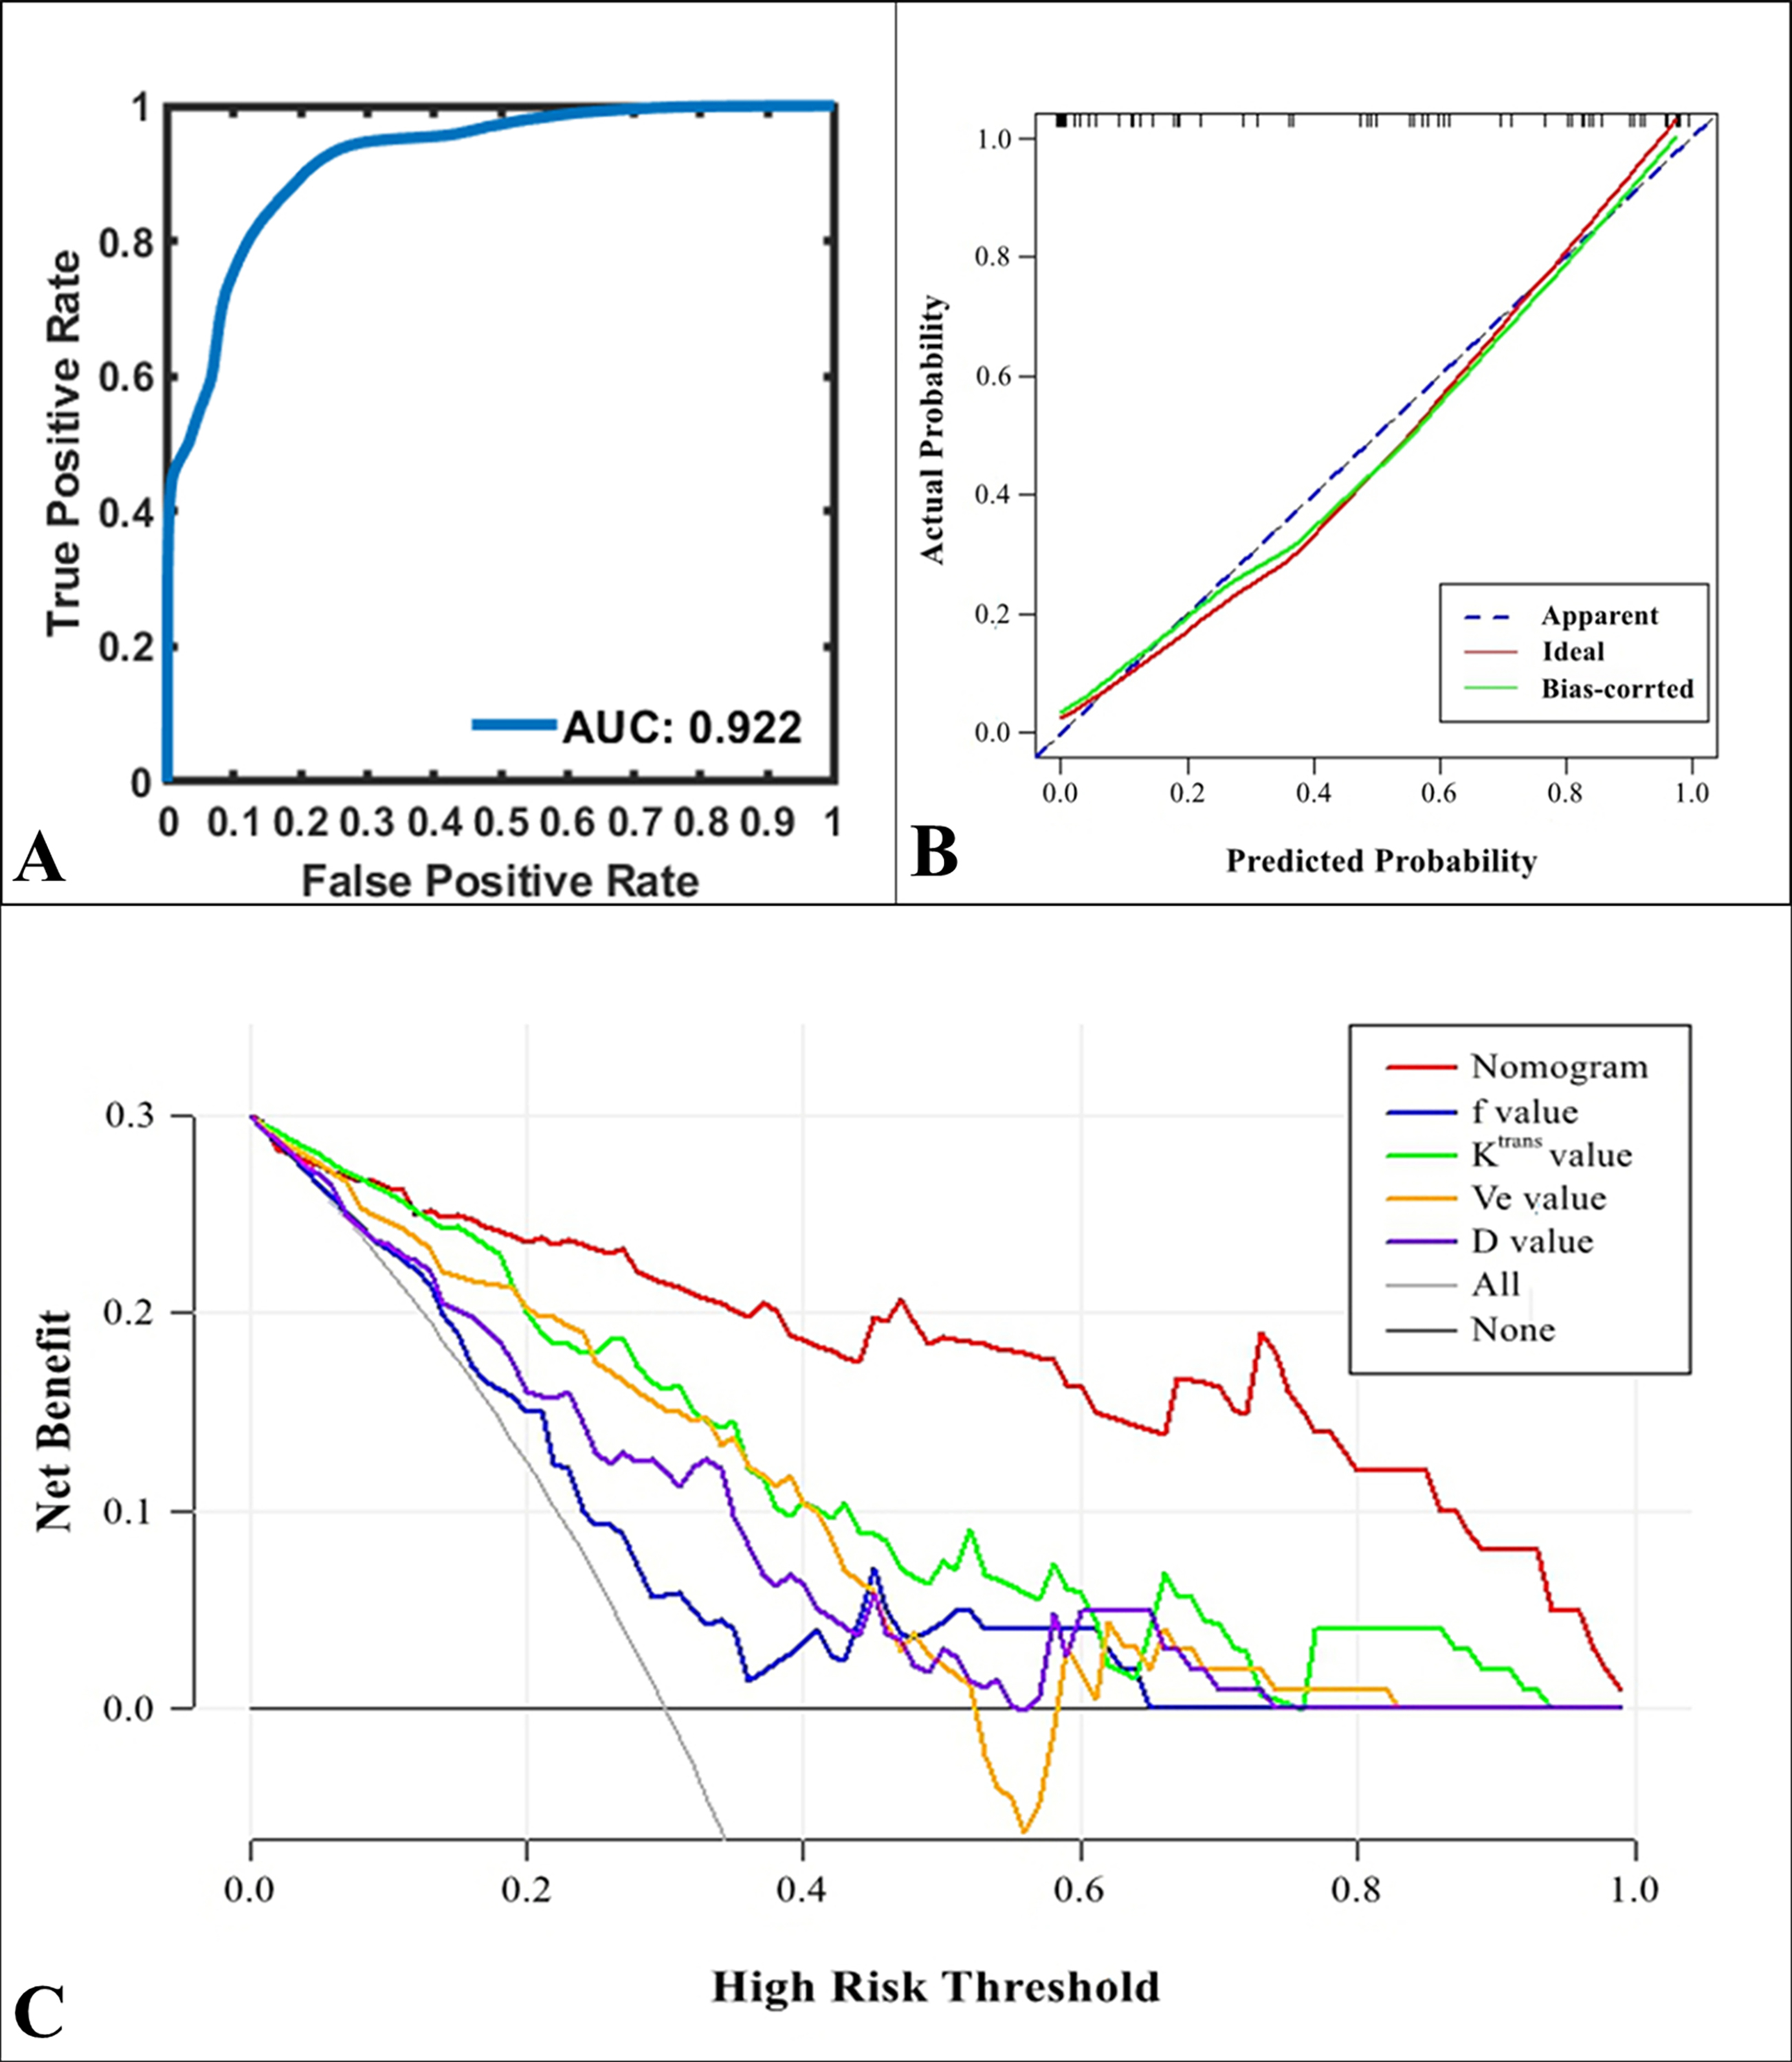
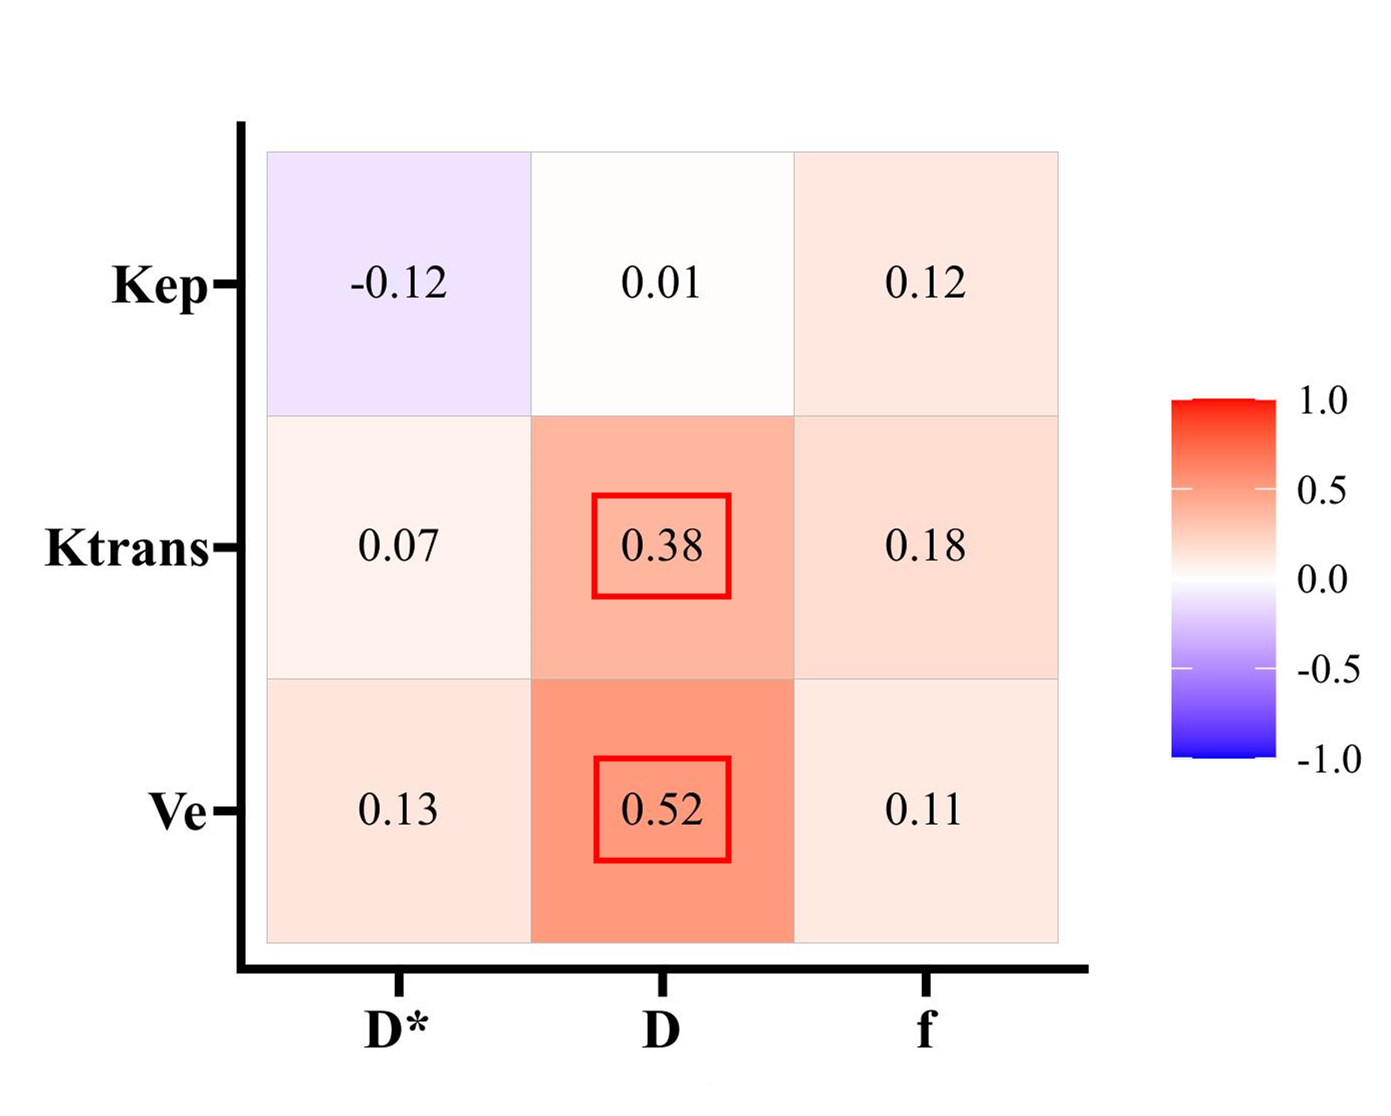
The Ktrans, Ve, f, and D were lower in the non-low-risk group than in the low-risk group (all P < 0.05)(Table 1). There was no statistical significance in Kep and D* between the two groups (P = 0.218, 0.601). Ktrans, Ve, and f were independent predictors for risk stratification, and the model combined by them had an optimal diagnostic efficacy (AUC, 0.947; sensitivity, 83.33 %; specificity, 93.18 %), which was significantly better than D (AUC = 0.761, Z = 3.113, P = 0.002), f (AUC = 0.688 , Z = 4.317, P < 0.001), Ktrans (AUC = 0.852 , Z = 2.713, P = 0.007), and Ve (AUC = 0.808, Z = 3.175, P = 0.002) (Figure 1). The DCA showed that the combined model was the most reliable clinical treatment tool when the threshold probability was greater than 10% (Figure 2). The validation model showed good accuracy and consistency (AUC, 0.922; 95% CI, 0.895 - 0.940). D was mildly and moderately positively with Ktrans and Ve, respectively (r = 0.382, 0.524) (Figure 3).Conclusions
Both DCE-MRI and IVIM facilitate preoperative identification of low-risk and non-low-risk early-stage EC. Compare with each single parameter, the model combined by independent predictors (Ktrans, Ve, and f ) provided better predictive power and may serve as a superior imaging marker.Acknowledgements
This work was supported by the Roentgen Imaging Research Project (HN-20201017-002), and the Key Project of Henan Province Medical Science and Technology Project (LHGJ20200519).References
1. Miller KD, Ortiz AP, Pinheiro PS, Bandi P, Minihan A, Fuchs HE, et al. Cancer statistics for the US Hispanic/Latino population, 2021. CA Cancer J Clin. (2021) 71:466-87. doi: 10.3322/caac.21695.
2. Colombo N, Creutzberg C, Amant F, Bosse T, González-Martín A, Ledermann J, et al. ESMO-ESGO-ESTRO Consensus Conference on Endometrial Cancer: diagnosis, treatment and follow-up. Ann Oncol. (2016) 27:16-41. doi: 10.1093/annonc/mdv484.
3. Khalifa F, Soliman A, El-Baz A, Abou El-Ghar M, El-Diasty T, Gimel'farb G, et al. Models and methods for analyzing DCE-MRI: a review. Med Phys. (2014) 41:124301. doi: 10.1118/1.4898202.
4. Ye Z, Ning G, Li X, Koh TS, Chen H, Bai W, et al. Endometrial carcinoma: use of tracer kinetic modeling of dynamic contrast-enhanced MRI for preoperative risk assessment. Cancer Imaging. (2022) 22:14. doi: 10.1186/s40644-022-00452-8.
5. Le Bihan D, Breton E, Lallemand D, Aubin ML, Vignaud J, Laval-Jeantet M. Separation of diffusion and perfusion in intravoxel incoherent motion MR imaging. Radiology. (1988) 168:497-505. doi: 10.1148/radiology.168.2.3393671.
6. Bai Y, Lin Y, Tian J, Shi D, Cheng J, Haacke EM, et al. Grading of Gliomas by Using Monoexponential, Biexponential, and Stretched Exponential Diffusion-weighted MR Imaging and Diffusion Kurtosis MR Imaging. Radiology. (2016) 278:496-504. doi: 10.1148/radiol.2015142173.
Figures