3252
Automated Quality Assessment of Liver Magnetic Resonance Images with Fully Automatic Segmentation and Radiomics Approach
Hai Nan Ren1, Li Jun Qian1, Xu Hua Gong1, Yan Zhou1, and Yang Song2
1Radiology, Renji Hospital, Shanghai Jiao Tong University, School of Medicine, Shanghai, China, 2MR Scientific Marketing, Siemens Healthineers Ltd., Shanghai, China
1Radiology, Renji Hospital, Shanghai Jiao Tong University, School of Medicine, Shanghai, China, 2MR Scientific Marketing, Siemens Healthineers Ltd., Shanghai, China
Synopsis
Keywords: Machine Learning/Artificial Intelligence, Machine Learning/Artificial Intelligence, Quality control
This study investigated the feasibility and performance of quality assessment of hepatic magnetic resonance (MR) images using a deep-learning-based segmentation and radiomics approach. We used a pre-trained deep learning model to segment the liver on different contrast-enhanced MR phases and then extracted quantitative features to assess the image quality by a machine learning method. The results showed that the radiomics model had a high performance for image quality identification in both training and test sets. This suggests that it was feasible to automate the identification of image quality by using radiomics approaches.Purpose
Multiphase contrast-enhanced hepatic MR imaging is essential in the diagnosis of diffuse or focal liver diseases, and high-quality images are crucial to establishing diagnostic confidence. Nowadays, image quality assessment is still driven by the visual assessment of radiologists, which can be laborious, subjective, and time-consuming. Since there are more and more sequences that could be scanned in the clinical scenario, an automatic approach to assess the abdominal MR image quality is necessary and helpful for the radiologist. Traditionally, signal-to-noise (SNR), contrast-to-noise (CNR), or other quantitative metrics were used to assess image quality. These metrics, however, cannot adjust to the artifacts caused by motion or breathing. In this study, we develop a fully automatic approach to assess the abdominal MR images including liver segmentation by deep learning and radiomics assessment on feature extraction and model development.Methods
This study was approved by the institutional review board with informed consent waived. The flow chart of the study design is shown in Fig. 1.An independent coordinator searched the radiology reporting system for consecutive contrast-enhanced hepatic MR studies, which were required to consist of at least four (i.e., arterial, portal venous, and equilibrium) phases. To include a sufficient number of suboptimal quality images, we additionally searched with quality control tags. Cases with gadoxetic acid-enhanced study, prior hepatic surgery, implant, and automatic segmentation failure were excluded. Finally, 118 cases with a total of 472 sets of data were included.
Two radiologists jointly scored the image quality of each phase of each enrolled case on an A-D scale, with A representing good and D representing poor quality (Fig. 2). We treated the image with quality A/B as satisfactory, and C/D as unsatisfactory.
We randomly split 118 cases into a training set (81 cases, unsatisfactory/satisfactory = 70/254) and an independent testing set (37 cases, unsatisfactory/satisfactory = 37/111). We segmented the liver in all phases using a pre-trained open-source 3D full-resolution segmentation nnUnet model (https://zenodo.org/record/4003545).
For feature extraction, we first resampled all images with the intra-slice resolution to 0.78 mm x 0.78 mm according to the training set data distribution and with the slice thickness unchanged. We used a 3-sigma rule to re-segment the image for followed feature extraction. Then we implemented Z-score normalization on each image. Finally, we extract 17 histogram features and 85 texture features. All above were implemented by PyRadiomics under the rule of the Image Biomarker Standardisation Initiative(1).
On feature analysis, we first used Z-score to remove the bias of the feature scale. Then we used Pearson's coherence coefficient with a threshold of 0.9 to remove the co-linear feature. Features were then sorted according to the Kruskal Wallis F-value and linear discriminant analysis (LDA) was chosen as the classifier. Five-fold cross-validation was performed to determine the number of features on the training data set. Then we built the final model using the whole training cohort and evaluated it on the test data set. All above were implemented with FeAture Explorer (V 0.5.3)(2). The Coefficient of Variable (CV) and Peak Signal-to-Noise Ratio (PSNR) were also computed for each image. We compared the model assessment performance of PSNR, CV, best single extracted feature, and the final model.
Chi-square tests were used for comparing image quality distribution between datasets and between dynamic phases. Receiver operating characteristic (ROC) with the area under the curve (AUC) was used to evaluate the model performance. Delong-test was used to compare the model. P < 0.05 was selected as statistically significant.
Results
There was no significant difference in the distribution of image quality between the training and test sets (P=0.448), nor between dynamic phases (P=0.713). (Fig. 3). In the final model, we used four features, including gldm_DependenceVariance, glrlm_RunLengthNonUniformityNormalized, glrlm_ShortRunEmphasis, glszm_ZoneEntropy, to build the model achieving the highest AUC on both the training (AUC=0.82) and test sets (0.84). The AUC of the radiomics model is significantly higher than that of PSNR (0.62), CV (0.63), and best-individual feature (0.73) in the test data set (Fig. 4). The ROC curves of the radiomics model in the training and test sets are shown in Fig. 5.Discussion
Our study proposed an automatic segmentation plus radiomics "relay" approach for quality assessment, which demonstrated good accuracy in both training and test sets. As compared with the documented full CNN model(3), our method gives superior interpretability, i.e., artifacts, inhomogeneity, sharpness, and noise that affect image quality can be revealed by texture features that represent voxels' relationships. The final features selected in our model are all texture features. This confirms that texture features are more effective than histograms at reflecting the distribution of regularly occurring artifacts, such as motion and breathing. The limitation of this study is that only the multiphase images were assessed since they cannot be repeatedly rescanned like unenhanced images.Conclusion
This study demonstrated that deep learning-based liver segmentation and radiomics approach appears to be feasible and has good accuracy in assessing the image quality of axial contrast-enhanced hepatic MR imaging.Acknowledgements
No acknowledgement found.References
- Zwanenburg A, et al. The Image Biomarker Standardization Initiative: Standardized Quantitative Radiomics for High-Throughput Image-based Phenotyping. Radiology. 2020 May;295(2):328–38.
- Song Y, Zhang J, Zhang Y dong, Hou Y, Yan X, Wang Y, et al. FeAture Explorer (FAE): A tool for developing and comparing radiomics models. Dimitriadis SI, editor. PLoS ONE. 2020 Aug 17;15(8):e0237587.
- Esses SJ, Lu X, Zhao T, Shanbhogue K, Dane B, Bruno M, et al. Automated image quality evaluation of T 2 -weighted liver MRI utilizing deep learning architecture: Automated Image Quality Evaluation. J Magn Reson Imaging. 2018 Mar;47(3):723–8.
Figures
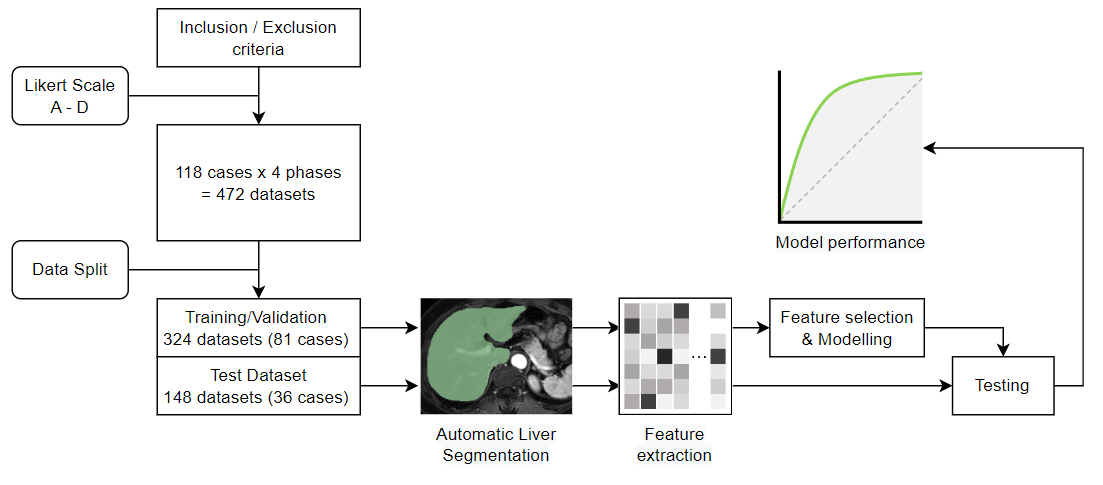
Fig.1 Flow chart of the study.
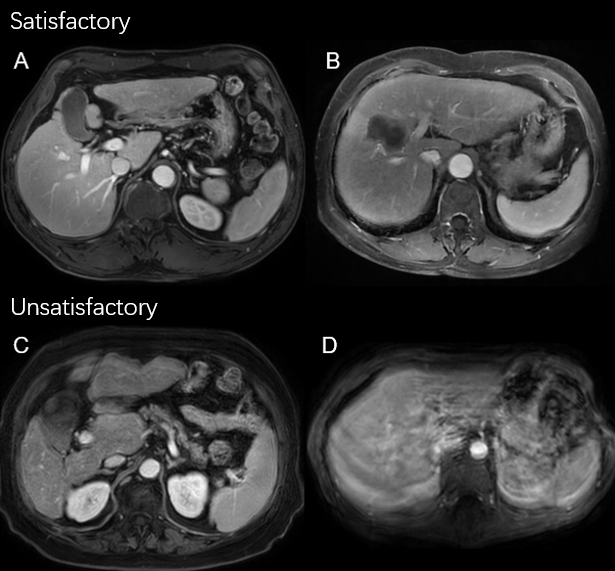
Fig.2 Example
of binarized image quality scores. A = excellent, B = good, C = unsatisfactory,
and D = poor image qualities, respectively.
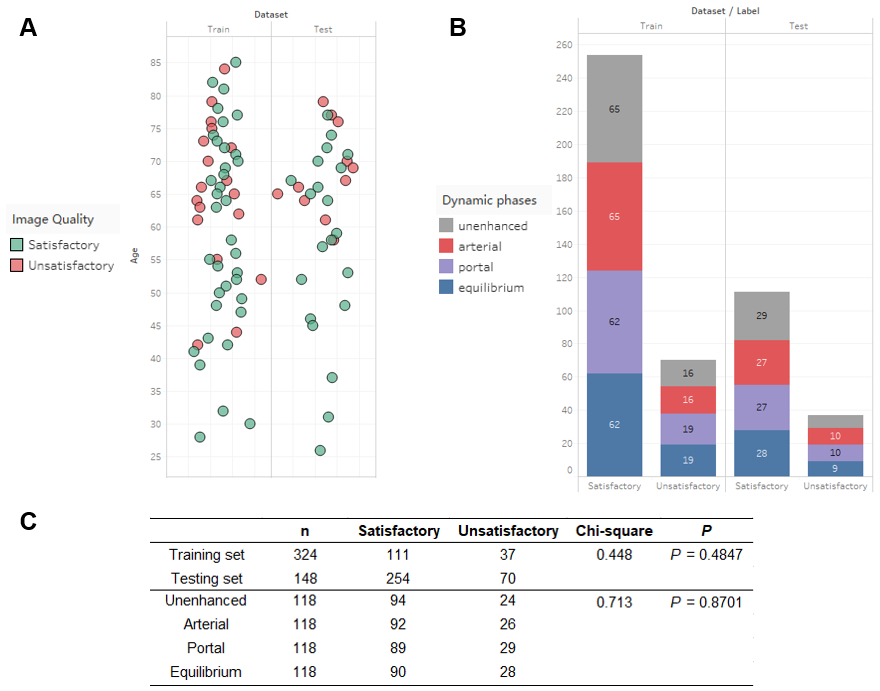
Fig.3 Image quality
distribution. (A) Jitter plot of image quality relative to patient’s age in the
training and test sets. (B) Stacked bar chart of image quality relative to dynamic
phases in the training and test sets. (C) Chi-square test of quality
distribution between datasets and dynamic phases.
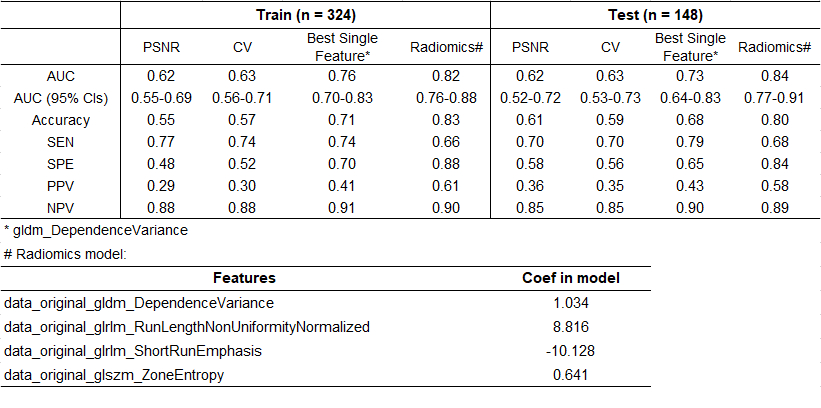
Fig.4 The
performance of PSNR, CV, best-individual feature, and radiomics model.
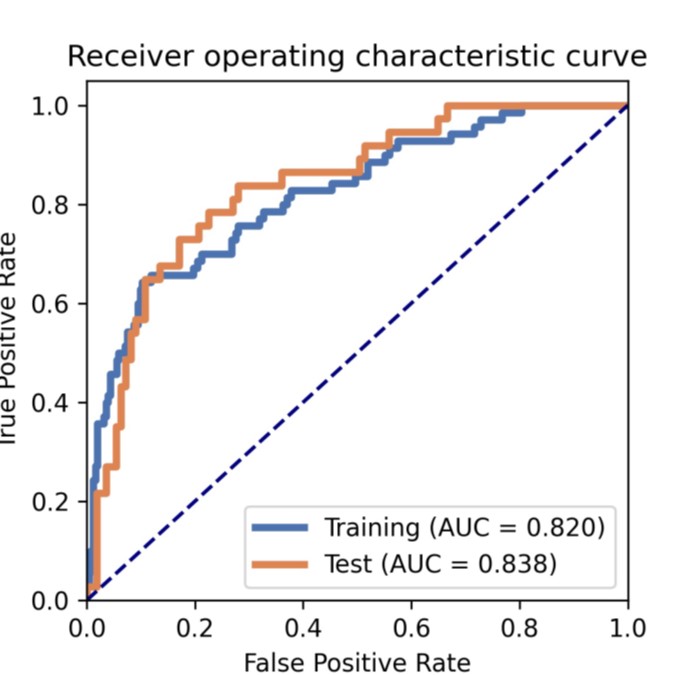
Fig.5 ROC
curves of the radiomics model in the training and testing sets.
DOI: https://doi.org/10.58530/2023/3252