3249
Improved Image Quality with Deep Learning-Based Image Reconstruction for Multi-shot Diffusion-Weighted Imaging of the Prostate
Patricia S. Lan1, Xinzeng Wang2, Alessandro Scotti3, Praveen Jayapal4, Pingni Wang1, Arnaud Guidon5, and Andreas M. Loening4
1GE Healthcare, Menlo Park, CA, United States, 2GE Healthcare, Houston, TX, United States, 3GE Healthcare, Columbus, OH, United States, 4Department of Radiology, Stanford University, Stanford, CA, United States, 5GE Healthcare, Boston, MA, United States
1GE Healthcare, Menlo Park, CA, United States, 2GE Healthcare, Houston, TX, United States, 3GE Healthcare, Columbus, OH, United States, 4Department of Radiology, Stanford University, Stanford, CA, United States, 5GE Healthcare, Boston, MA, United States
Synopsis
Keywords: Diffusion/other diffusion imaging techniques, Diffusion/other diffusion imaging techniques
Diffusion-weighted imaging (DWI) is a key component of identifying prostate tumors on MRI. Multi-shot DWI techniques (e.g. MUSE) have been shown to enable high resolution prostate DWI and, compared to single-shot DWI, reduce distortion artifacts due to rectal gas and hip implants at the expense of increased scan time. In this study, we evaluated a CNN-based deep learning (DL) image reconstruction method for MUSE. Our results indicate that for high b-value images the DL-based reconstruction improved perceived image quality even with half the original NEX, suggesting potential scan time reduction using DL.Introduction
Due to its sensitivity and specificity in identifying prostate tumors, diffusion-weighted imaging (DWI) is a critical sequence for prostate MRI and is the most important sequence in the PI-RADS guidelines for grading prostate tumors. An accurate assessment of lesion suspicion and position on diffusion images is critical in the recommendation for biopsy planning and surgery. However, DWI in the prostate is prone to susceptibility artifacts due to rectal gas and hip prostheses, especially in the peripheral zone, where 70-75% of prostate cancers arise.1 Multi-shot Diffusion-Weighted MRI With Multiplexed Sensitivity Encoding (MUSE) has been shown to enable high resolution DWI over a large FOV with reduced geometric distortion at the cost of increased scan time.2 The use of deep learning (DL) based image reconstruction strategies presents an opportunity for improving MUSE by increasing SNR efficiency and reducing scan time.3 The purpose of this study was to evaluate the image quality improvement with DL-based image reconstruction for MUSE in the prostate.Methods
This retrospective study included 17 male subjects with known or suspected prostate cancer who had undergone clinical prostate 3T MRI (SIGNA Premier, GE Healthcare, Waukesha, WI) that incorporated a commercial MUSE sequence. The study was performed with IRB approval and waiver of informed consent due to its retrospective nature. MUSE imaging parameters were: 23 slices, 4.2mm slice thickness, 3 shots, TETRA encoding, 26cm FOV, 168x168 matrix size, TE=62ms, TR=3000ms, b-values=50(NEX=1),1200(NEX=4), ASSET 2x. Image reconstruction was performed offline using a CNN based deep-learning network trained with over 10,000 images as previously described,3 with (1) all NEX MUSE data and (2) ½ NEX MUSE data (by retrospectively averaging only the first half of the total NEX for the b1200 images).To qualitatively assess the impact of DL-based reconstruction on MUSE image quality, we conducted an observer study performed by two radiologists (13 and 5 years experience) blinded to the reconstruction method. Scoring was conducted on the high b-value (1200s/mm2) diffusion images. Pairwise comparisons for (1) All NEX non-DL vs. ½ NEX DL, (2) All NEX non-DL vs. All NEX DL, and (3) ½ NEX DL vs. All NEX DL were performed for three metrics (1) qualitative SNR, (2) qualitative sharpness, and (3) perceived diagnostic capability. The image scoring system is described in Figure 5.
To perform SNR estimations, 50mm2 circular ROIs were drawn in the left and right peripheral zone and transition zone at the base, mid, and apex slices. Average estimated SNR per subject was calculated as the mean of the 12 signal intensities divided by the standard deviation within an ROI in the obturator muscle. Two subjects were excluded from SNR estimations, due to brachytherapy seeds and prostatectomy.
Results
DL MUSE reconstruction significantly reduced noise (Table 1) in both b50 (Figure 1) and b1200 (Figure 2) images. For b50 images, average SNR is significantly improved by a factor of 1.71 with DL (p=2.2E-5). On average, DL significantly improves SNR of b1200 images by a factor of 1.84 when using All NEX (p=0.001) and 1.58 when using ½ NEX (p=0.006).The benefit of denoising from DL MUSE is extended to synthetic b-value and ADC map calculations, as shown in Figure 3. The syn-b1400 image shows improved contrast due to noise removal, and the ADC map has reduced worm hole artifacts as well as a more homogeneous appearance within the muscle tissue.
Results from reader scores are summarized in Figure 5. In general, ½ NEX DL and All NEX DL reconstructions have (1) significantly better SNR (p=1.5E-5, 1.5E-5, respectively), (2) moderate significantly improved perceived diagnostic capability (p=3.5E-4, 1.5E-5, respectively), and (3) slight significantly increased sharpness (p=2.9E-4, 1.5E-5, respectively), when compared to All NEX non-DL reconstructions. All NEX DL and ½ NEX DL are almost functionally equivalent in terms of the 3 qualitative categories.
Discussion
Qualitative and quantitative assessment indicate DL-based MUSE reconstruction significantly increases SNR even with half the original NEX for high-value images. This study is limited by the small sample size and number of readers. The reader scores were consistent for the qualitative SNR and perceived diagnostic capability categories, but slightly differed for the qualitative sharpness. One reader found almost no difference in sharpness for DL vs non-DL images, whereas the other reader found slight improvement in sharpness with DL applied. Future work may explore extracting corresponding high resolution T2 images as the ground truth to better understand which structures are real and whether DL can enhance the sharpness.Conclusion
In this study, we demonstrated prostate MUSE DWI image quality improvement with a DL-based image reconstruction method. The DL-based reconstruction significantly increased SNR and moderately improved perceived diagnostic capability even with half the original NEX for high b-value images, strongly suggesting potential scan time reduction by a factor of 2 can be obtained for multi-shot DWI with DL.Acknowledgements
No acknowledgement found.References
1. Steiger, P., Thoeny, H.C. Prostate MRI based on PI-RADS version 2: how we review and report. Cancer Imaging 16, 9 (2016). https://doi.org/10.1186/s40644-016-0068-2
2. Chen NK, Guidon A, Chang HC, Song AW. A robust multi-shot scan strategy for high-resolution diffusion weighted MRI enabled by multiplexed sensitivity-encoding (MUSE). Neuroimage. 2013;72:41-7.
3. Lebel RM. Performance characterization of a novel deep learning-based MR image reconstruction pipeline. arXiv preprint arXiv:2008.06559. 2020.
Figures
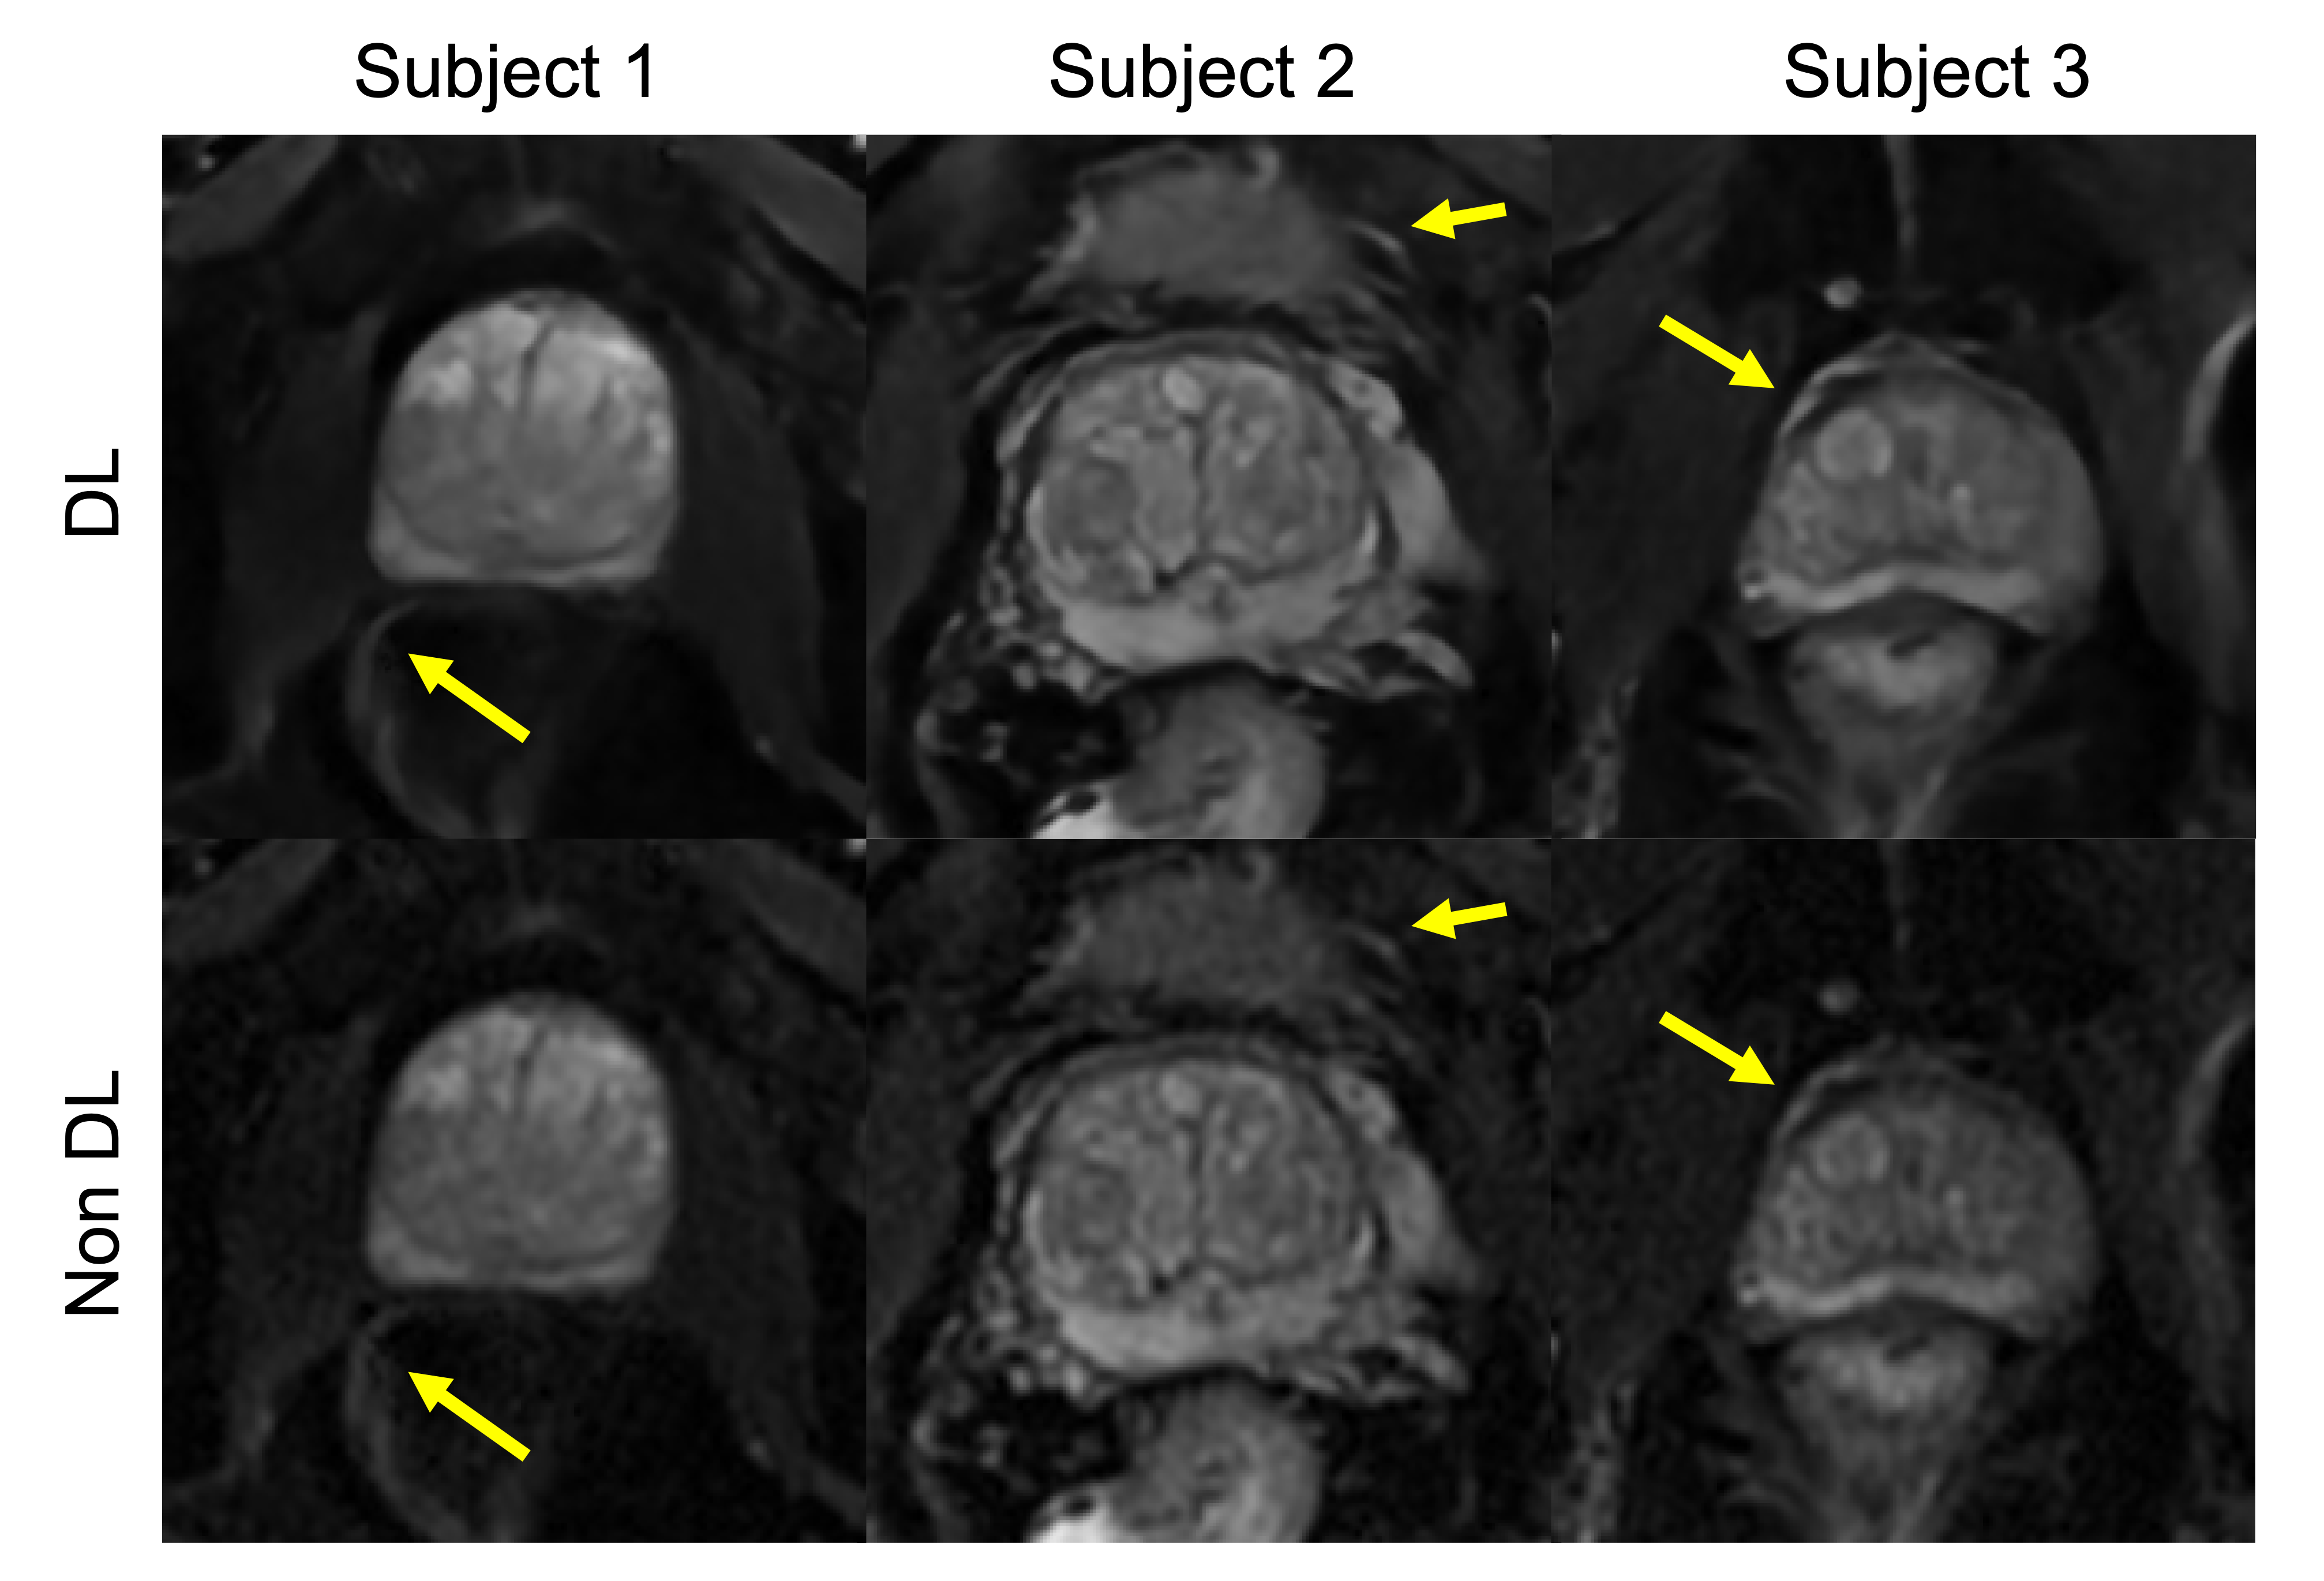
Figure 1. MUSE images of the prostate with b=50s/mm2 in 3 subjects with (top row) and without (bottom row) DL. Perceived SNR is improved with DL and yellow arrows indicate regions where DL increases sharpness.
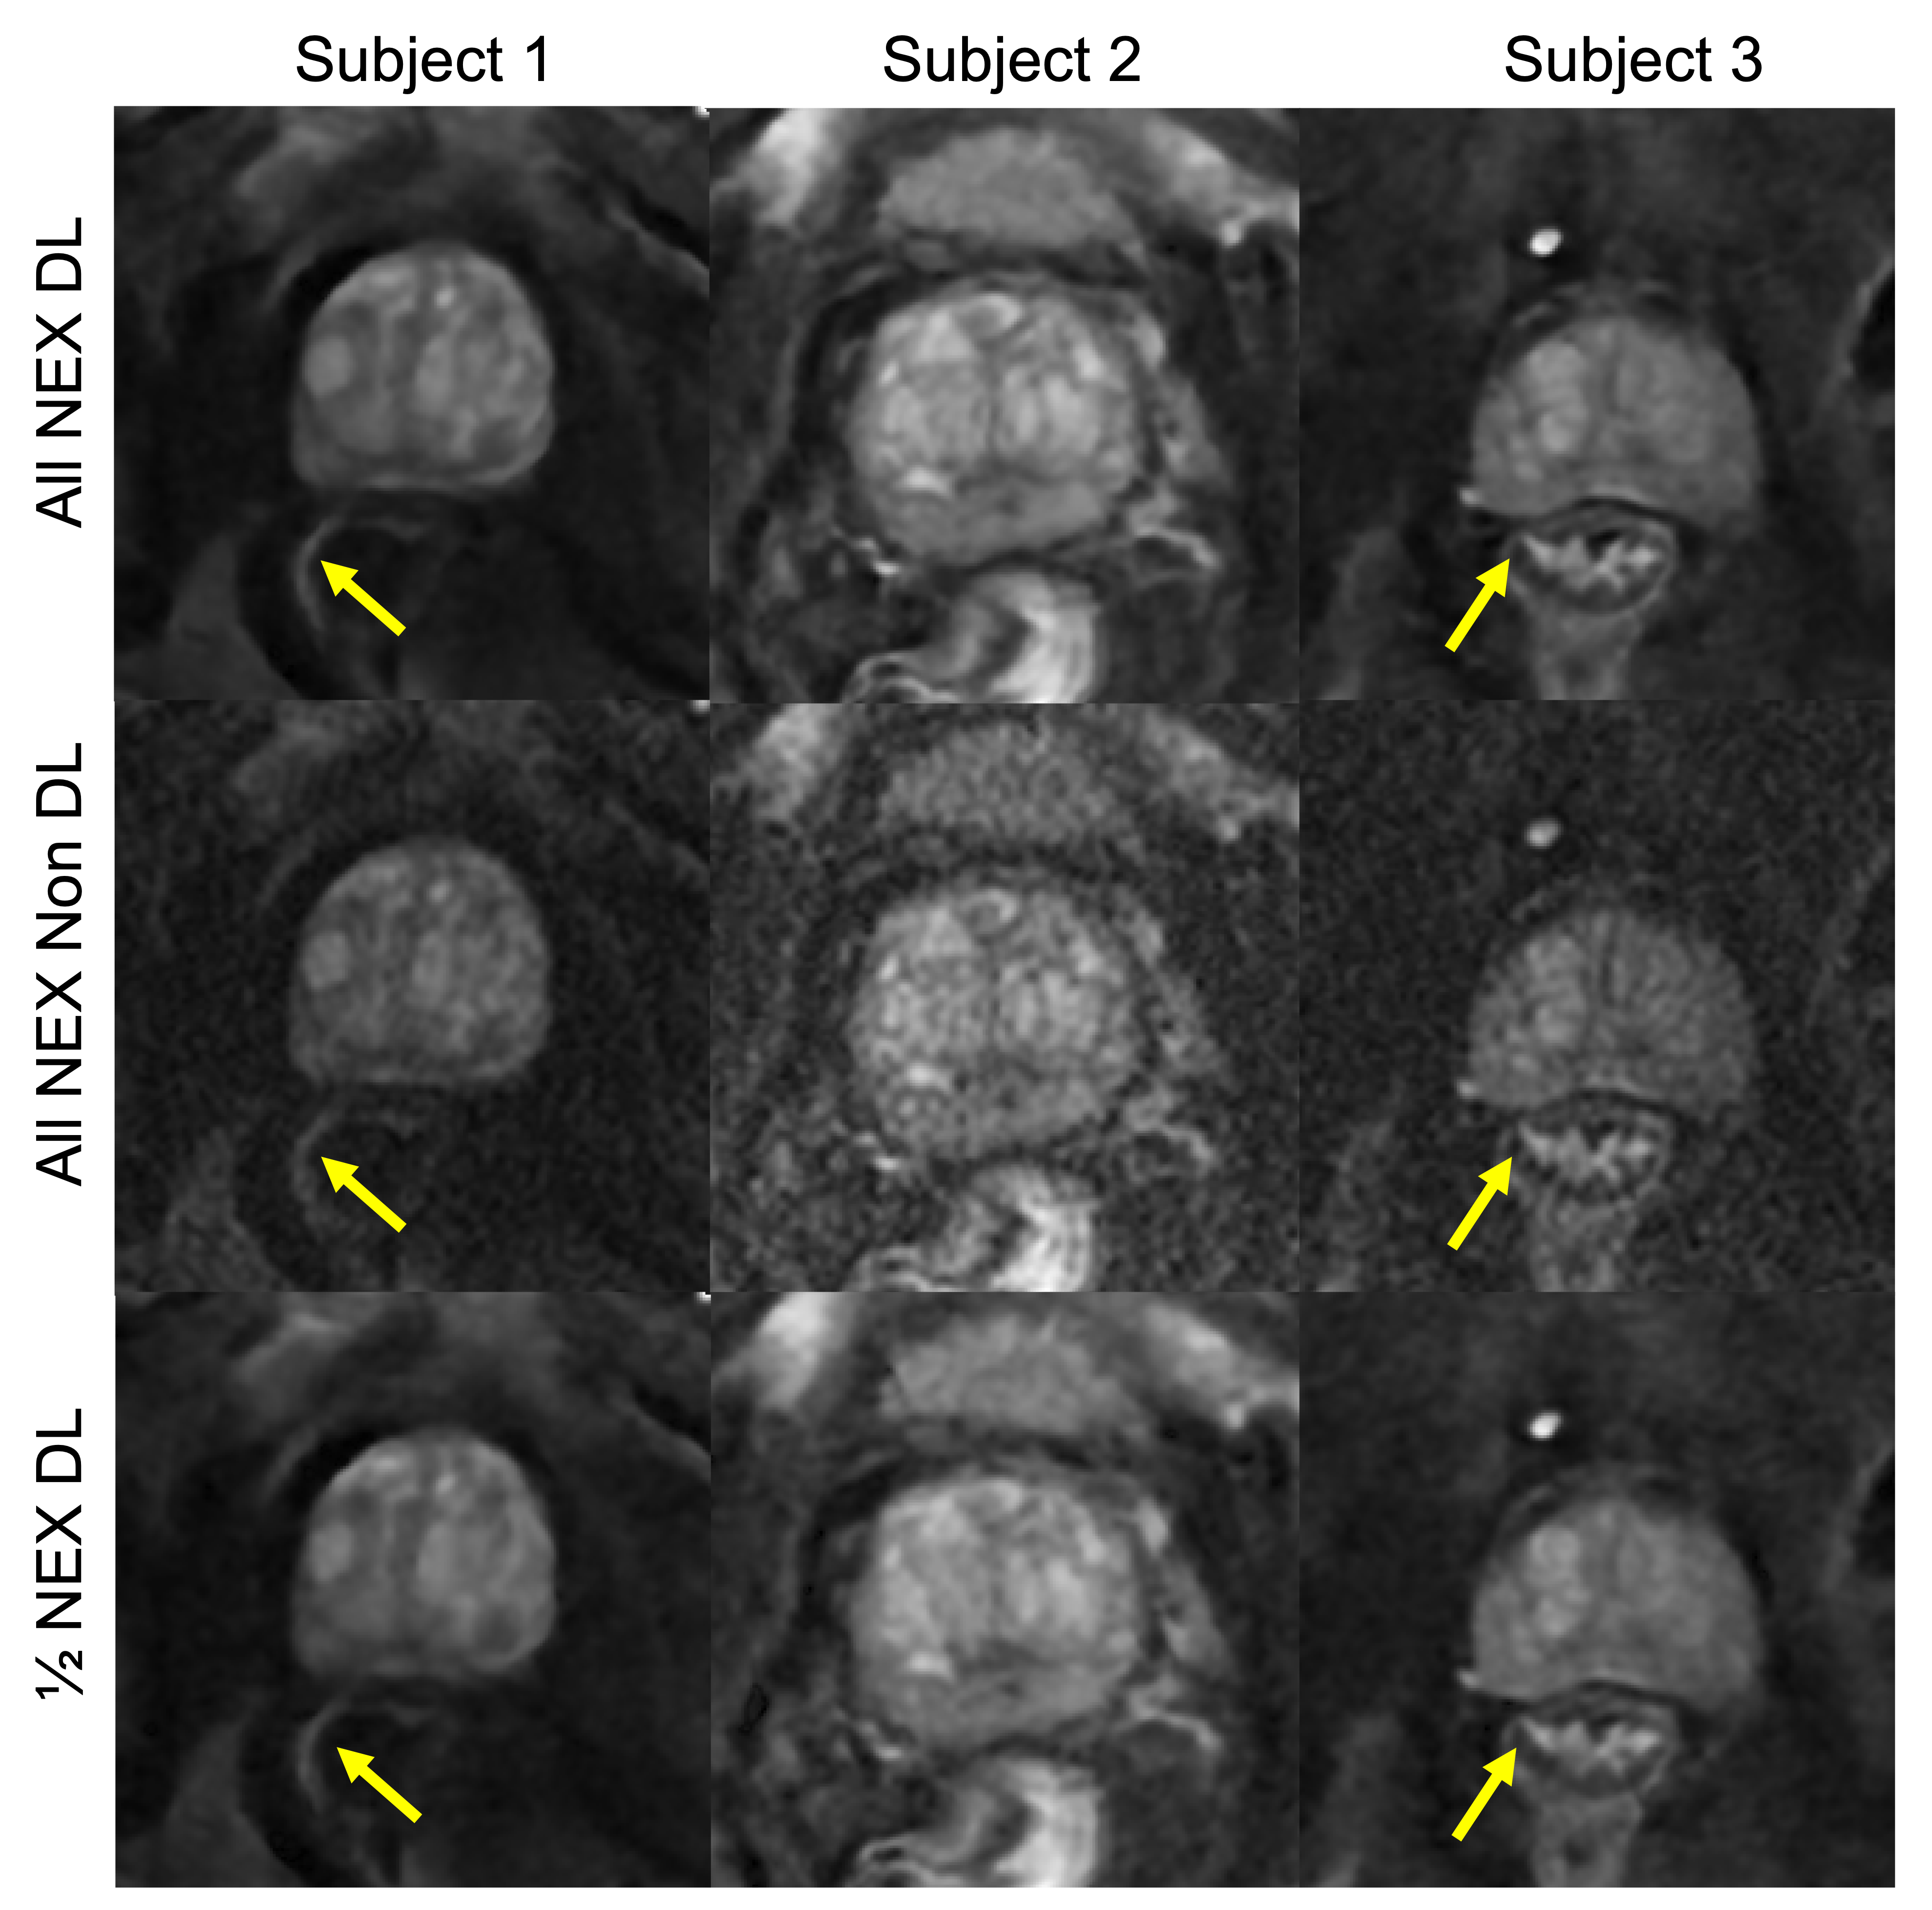
Figure 2. MUSE images of the prostate with b=1200s/mm2 in 3 subjects with (1) all NEX DL (top row) (2) no DL (middle row) and (3) ½ NEX DL (bottom row). SNR is improved with DL for both All NEX and ½ NEX cases when compared with non DL. Yellow arrows indicate regions where DL increases sharpness.
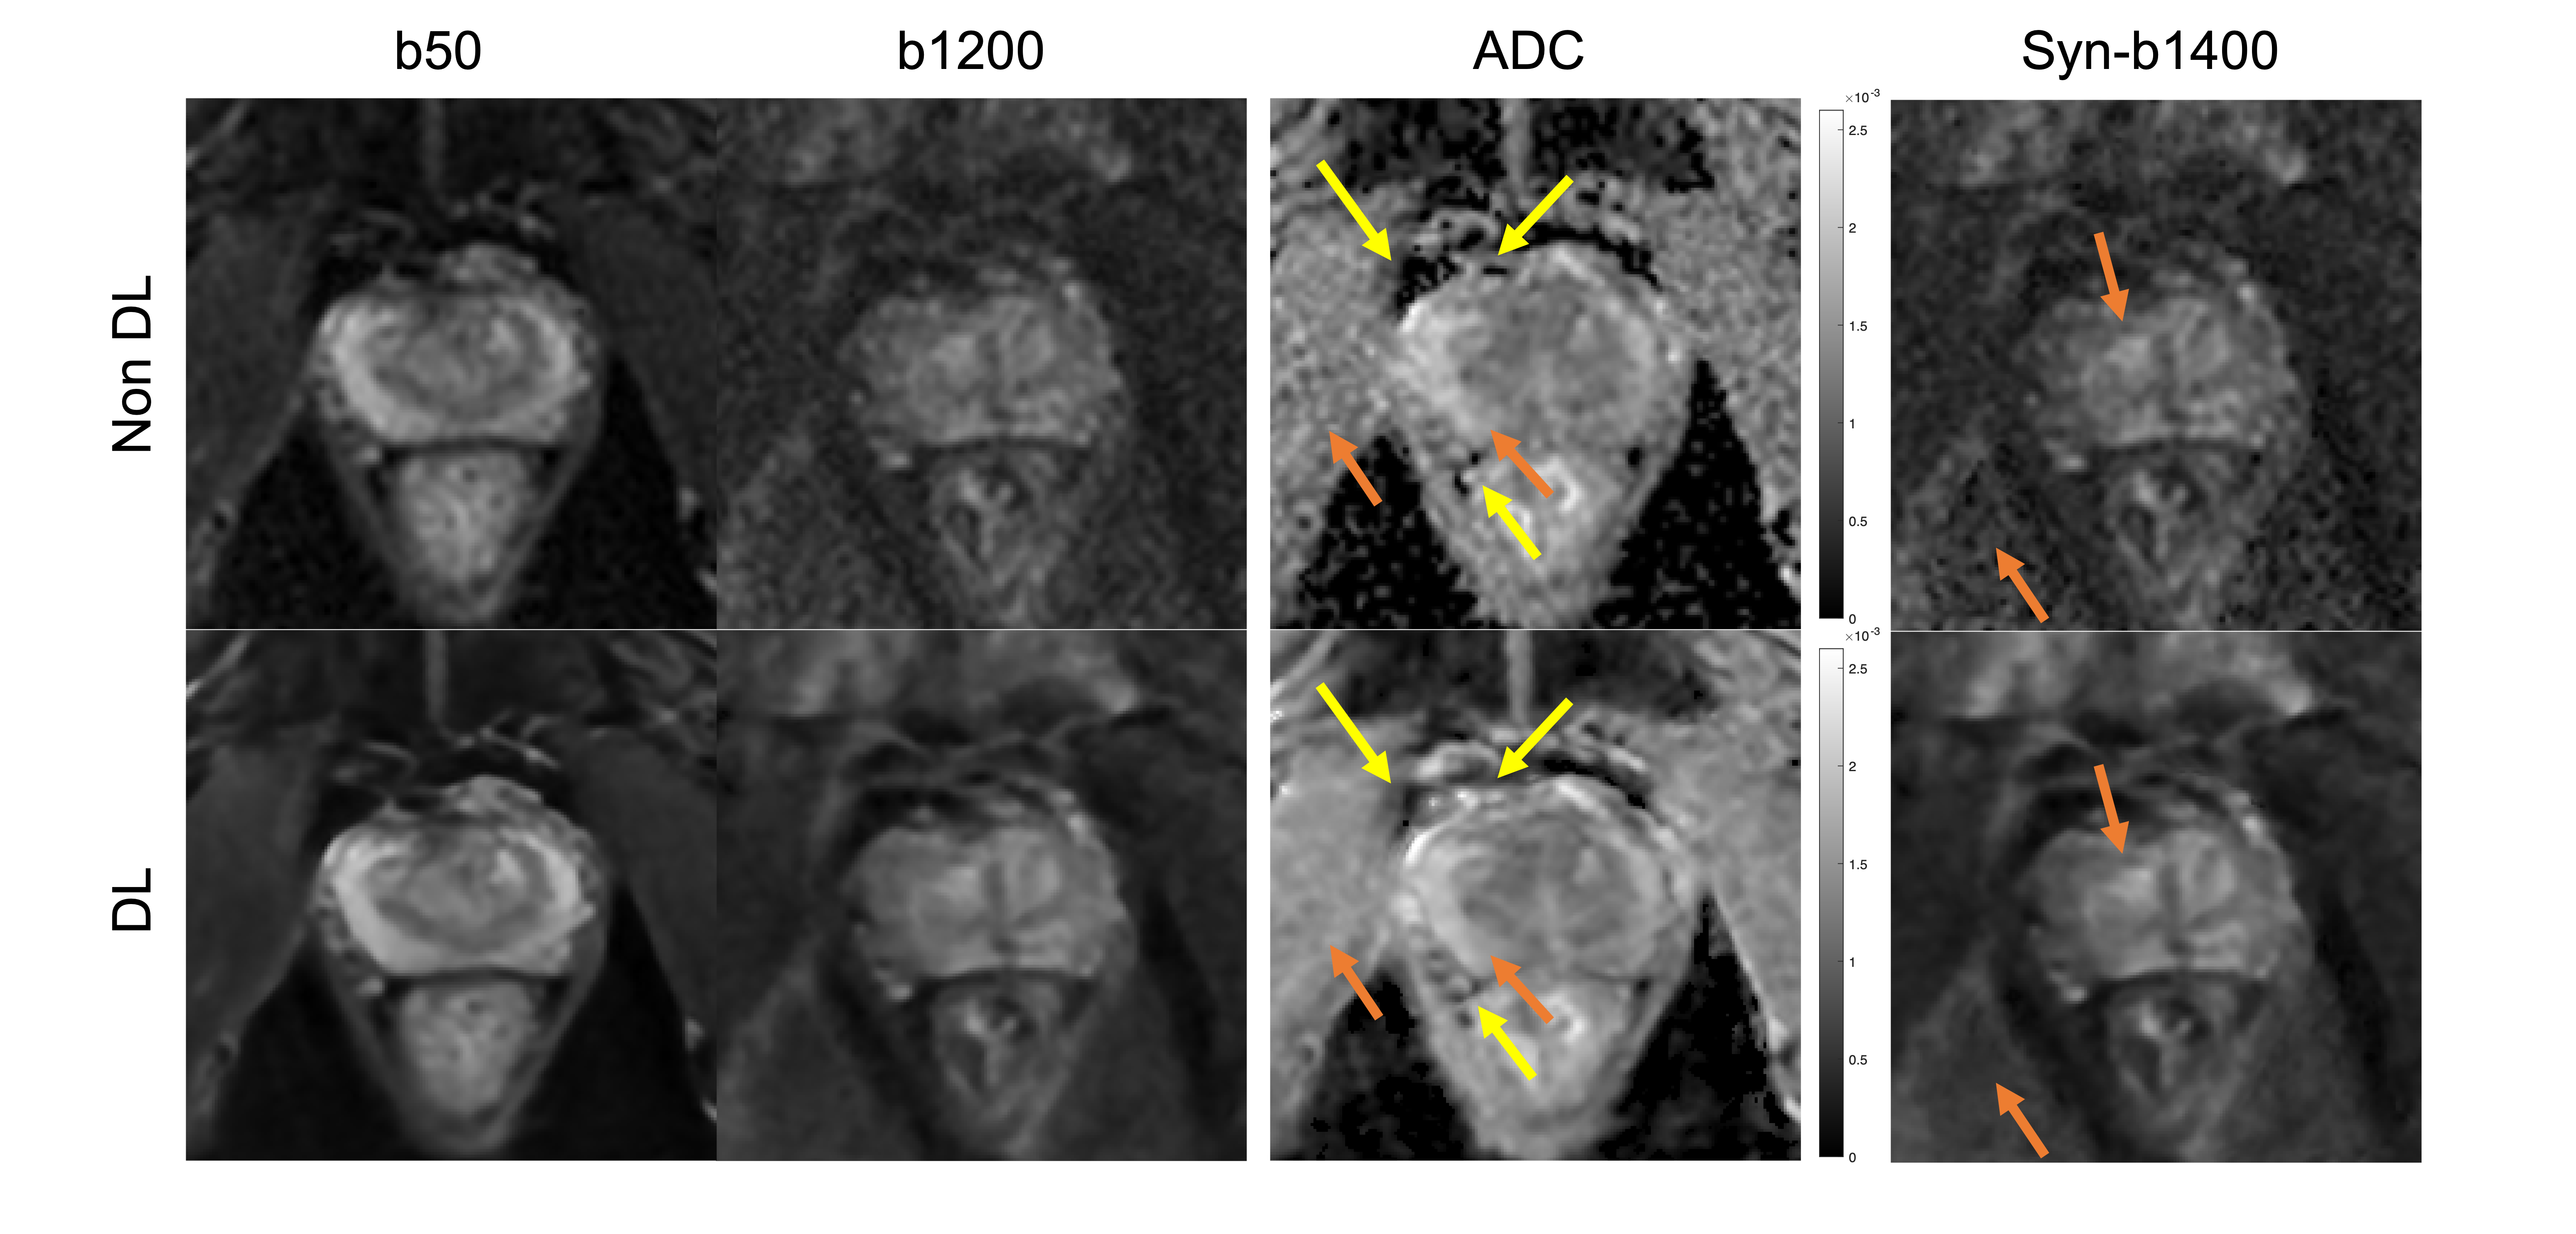
Figure 3. Sample case of synthetic b-value and ADC maps generated from pixel-by-pixel fitting using b50 and b1200 images without DL (top row) and with DL (bottom row). Yellow arrows indicate the wormhole artifacts that are reduced with DL MUSE. Orange arrows indicate regions with more homogeneous appearance after DL MUSE reconstruction.
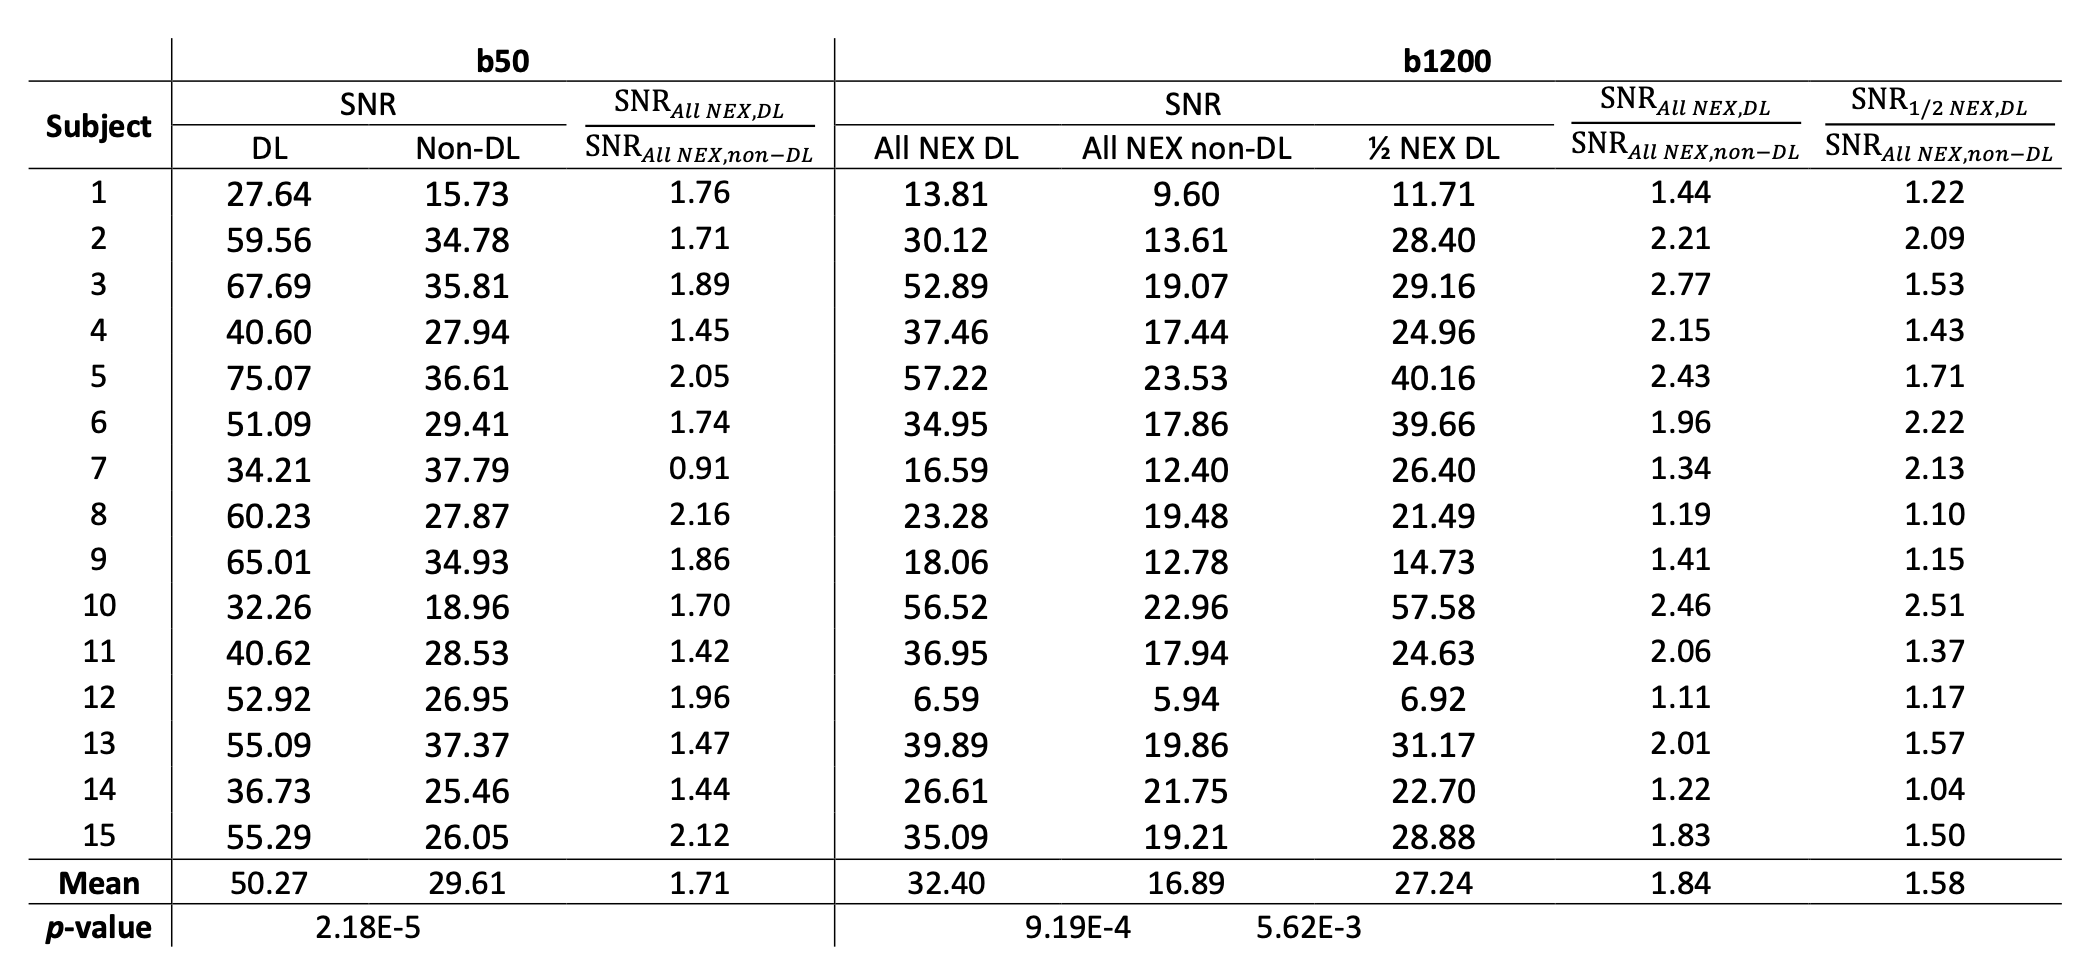
Table 1. SNR estimation measurements for DL and Non-DL series. Reported p-values are from a two-tailed Student’s t-test.
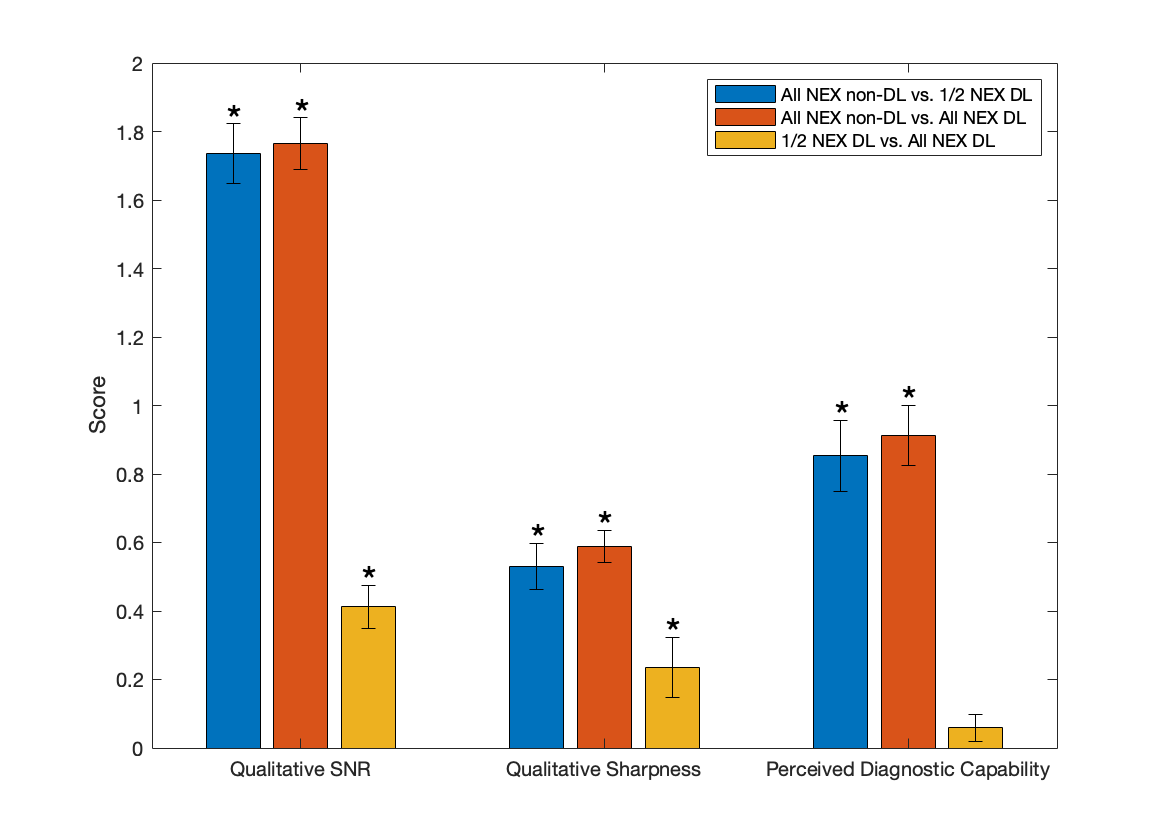
Figure 5. Results of semiquantitative grading for qualitative SNR, qualitative sharpness, and perceived diagnostic capability. The scoring system was on a -2 to 2 scale, negative values indicate the first series is better, positive values indicate the second series is better; -2/2 indicates images are obviously different; -1/1 indicates images are slightly different; 0 indicates images are equivalent. * indicates significant (p<0.05) differences between reconstruction methods based on a Wilcoxon signed rank test. Error bars are standard error of mean.
DOI: https://doi.org/10.58530/2023/3249