3246
Reliable and repeatable fully automated bolus arrival times and arterial inputs using 2 Hz whole brain multiband DSC-MRI at 7T1Advanced Imaging Research Center/Neurology, OHSU, PORTLAND, OR, United States, 2Advanced Imaging Research Center, OHSU, PORTLAND, OR, United States, 3Electrical Engineering, Polytechnique Montreal, Montreal, QC, Canada, 4Bioengineering, UIC, Chicago, IL, United States, 5Advanced Imaging Research Center, OHSU, Portland, OR, United States
Synopsis
Keywords: Data Processing, DSC & DCE Perfusion, Whole-brain bolus arrival times
Dynamic susceptibility contrast imaging has used bolus arrival time (BAT) in tissue, relative to an arterial input function (AIF), as a nuisance variable when deriving perfusion metrics (e.g. blood flow). However, BAT reflects physiological changes in both fluid dynamics of feeding vasculature and capillary inflow. This work presents a reproducible approach for reliable and repeatable quantification of an AIF and whole brain BAT, which itself may be germane to chronic and acute cerebrovascular disease (CVD), such as white matter hyperintensities, age-associated CVD, and stroke.Background
Dynamic susceptibility contrast (DSC) imaging has used bolus arrival time (BAT) in tissue, relative to an arterial input function (AIF), as a nuisance variable to be accounted for when deriving commonly-used perfusion metrics (e.g. blood flow) [1]. However, bolus arrival time reflects physiological changes in both fluid dynamics of vasculature feeding a tissue region and initial capillary inflow [2]. AIF determination often is based on signal quality, partial volume effects, and other considerations that introduce anatomical variation and associated transit delays between vascular territories. The calculation and interpretation of relative or absolute dynamic perfusion metrics must account for BAT at the measurement location. The introduction of local AIFs [3] and modeling techniques [4] have afforded reasonably accurate corrections for high regional variance in arrival times, relative to the total time of bolus passage, between a tracer measured at principle feeding arteries and in tissue; however, given the left-right symmetry and spatial structure of BATs in the brain, the reliable and repeatable quantification of BAT itself is of interest in chronic and acute cerebrovascular disease (CVD), such as white matter hyperintensities [5], age-associated CVD, and stroke [6].High temporal and spatial resolution afforded by multiband (MB) techniques allow whole brain coverage at 2Hz and provides sufficient temporal resolution to accurately quantify voxelwise BAT on a continuous scale. In this pilot study of two young and two aged individuals we sought to develop a fully automated method to generate AIFs and quantify BAT across the cortex, as well as assess the reliability and repeatability of the measurement and method at 7T.
Materials and Methods
Two sequential DSC experiments (500 GRE EPI volumes of 27 contiguous 3.1 mm slices, TR=0.5 s, TE=19 ms, FA=20°, MB factor=3, (2.5 mm)2 in-plane resolution) spaced by approximately 10 minutes and a T1-weighted sequence (0.7 mm isotropic voxels) were acquired using a Siemens 7T instrument with a 24ch Nova head coil on two young (28 and 29 years old) and two aged (67 years old) subjects ; 0.033 mmol/kg (~5 mL) of gadoteridol was injected intravenously at volume 120 in each experiment.Data were automatically processed using AFNI, ANTs, Freesurfer and MATLAB and subjected to a two-step process for BAT and AIF extraction. Briefly, each DSC run was compiled to NIFTI format (dcm2niix), slice-time corrected (3dTshift), motion corrected (3dvolreg), nonlinearly corrected for EPI-based distortions (3dQwarp, 3dNwarpApply), and the first 25 volumes were removed to allow signal baseline to reach steady state. T1-weighted volumes were skull stripped (antsBrainExtraction.sh), subjected to an adaptive non-local mean filter (DenoiseImage), and whole cortex masks and neocortical aparc+aseg ROIs were derived from Freesurfer 7.2 (recon-all). Finally, the average cortical time course was used as the target function for a Hilbert transform of each voxel time course (3dmaskave, 3ddelay [7]); the result was used to find voxels with the earliest bolus arrival (3dhist, 3dTstat, 3dcalc), and these voxels were averaged to generate an AIF, which was then used as a target function for the final BAT map (3ddelay). BATs were averaged across voxels within each of 32 neocortical parcels (colored brain regions, insets Figs. 2, 3) for each DSC experiment in each subject (3dmaskave).
Results
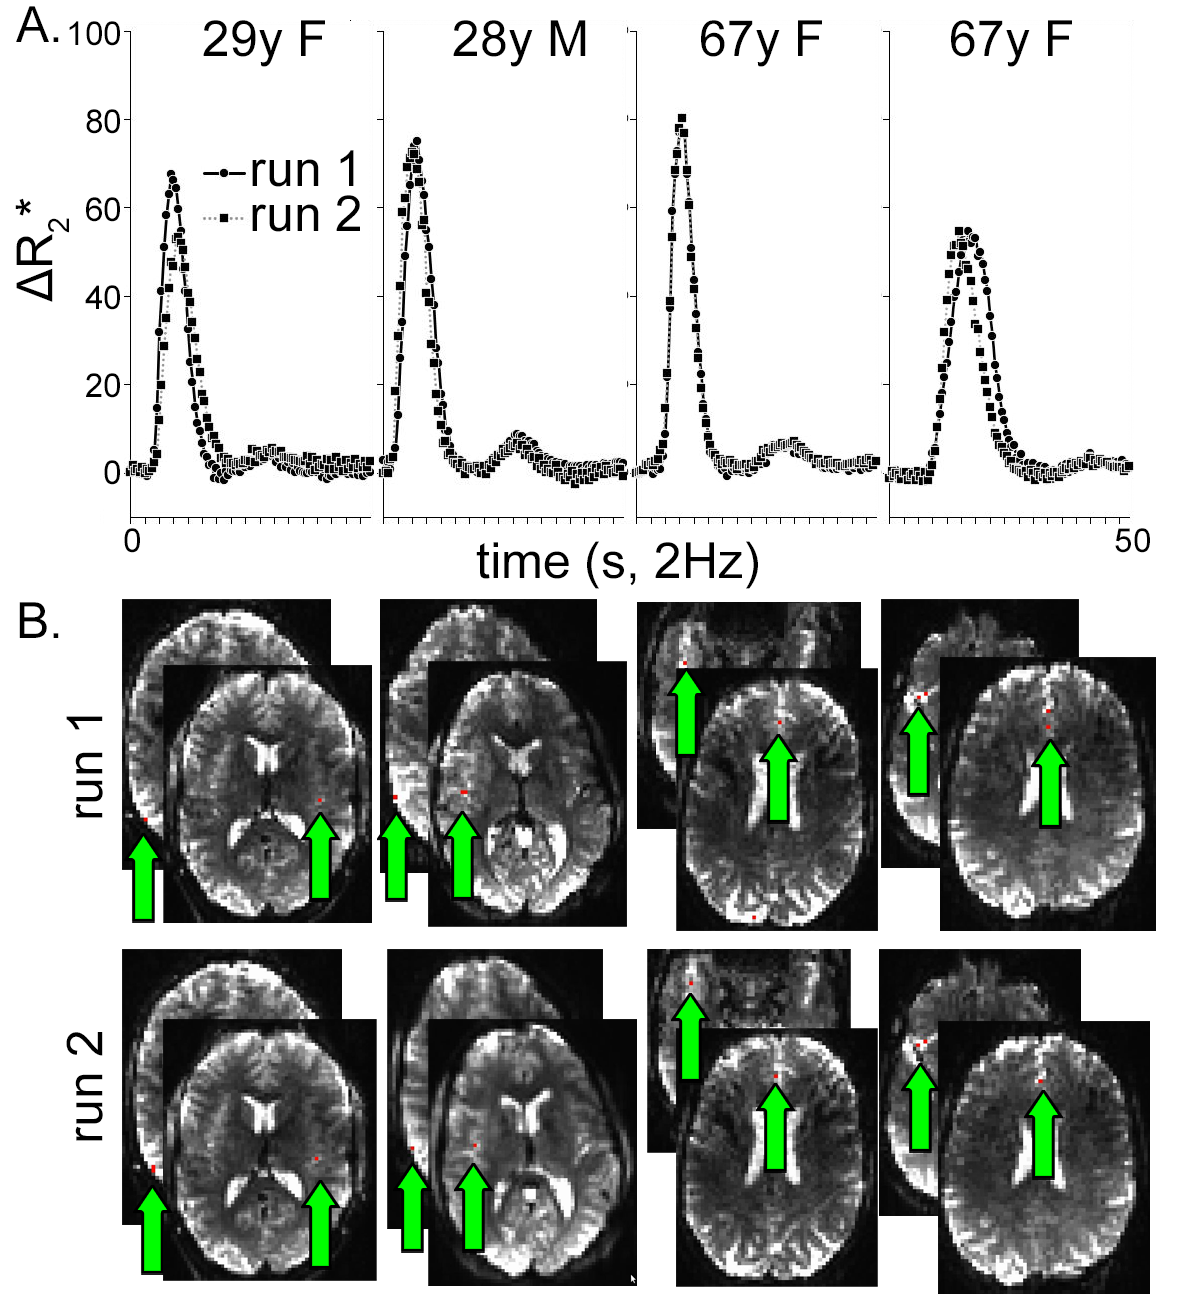
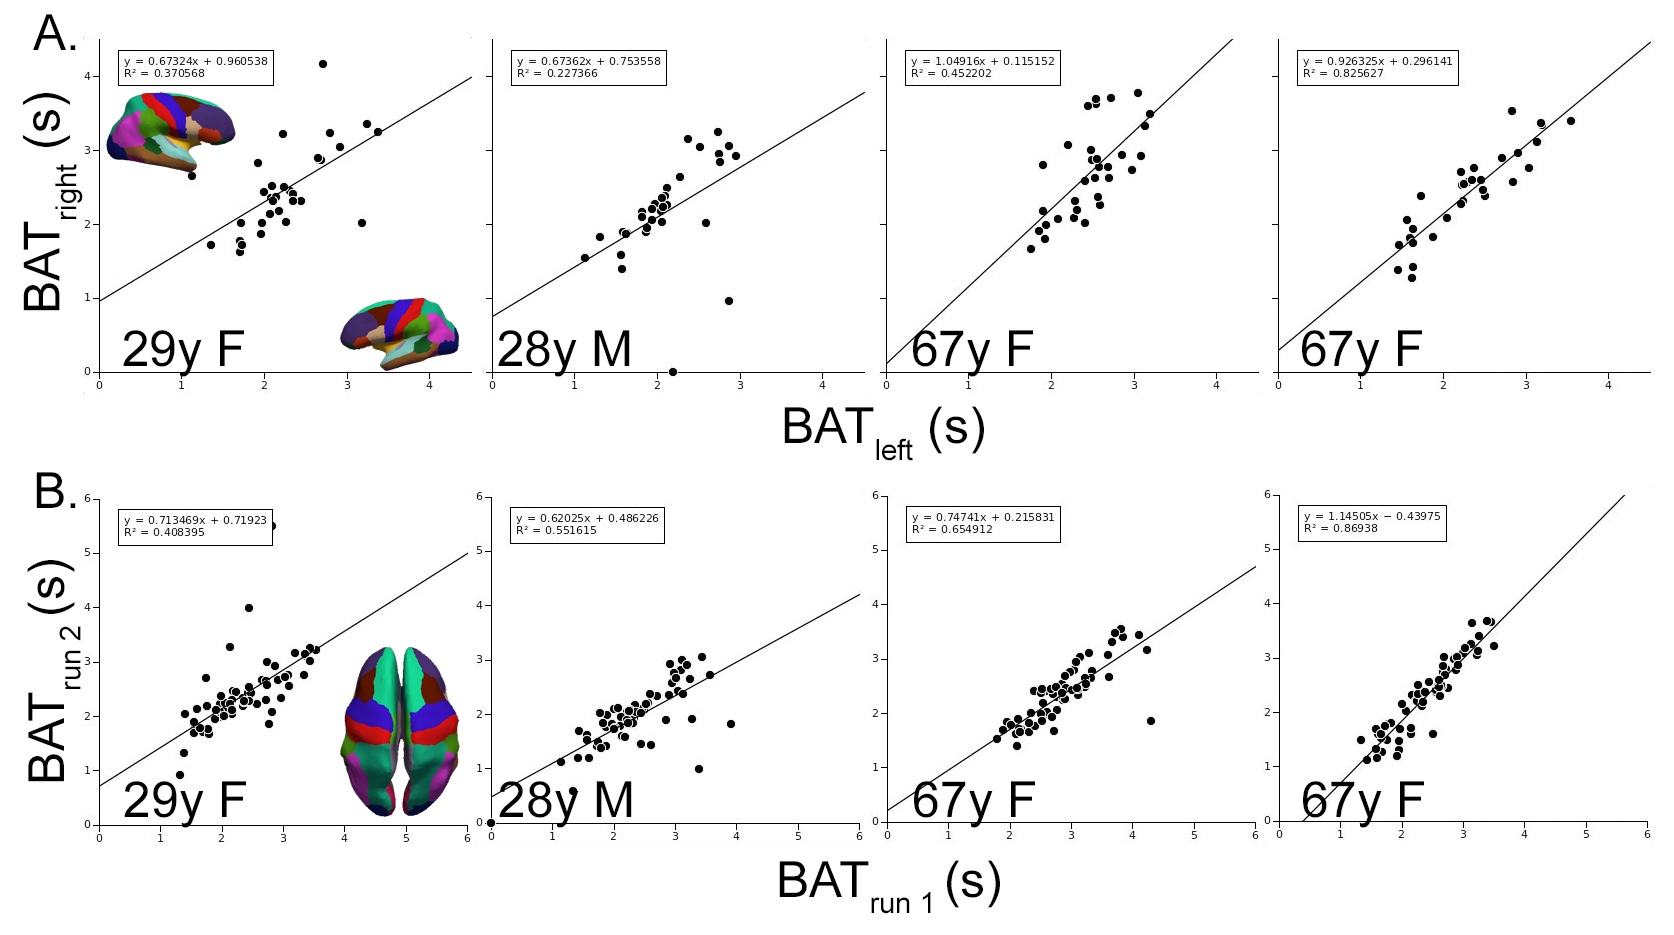
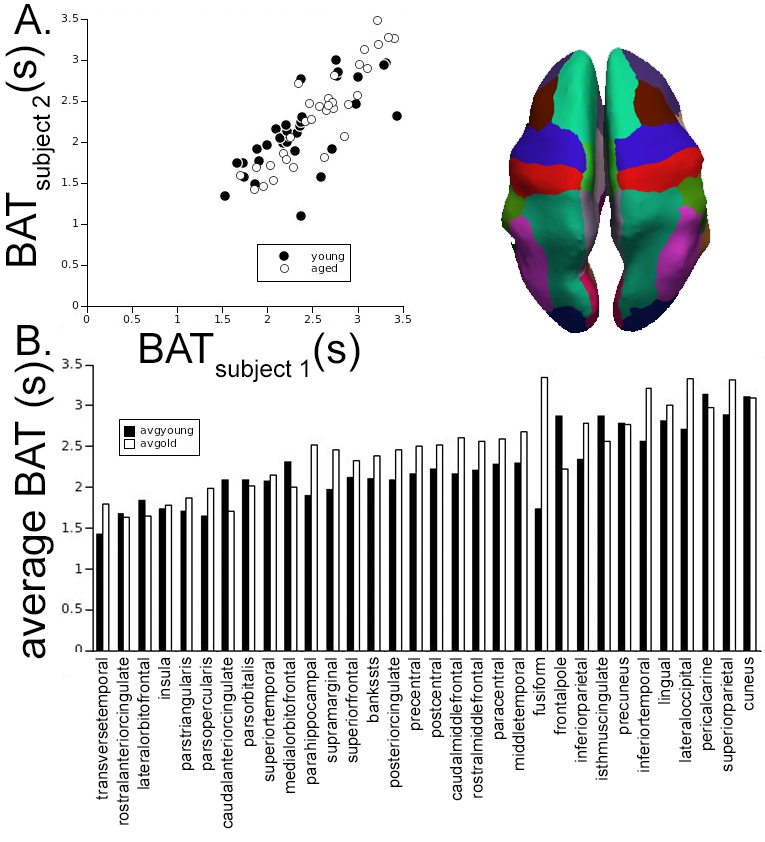
Automatically derived AIFs were nearly identical between runs in all four subjects (Fig. 1A) as were the voxels automatically selected as those with the earliest BAT; nearly all were at or near the insular or anterior cerebral arteries (Fig. 1B). BATs were reliable across hemisphere (Fig. 2A) and repeatable across runs (Fig. 2B) within subject. BAT in all subjects, relative to each DSC AIF, ranged from <2s in cortex nearest the insular arteries (transverse temporal, insula), MCA/M2 branches (pars triangularis, pars opercularis), and ACA (rostral and caudal anterior cingulate to >3s in more posterior parcels (lingual gyrus, lateral occipital, pericalcarine, superior parietal, and cuneus) (Fig. 3). Finally, there was a statistically significantly shorter parcelwise BAT averaged over younger subjects relative to aged subjects (means: 2.25 and 2.46s, respectively; t(31)=-2.97, p=0.005, Fig. 3).Discussion
The acquisition and processing pipeline provides repeatable and reliable voxel- and parcelwise neocortical BAT relative to the time course of cerebral voxels with the earliest BAT (i.e. the AIF) using MB DSC at 7T. Differences in tissue BAT are known to exert proportionate errors in both DSC and DCE-derived pharmacokinetic parameters; the magnitude of BAT across the brain varies in disease and with age. BAT lengthening with age may be a predictor of vascular pathology resulting in hypoperfusion and ultimately chronic ischemia-related disease. These data together with the described method provide a dependable metric by which one facet of the health of the cerebrovascular system can be assessed on both the macro- and microvascular scale.Acknowledgements
NIH/NIA R56AG066634References
1. Mouannes-Srour JJ, Shin W, Ansari SA, Hurley MC, Vakil P, Bendok BR, Lee JL, Derdeyn CP, Carroll TJ. Correction for arterial-tissue delay and dispersion in absolute quantitative cerebral perfusion DSC MR imaging. Magn Reson Med. 2012 Aug;68(2):495-506. doi: 10.1002/mrm.23257. Epub 2011 Dec 12. PMID: 22162092; PMCID: PMC3310307.
2. Calamante F, Willats L, Gadian DG, Connelly A. Bolus delay and dispersion in perfusion MRI: implications for tissue predictor models in stroke. Magn Reson Med. 2006 May;55(5):1180-5. doi: 10.1002/mrm.20873. PMID: 16598717.
3. Calamante F, Mørup M, Hansen LK. Defining a local arterial input function for perfusion MRI using independent component analysis. Magn Reson Med. 2004 Oct;52(4):789-97. doi: 10.1002/mrm.20227. PMID: 15389944.
4. Larsson HBW, Vestergaard MB, Lindberg U, Iversen HK, Cramer SP. Brain capillary transit time heterogeneity in healthy volunteers measured by dynamic contrast-enhanced T1 -weighted perfusion MRI. J Magn Reson Imaging. 2017 Jun;45(6):1809-1820. doi: 10.1002/jmri.25488. Epub 2016 Oct 12. PMID: 27731907; PMCID: PMC5484282.
5. Paling D, Thade Petersen E, Tozer DJ, Altmann DR, Wheeler-Kingshott CA, Kapoor R, Miller DH, Golay X. Cerebral arterial bolus arrival time is prolonged in multiple sclerosis and associated with disability. J Cereb Blood Flow Metab. 2014 Jan;34(1):34-42. doi: 10.1038/jcbfm.2013.161. Epub 2013 Sep 18. PMID: 24045400; PMCID: PMC3887342.
6. Calamante F, Gadian DG, Connelly A. Quantification of perfusion using bolus tracking magnetic resonance imaging in stroke: assumptions, limitations, and potential implications for clinical use. Stroke. 2002 Apr;33(4):1146-51. doi: 10.1161/01.str.0000014208.05597.33. PMID: 11935075.
7. Saad ZS, DeYoe EA, Ropella KM. Estimation of FMRI response delays. Neuroimage. 2003 Feb;18(2):494-504. doi: 10.1016/s1053-8119(02)00024-1. PMID: 12595202.
Figures