3242
Investigating the computational reproducibility of Neurodesk
Thuy Thanh Dao1, Angela Renton1,2, Aswin Narayanan3, Markus Barth1, and Steffen Bollmann1
1School of Information Technology and Electrical Engineering, The University of Queensland, Brisbane, Australia, 2Queensland Brain Institute, The University of Queensland, Brisbane, Australia, 3Australian National Imaging Facility, The University of Queensland, Brisbane, Australia
1School of Information Technology and Electrical Engineering, The University of Queensland, Brisbane, Australia, 2Queensland Brain Institute, The University of Queensland, Brisbane, Australia, 3Australian National Imaging Facility, The University of Queensland, Brisbane, Australia
Synopsis
Keywords: Software Tools, Data Processing
Glatard et al [1] found that the operating system version affected the computational results of neuroimaging analysis pipelines. Their work demonstrated that this reproducibility issue is caused by the accumulated floating-point differences across operating systems. Neurodesk (www.neurodesk.org) approaches this problem by packaging every pipeline into a software container and thereby can control the underlying dependencies for each application regardless of the operating system. In this work, a brain tissue segmentation pipeline from the FMRIB Software Library (FSL) was compared with a containerised version from Neurodesk. The comparison revealed that Neurodesk provides computational reproducibility compared with local installations.Introduction
The computational results of neuroimaging analysis pipelines can differ across operating systems due to differences in underlying libraries, such as glibc. This reproducibility issue was quantified for several magnetic resonance images (MRI) analysis tools by Glatard et al [1]. The issues were caused largely by different representations of floating-point numbers depending on the version of operating systems and its shared libraries. Neurodesk (www.neurodesk.org) is a platform that aims to increase accessibility and reproducibility by packaging every pipeline into a software container. It thereby can control the underlying dependencies for each application regardless of the operating system. To evaluate the computational reproducibility of this approach, we compared brain tissue segmentations using FMRIB Software Library (FSL) on Neurodesk vs. local installation on two different Linux distributions.Methods
FSL 6.0.5.1 was built in Neurodesk and was natively run on two Linux systems resulting in 4 setups (Table 1). We segmented the cortical and subcortical structures of 157 T1-weighted MRI from the International Consortium for Brain Mapping using FSL BET (brain extraction), FAST (tissue classification), FLIRT (image registration) and FIRST (subcortical tissue segmentation). The outputs from the four systems were compared pairwise: local system A vs B, and Neurodesk system A vs B.FSL is dynamically linked to use system libraries like libmath and LAPACK that are loaded at runtime. Thus, results may vary due to these shared libraries’ versions despite having the same version of FSL installed. To investigate how differences emerge and to validate that homogenizing the computing system resolves the reproducibility issue, system calls from FSL FLIRT and FIRST were recorded using ltrace.
Results
The checksums showed that BET and FAST produced identical results both inter-run and inter-system.For FLIRT outputs, the Dice coefficients indicated significantly larger differences across local installations (Dice coefficient; Range: 0.10 − 0.81, Mean = 0.49, Standard deviation =0.17), than Neurodesk installations, for which results were identical (Dice coefficient; Range: 1.00 − 1.00, Mean = 1.00, Standard deviation = 0.00, t(156) = 38.28, p < 0.001, Figure 1a). Notably, Dice coefficients for local installations, while very low, largely represented subtle differences in output intensity (Mean = 1.88, Standard deviation = 1.97, intensity ∈ Z:intensity ∈ [0,1903]).
Subcortical segmentation outputs from FIRST showed high agreement in Neurodesk setups where nearly 93% of the results were identical, while no identical results were found between local installations. The Dice similarity showed less significant variation in Neurodesk installations (Dice coefficient; Range: 0.999978 − 1, Mean ~= 1.00, Standard deviation < 0.01) compared to local installation (Dice coefficient; Range: 0.999541 − 0.999942, Mean = 0.999854, Standard deviation < 0.01, t(156) = 25.39, p < 0.001, Figure 1b) The mismatch in subcortical segmentation was more prevalent at the edges of each structure, as can be seen in Figure 2.
Glatard et al reported floating-point variations for the expf(), cosf(), and sinf() functions that affected the reproducibility in older operating system versions. However, in our operating systems, the ltrace records revealed that the number of calls to several functions differed across local installations while remaining consistent across Neurodesk installations. In particular, the floorf() function had the highest number of mismatches of over 13.300 and 5.5 million calls across locally installed FLIRT and FIRST, respectively. Additional to early mismatches in floorf() function calls, mismatches across local installations were also found later in the process in functions related to mathematical operations, matrix libraries, memory allocation and system operations (Figure 3).
Discussion and Conclusion
The library call records indicated that the operating system version has a significant effect on the reproducibility of neuroimaging applications, especially dynamically linked tools that use shared libraries. Neurodesk addresses this reproducibility issue by maintaining the same system version across computing environments using containerisation technology.Acknowledgements
No acknowledgement found.References
Glatard T, Lewis LB, Ferreira da Silva R, et al. Reproducibility of neuroimaging analyses across operating systems. Frontiers in Neuroinformatics. 2015Figures
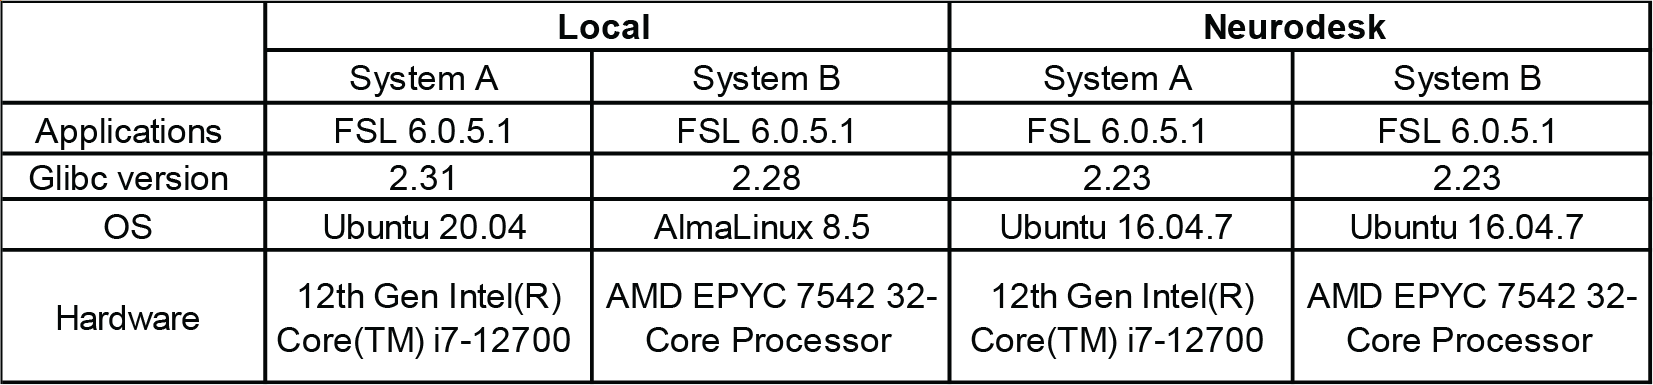
Table 1. Operating systems in this experiment.
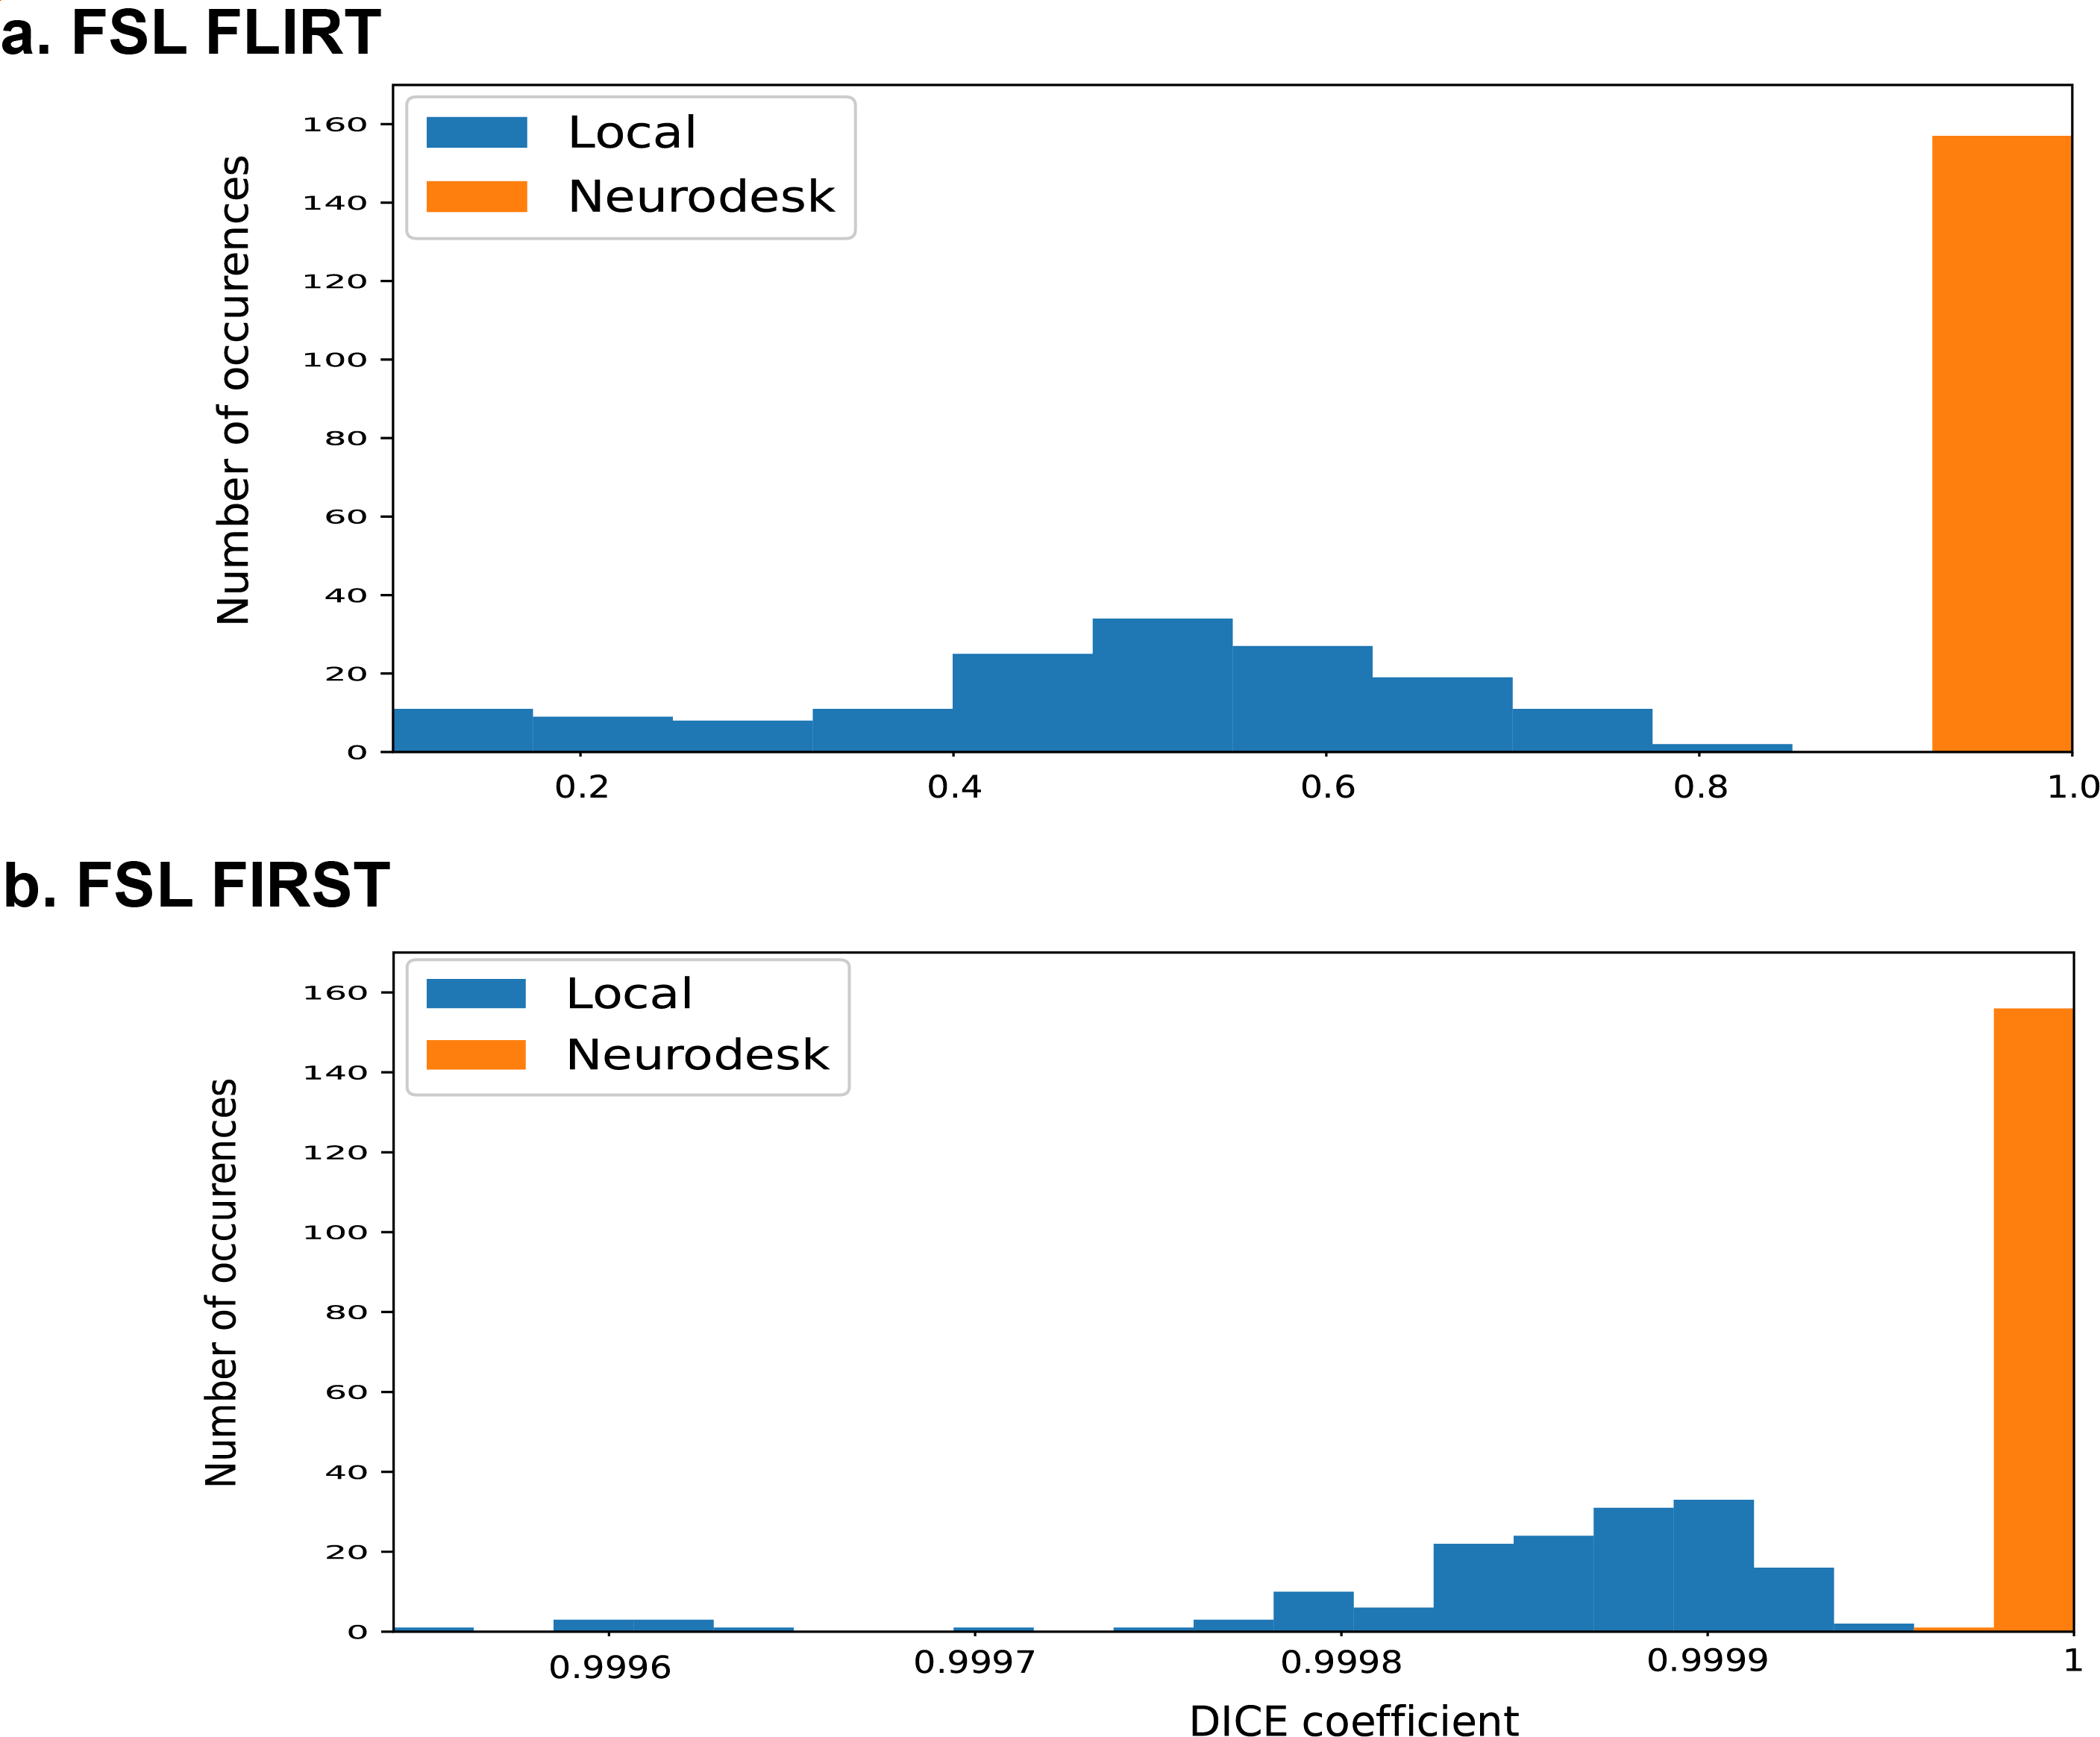
Figure 1. The Dice similarity in pairwise comparisons: Local system A vs B (blue) and Neurodesk system A vs B (orange) for a) FLIRT outputs and b) FIRST outputs.
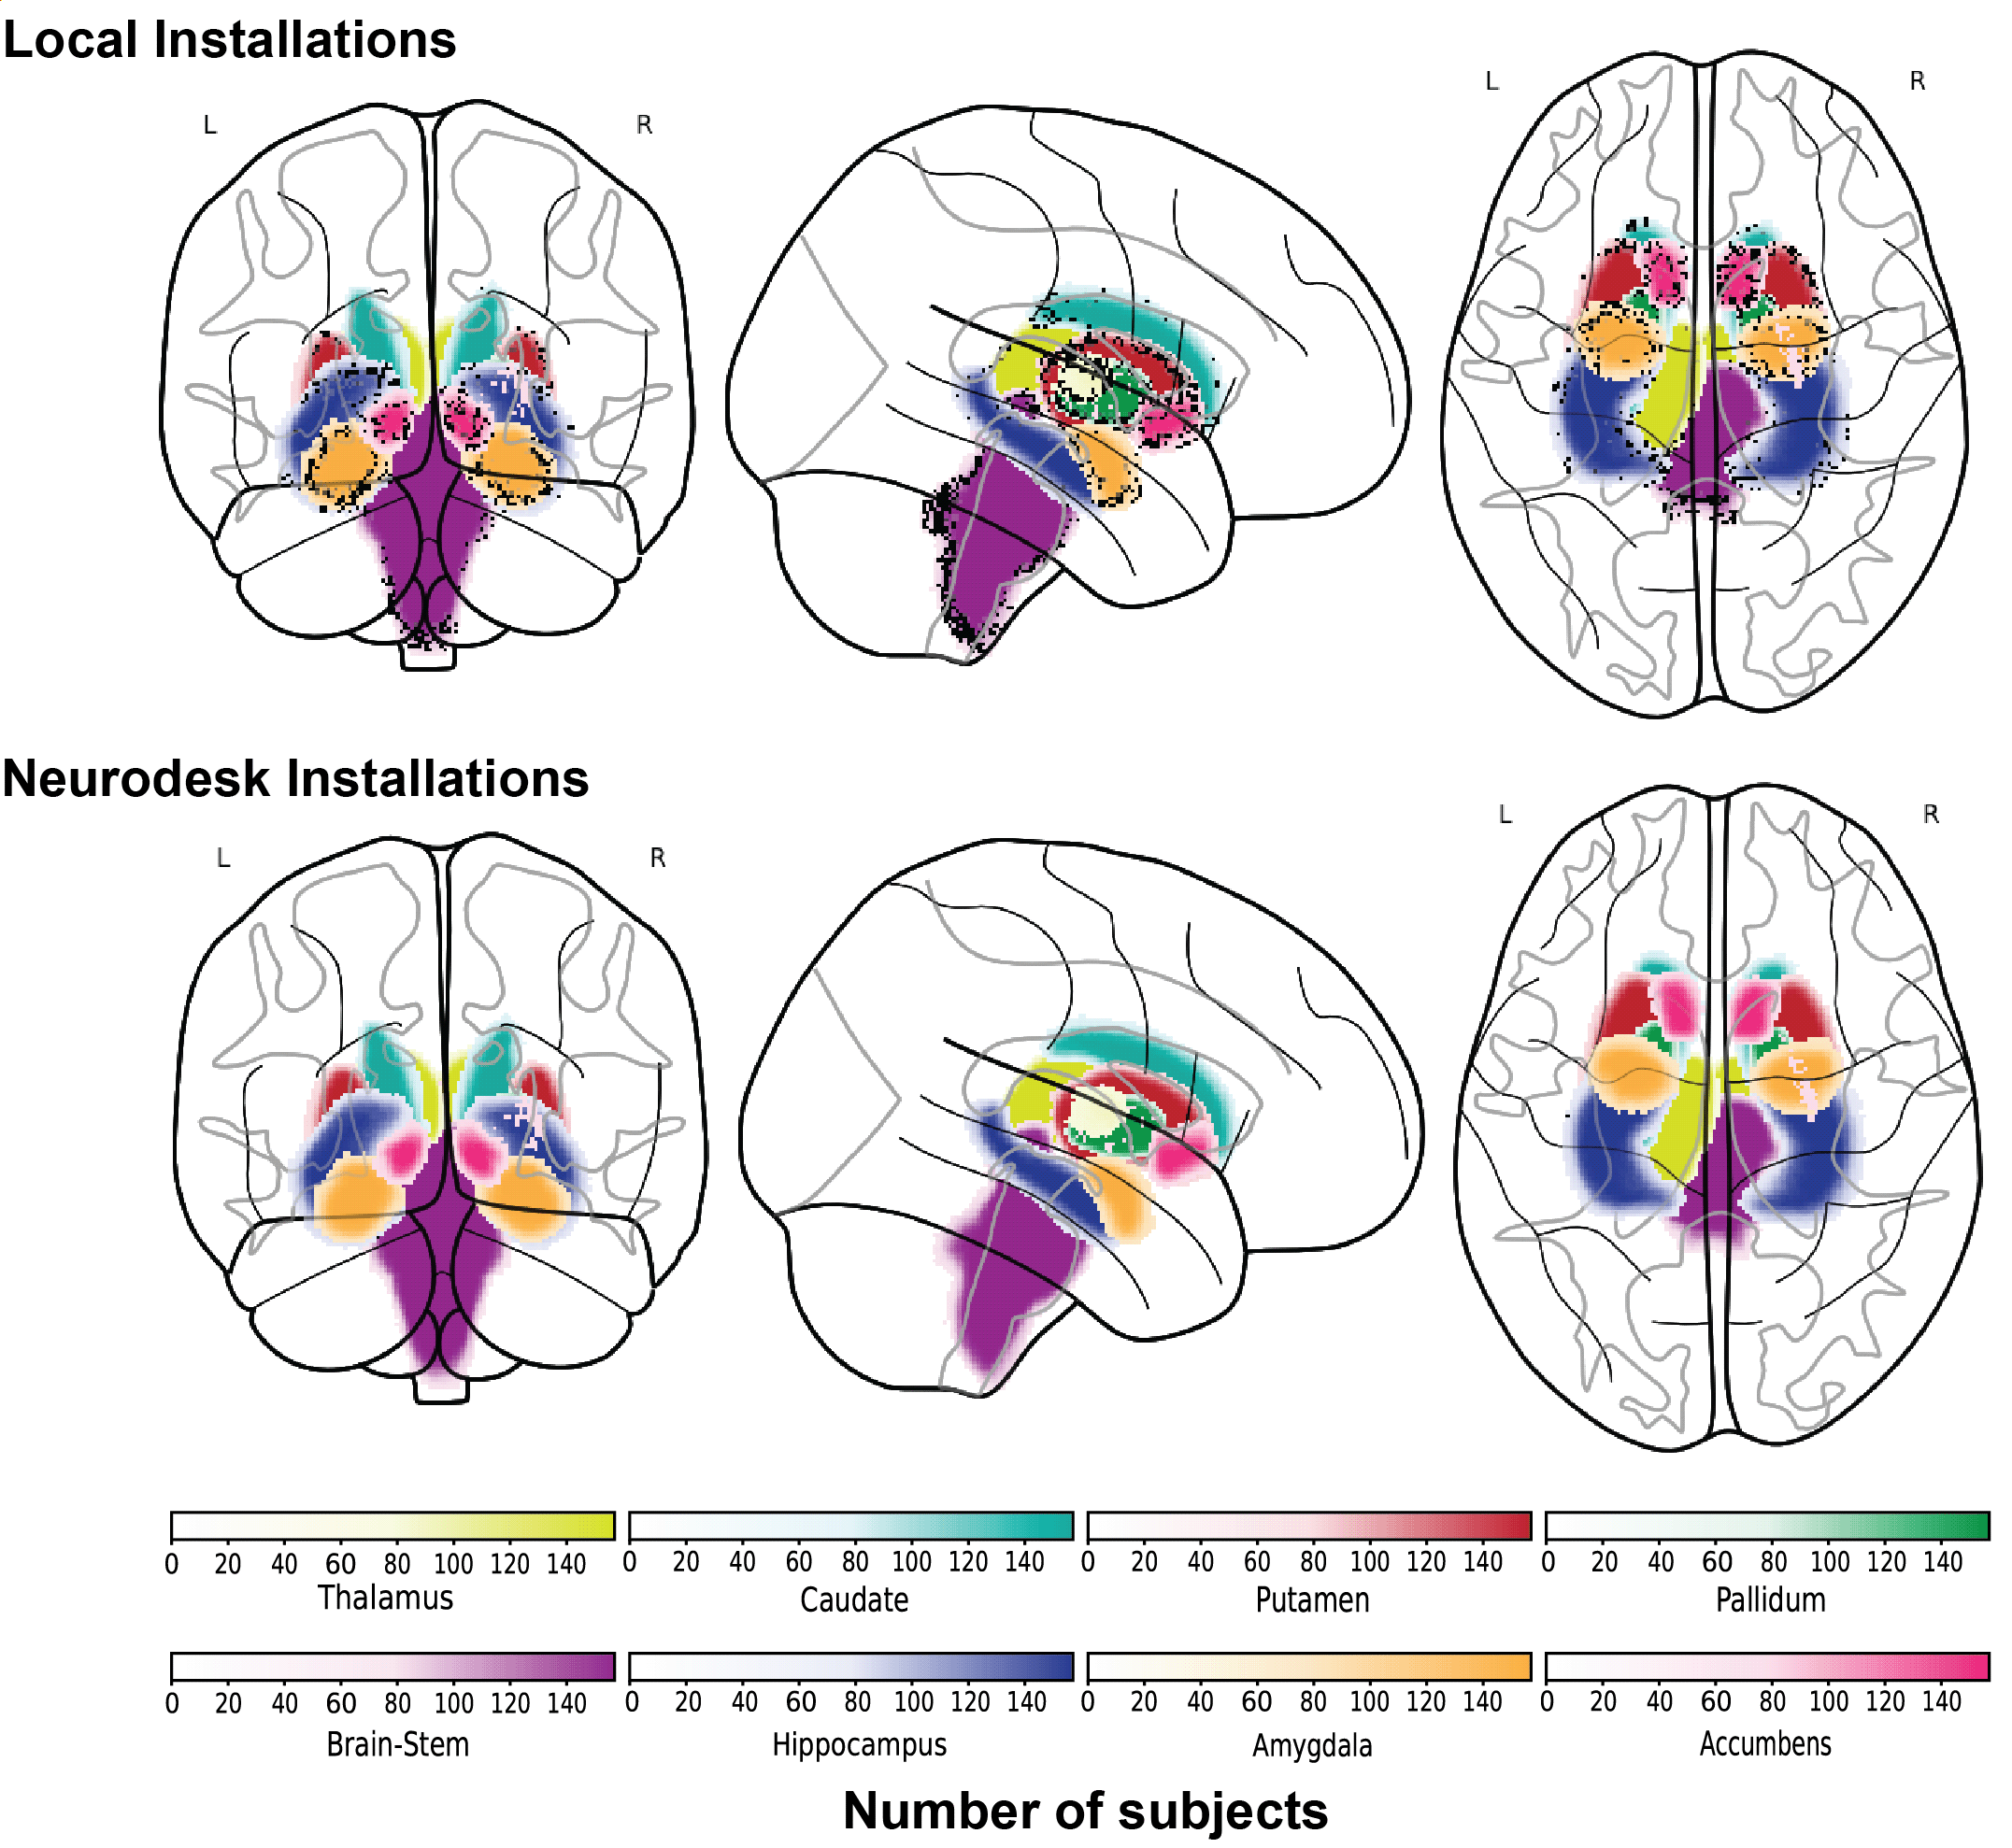
Figure 2. The subcortical structure map of 157 subjects from local installations (top) and Neurodesk installations (bottom) where each subcortical structure is indicated by a distinct color and the number of participants classified with that label is indicated by increasing saturation. Voxels with inter-system differences in classification are indicated in black.
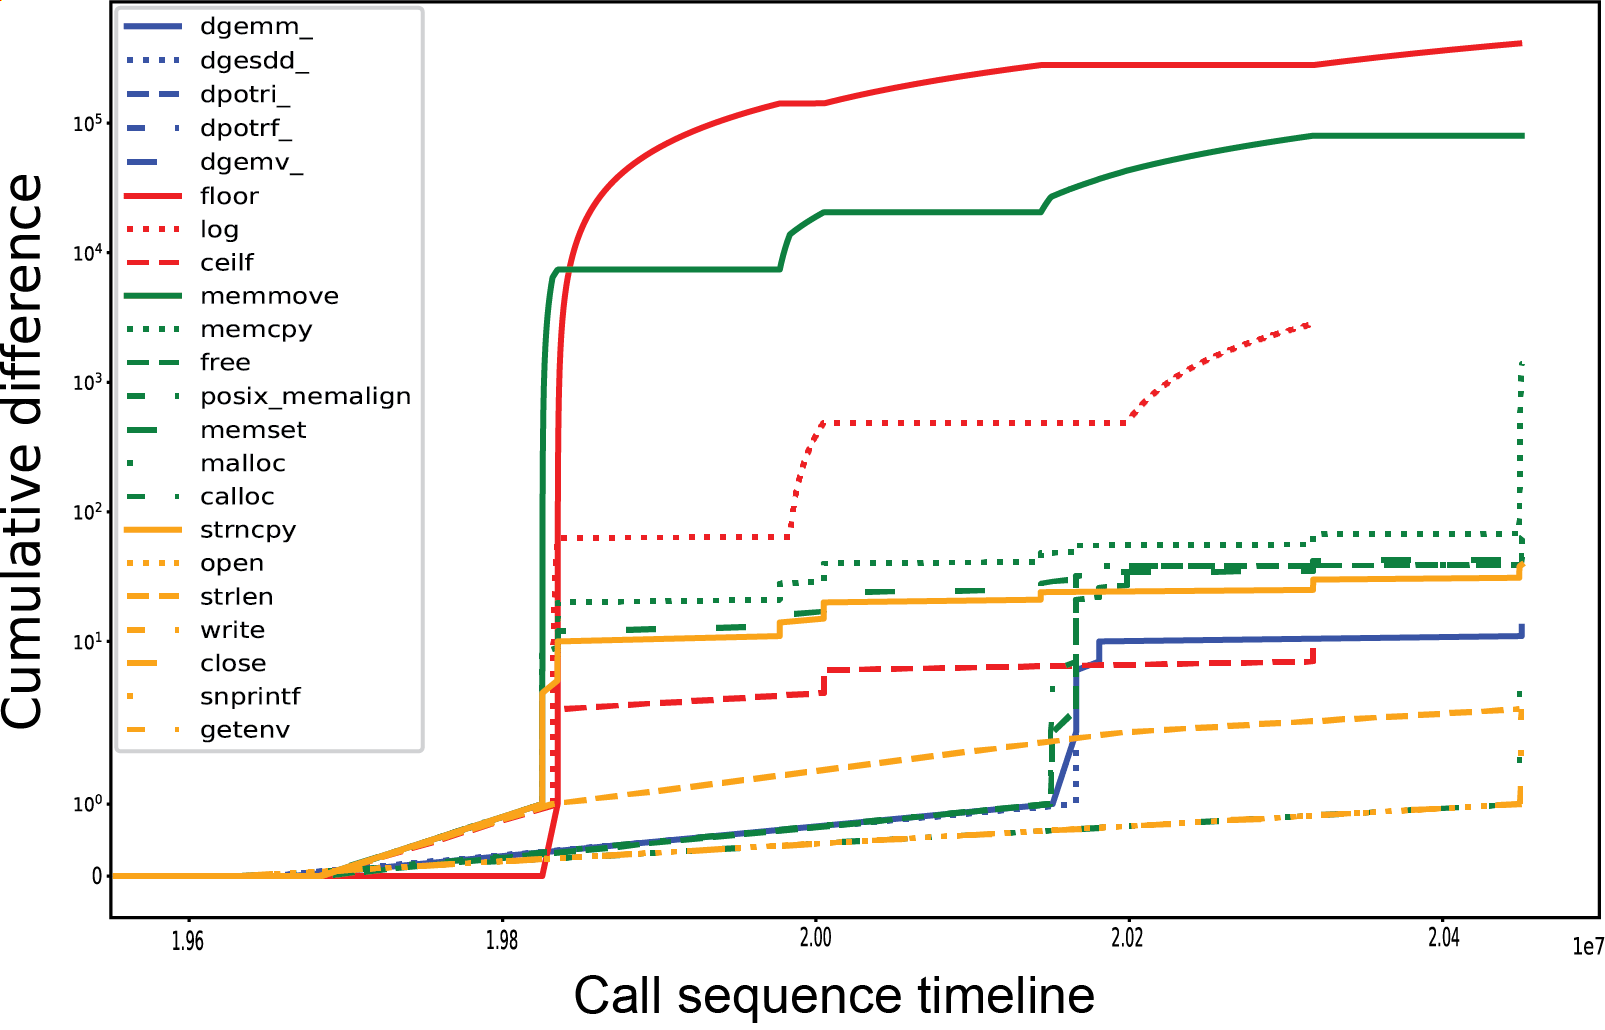
Figure 3. Cumulative differences in calls to shared library functions between two locally installed FSL FIRST processes.
DOI: https://doi.org/10.58530/2023/3242