3238
The Use of Quantitative Metrics and Machine Learning to Predict Radiologist Interpretations of Image Quality and Artifacts
Lucas McCullum1, John Wood2, Maria Gule-Monroe3, Ho-Ling Anthony Liu4, Melissa Chen3, Komal Shah3, Noah Nathan Chasen3, Vinodh Kumar3, Ping Hou4, Jason Stafford4, Caroline Chung5, Moiz Ahmad4, Christopher Walker4, and Joshua Yung4
1Medical Physics, MD Anderson Cancer Center, Houston, TX, United States, 2Enterprise Development and Integration, MD Anderson Cancer Center, Houston, TX, United States, 3Neuroradiology, MD Anderson Cancer Center, Houston, TX, United States, 4Imaging Physics, MD Anderson Cancer Center, Houston, TX, United States, 5Data Governance & Provenance, MD Anderson Cancer Center, Houston, TX, United States
1Medical Physics, MD Anderson Cancer Center, Houston, TX, United States, 2Enterprise Development and Integration, MD Anderson Cancer Center, Houston, TX, United States, 3Neuroradiology, MD Anderson Cancer Center, Houston, TX, United States, 4Imaging Physics, MD Anderson Cancer Center, Houston, TX, United States, 5Data Governance & Provenance, MD Anderson Cancer Center, Houston, TX, United States
Synopsis
Keywords: Machine Learning/Artificial Intelligence, Data Analysis, Image Quality
A dataset of 3D-GRE and 3D-TSE brain 3T post contrast T1-weighted images as part of a quality improvement project were collected and shown to five neuro-radiologists who evaluated each sequence for image quality and artifacts. The same scans were processed using the MRQy tool for objective, quantitative image quality metrics. Using the combined radiologist and quantitative metrics dataset, a decision tree classifier with a bagging ensemble approach was trained to predict radiologist assessment using the quantitative metrics. The resulting AUCs for each classification task were above 0.7 for all combinations of sufficiently represented classes and qualitative image metrics.Introduction
Recent studies have suggested that 7% of outpatient and 29% of inpatient MRI scans exhibited motion artifacts resulting in 20% of all MRI examinations requiring a repeat acquisition costing the hospital, on average, upwards of $100,000 is lost revenue per year [1]. Further, expert-annotated radiological data for image quality assessment and artifact screening is a time-consuming, expensive, and a potentially unreliable quality assessment method due to the presence of, sometimes significant, inter-reader variability (differences in assessment of the same image across annotators). For this reason, alternative quantitative methods to measure image quality and artifacts are currently being investigated to reduce the workload of radiologists and increase clinical workflow efficiency and cost-effectiveness.Methods
A series of post-contrast T1-weighted 3D Gradient Recalled Echo (3D-GRE) images and 3D Turbo Spin Echo (3D-TSE) brain images were acquired on a fleet of 3T MRI scanners as part of a quality improvement project. Five board certified neuro-radiologists evaluated the images for image quality using a Likert score (1-Unacceptable, 2-Poor, 3-Acceptable, 4-Good, and 5-Excellent) and imaging artifact (1-Severe, 2-Moderate, 3-Minor, and 4-No Artifact). The number of validated radiologist assessments of image quality were 87 and 86 for the GRE and 3D-TSE, respectively, and 91 and 88 for the GRE and 3D-TSE for imaging artifact, respectively.To make classifications of radiologist-assessed MRI images based on quantitative metrics, the quality assurance and checking tool, MRQy, was processed on each scan to produce the 25 metrics as described in the tool’s original publication [2]. After extraction, severely colinear MRQy metrics were dropped using a Pearson correlation matrix where highly correlated metrics (|r| > 0.7) were reduced to a single metric to prevent the future model from overfitting and provide the most stable and generalizable predictions. After filtering, the remaining MRQy metrics used to make the classifications were VAR, CV, CPP, PSNR, SNR3, CNR, CVP, EFC, and FBER.
Due to the non-linear relationship of radiologist preference to MRQy metrics, a decision tree classifier was employed over linear methods (i.e., linear classifier). To minimize overfitting and generalize over many subsets of the training data, a bagging classifier [3] was applied on the original decision tree classifier. The input to the model was split into 70% training and 30% testing subsets and model output was tested using a Receiver Operator Curve (ROC) and subsequent Area Under the ROC Curve (AUC) analysis. Classes with insufficient representation (<10% of training set), such as exceptionally low image quality and artifact scores, were dropped to prevent overfitting of the decision tree classifier. A confusion matrix was used to determine the source of classification error amongst the classes.
Results
For the image quality classification task, the computed test-set AUC for the 3D-GRE sequence was 0.87, 0.80, and 0.77 for the Acceptable, Good, and Excellent classes respectively while the computed test-set AUC for the 3D-TSE sequence was 0.86, 0.71, and 0.76 for the Acceptable, Good, and Excellent classes, respectively.For the imaging artifact classification task, the computed test-set AUC for the 3D-GRE sequence was 0.87, 0.74, and 0.75 for the Moderate, Minor, and No Artifact classes respectively while the computed test-set AUC for the 3D-TSE sequence was 0.82 and 0.82 for the Minor and No Artifact classes, respectively.
Discussion
With most of the AUCs in this study being 0.7 or above, there is promising evidence that the MRQy metrics could be used for rapid estimates of radiologist assessments for both image quality and artifacts for both the 3D-GRE and 3D-TSE sequences on a 3T MRI scanner. Further, after confusion matrix analysis, it was noted that a substantial degree of inter-reader variability existed due to the high instance of nearest-neighbor class mistakes especially towards the higher end of the Likert scale (i.e., image quality of 4 versus 5 led to more classification errors image quality of 3 versus 4). This could explain the improved classifier AUC scores at the lower end of the scales. This pattern can be seen in every classification task performed in this study except for the 3D-TSE imaging artifact of which the Minor and No Artifact classes had the same AUC. This data suggests that curated MRQy metrics could be used for automated image quality analysis and artifact detection.Conclusion
The use of classification models utilizing quantitative metrics to predict radiologist interpretations has the potential to expedite the quality control and assurance protocols currently used and ensure sufficient image quality required for accurate diagnosis and decision-support. These models could be deployed in the clinic as automatic checks for real-time image acquisition to prevent patient re-scanning retrospective radiologist analysis or improve reader confidence in the study. Another motivating application of these models would be to compare and optimize MRI protocols purely quantitatively without the need for intensive radiological assessment, enabling the evaluation to be done at a larger scale and in resource-scarce settings. Further work needs to be done to validate the model described here on an external dataset. The results presented here suggest that MRQy could be used as a foundation for quantitative metrics as a surrogate for radiologist assessment.Acknowledgements
This work was supported by the Tumor Measurement Initiative through the MD Anderson Strategic Initiative Development Program (STRIDE).References
1. Andre JB, Bresnahan BW, Mossa-Basha M, et al.. Toward quantifying the prevalence, severity, and cost associated with patient motion during clinical MR examinations. J Am Coll Radiol 2015; 12:689–95 10.1016/j.jacr.2015.03.00
2. Sadri AR, Janowczyk A, Zhou R, et al. Technical Note: MRQy - An open-source tool for quality control of MR imaging data. Med Phys. 2020;47(12):6029-6038. doi:10.1002/mp.14593
3. Breiman L. Bagging predictors. Machine Learning. 1996;24(2):123-140.
Figures
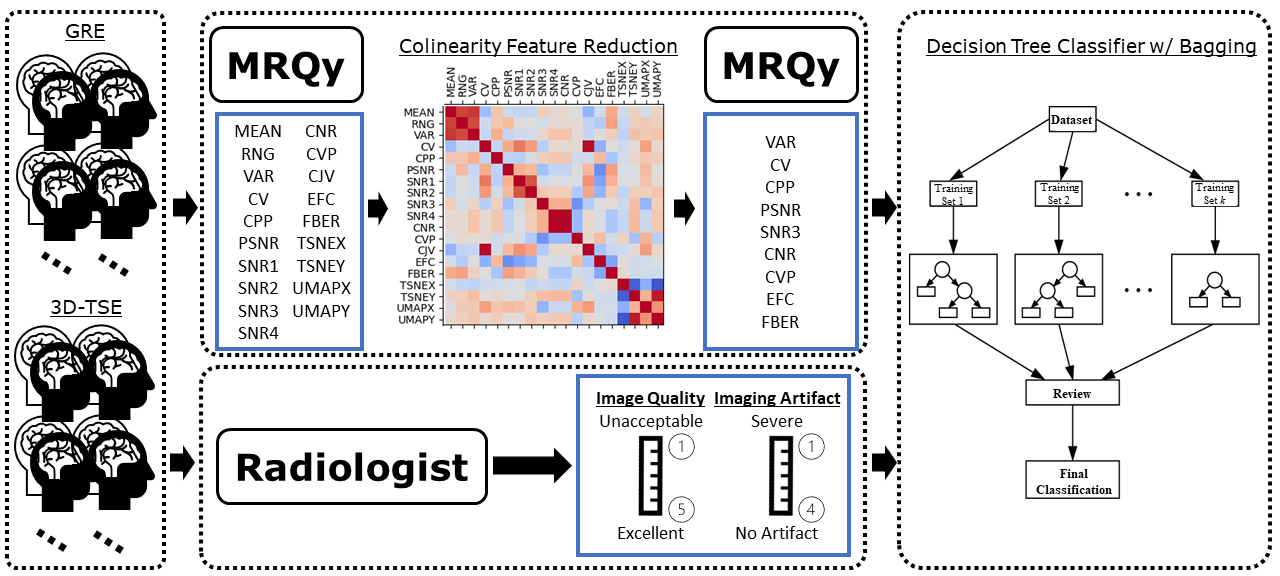
Overview of the project methods: A
collection of GRE and 3D-TSE brain scans were acquired for a set of patients.
These scans were interpreted by a group of neuro-radiologists providing image
quality and artifact scores on a Likert scale. In parallel, the MRQy tool was
run for each scan providing quantitative metrics which were reduced after using
the Pearson correlation matrix. The combined results were used to train and
test a decision tree classifier with bagging ensemble methods.
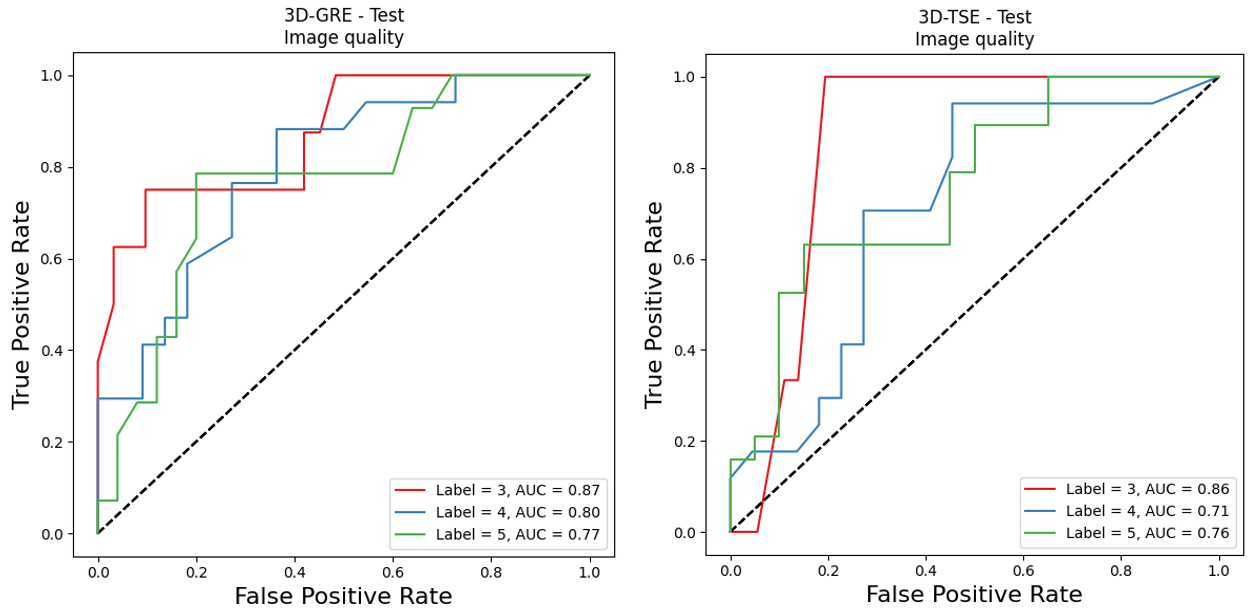
Resulting AUC on the test set for the GRE
(left) and 3D-TSE (right) image quality classification task. A trend can be
seen that the lowest image quality class (label 3, acceptable image quality)
has the highest AUC, possibly due to the presence
of more distinct quantitative features.
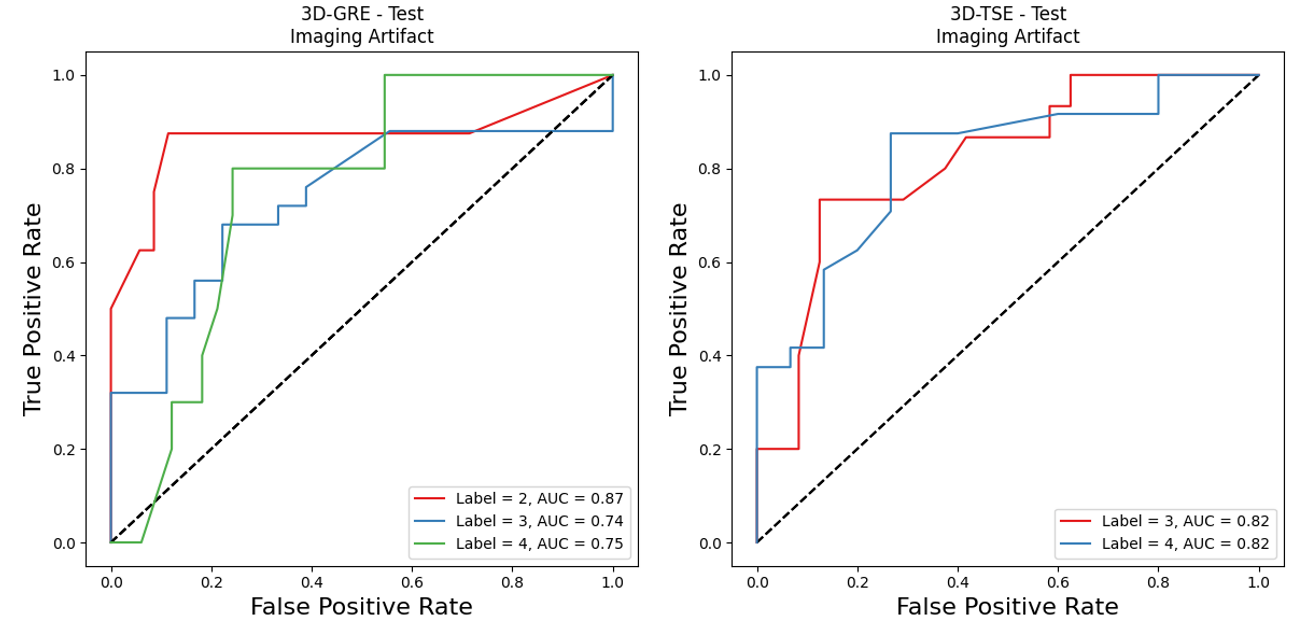
Resulting AUC on the test set for the 3D-GRE
(left) and 3D-TSE (right) imaging artifact classification task. Similarly, as
with the image quality, the lowest class (label 2, moderate artifacts) resulted
in the highest AUC, possibly due to the presence of
more distinct quantitative features.
DOI: https://doi.org/10.58530/2023/3238