3237
A Novel Deep Learning Tissue Normalization Method for Longitudinal Analysis of T2-Weighted MRI following Prostate Cancer Radiation Treatment
Ahmad Algohary1, Evangelia I. Zacharaki1, Mohammad Alhusseini1, Adrian Breto1, Veronica Wallaengen1, Isaac Xu1, Sandra Gaston1, Patricia Castillo1, Sanoj Punnen1, Benjamin Spieler1, Matthew Abramowitz1, Alan Dal Pra1, Oleksandr Kryvenko1, Alan Pollack1, and Radka Stoyanova1
1The University of Miami, Miami, FL, United States
1The University of Miami, Miami, FL, United States
Synopsis
Keywords: Machine Learning/Artificial Intelligence, Prostate
In this work, we introduce a novel automated triple-reference intensity normalization method for T2W images with the aim of obtaining consistent longitudinal measurements leading to improved quantitative assessment of radiation treatment outcome for prostate cancer patients.Target audience
Radiation Oncologists, Radiation Physicists, Imaging Scientists, and Radiologists.Objective
To implement a T2-weighted MRI normalization technique for quantitative analysis of longitudinal data following radiation therapy for prostate cancer patients.Introduction
Clinical protocols for multiparametric-MRI (mpMRI) of the prostate do not include sequences for the "natural" or "true" T2 estimation. Instead, the utilized T2-weighted (T2W) sequence is usually subject to significant variations due to MRI instruments and coils used. In this work, we introduce a novel automated triple-reference intensity normalization method for T2W images with the aim of obtaining consistent longitudinal measurements leading to improved quantitative assessment of radiation treatment outcome for prostate cancer patients.Materials and Methods
The overall procedure is illustrated in Figure 1. It consists of: (i) Training of a Deep Learning (DL) network (using Dataset 1) to automatically segment three structures on the T2W images of the pelvis; (ii) Evaluation of the proposed normalization technique on an independent testing dataset (Dataset 2); and finally (iii) Applying this normalization technique on longitudinal data from radiation treatment (RT) clinical trial (Dataset 3) [1]. For the first step, a dual-stage MASK R-CNN DL classifier [2,3] was trained to automatically segment three reference structures, namely the femur, bladder, and the gluteus maximus (GM) muscle in a multi-step methodology. This network was trained to detect these individual structures on the T2W images and generate corresponding masks with an assigned class to each segmented object (Figure 2a). The mean intensities of the segmented regions were then calculated and used in a linear fit against reference values in the three corresponding tissues (Figure 2b). The reference values for femur, bladder and GM muscle were estimated as averages from a large reference cohort of patients. This normalization procedure was tested on an independent 78-patient dataset from 2 randomized clinical trials (ClinicalTrials.gov: NCT02242773 and NCT02307058) and assessed in respect to correlation with Gleason Score. Finally, the procedure was subsequently validated on longitudinal data from a RT clinical trial (ClinicalTrials.gov: NCT01411319).Results
In total, 182 mpMRI exams from 99 patients were analyzed. The average T2W intensities in the bladder, femur and GM from the automatically segmented structures were strongly correlated with manual contours in the testing dataset (R = 0.97 for bladder and GM and R = 0.98 for femur). In the same dataset, after T2W normalization, the T2W values expressed a more compact distribution and a significant negative Spearman correlation with Gleason scores (p-value = 0.003) (Figure 3). For the validation dataset (99 exams from 21 patients), normalization improved the differentiation between gross tumor volumes (GTV) versus naturally-appearing tissue within the peripheral (NAT-PZ) and transitional (NAT-TZ) zones of the prostate (Figure 4).Conclusion
An automated triple-reference tissue normalization method was developed. This method successfully reduced the inter-scan intensity variation on T2W MR images of the prostate due to artifacts caused by different scanning conditions and magnets. It also improved the discrimination between tumors and normal tissue. In addition, it exhibited significant Gleason score-based risk stratification power and consequently improved the quantitative assessment of prostate cancer on MRI.Acknowledgements
This research was funded by National Cancer Institute of the National Institutes of Health. Award Numbers are P30CA240139, RO1CA189295, R01CA190105 and U01CA239141. The content is solely the responsibility of the authors and does not necessarily represent the official views of the National Institutes of Health.References
1. Algohary A, Alhusseini M, Breto AL, Kwon D, Xu IR, Gaston SM, Castillo P, Punnen S, Spieler B, Abramowitz MC, Dal Pra A, Kryvenko ON, Pollack A, Stoyanova R. Longitudinal Changes and Predictive Value of Multiparametric MRI Features for Prostate Cancer Patients Treated with MRI-Guided Lattice Extreme Ablative Dose (LEAD) Boost Radiotherapy. Cancers (Basel). 2022 Sep 15;14(18):4475. doi: 10.3390/cancers14184475. 2. Breto AL, Spieler B, Zavala-Romero O, Alhusseini M, Patel NV, Asher DA, Xu IR, Baikovitz JB, Mellon EA, Ford JC, Stoyanova R, Portelance L. “Deep Learning for Per-Fraction Automatic Segmentation of Gross Tumor Volume (GTV) and Organs at Risk (OARs) in Adaptive Radiotherapy of Cervical Cancer”. Front Oncol. 2022 May 18;12:854349. doi: 10.3389/fonc.2022.854349. 3. He K, Gkioxari G, Dollar P, Girshick R. Mask R-CNN. IEEE Trans Pattern Anal Mach Intell (2020) 42:386–97. doi: 10.1109/TPAMI.2018.2844175.Figures
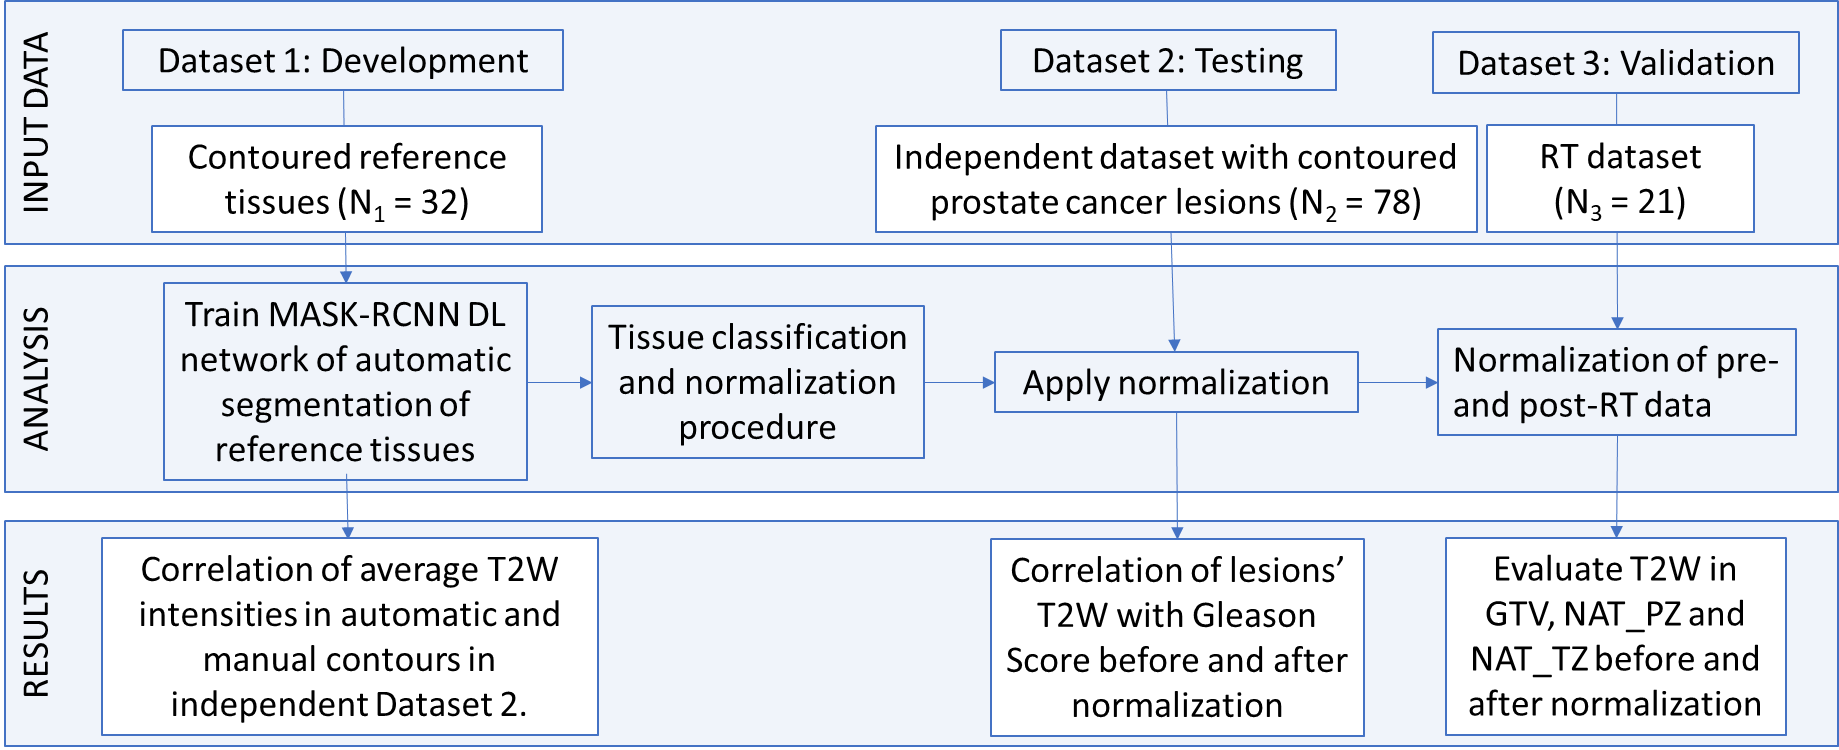
Figure 1: Procedure for training, testing, and validation of deep learning MASK
R-CNN classifier.
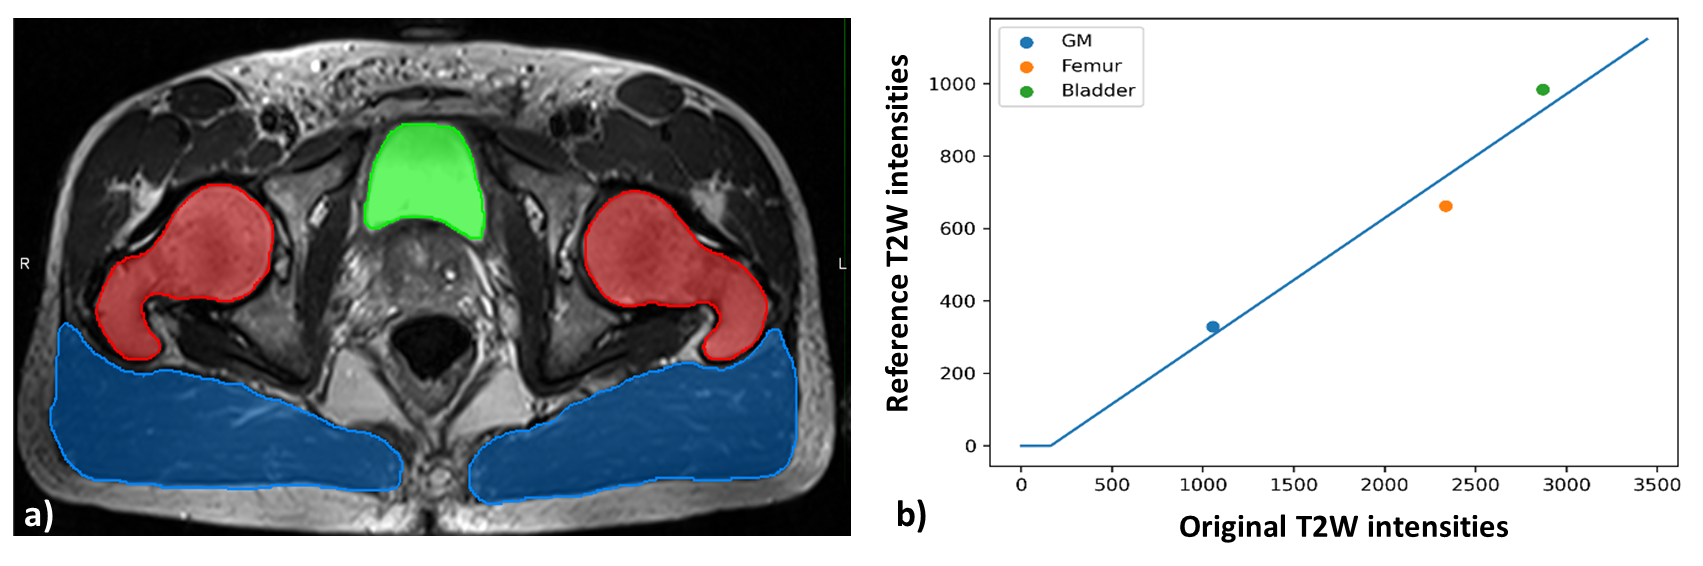
Figure 2: a) Example output of automatic segmentation for femur (red),
bladder (green), and gluteus maximus muscle (blue) from our MASK R-CNN deep
learning classifier along with the corresponding linearly fitted model. b) Fitted
T2w intensities versus reference values for our triple-structure model.
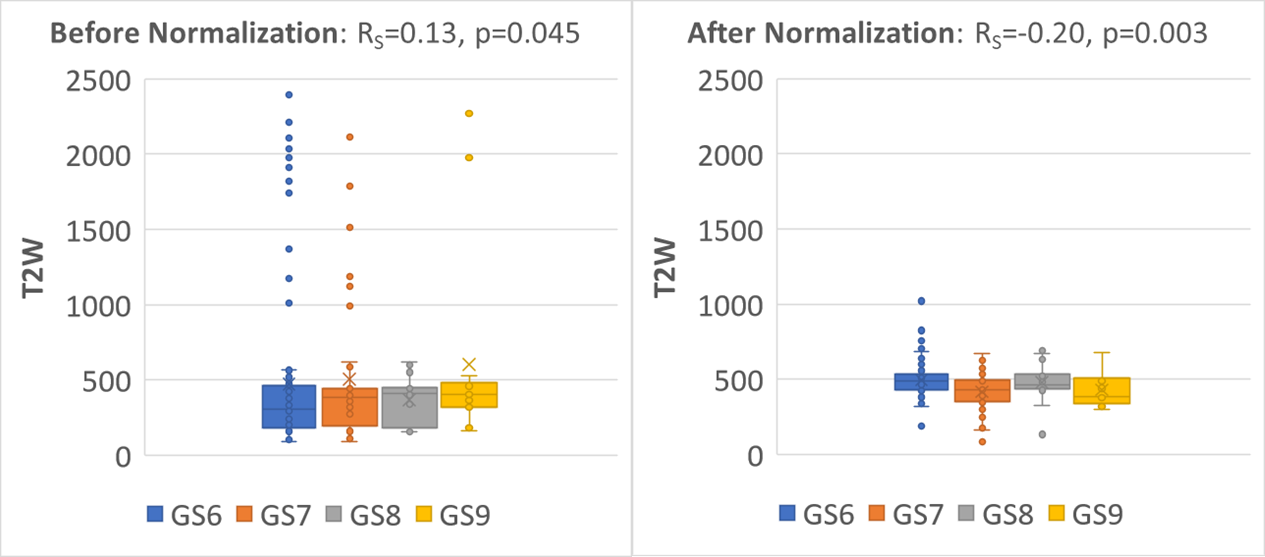
Figure 3: T2W intensity
distribution before normalization (left) and after normalization (right) for
increasing Gleason score (GS). Spearman correlation with Gleason score changes
from positive (RS = 0.13) to negative (RS = -0.20) after
normalization and becomes more significant.
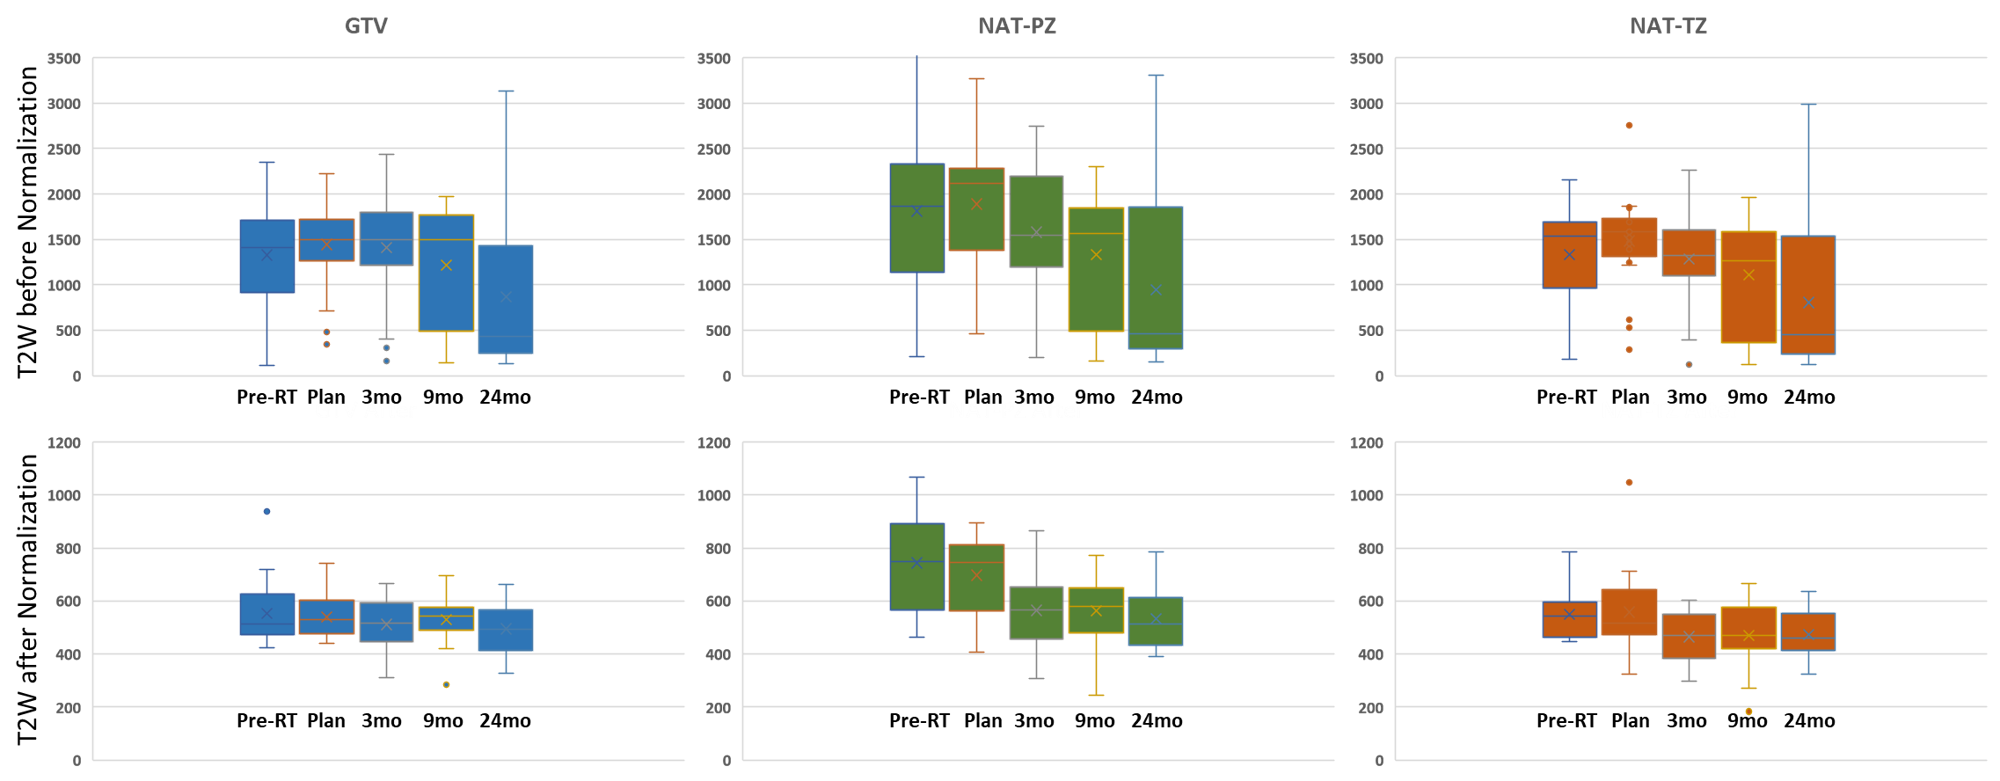
Figure 4: Box and whisker
plots for T2W imaging intensities within gross tumor volumes before and after
normalization across the RT trial timeline (pre-RT and post-RT).
DOI: https://doi.org/10.58530/2023/3237