3236
Dual-site and dual-vendor comparison of cerebral oxygen extraction fraction by ASE and TRUST MRI in identical participants1Mallinckrodt Institute of Radiology, Washington University School of Medicine, St Louis, MO, United States, 2Department of Neurology, Vanderbilt University Medical Center, Nashville, TN, United States, 3Department of Neurology, Washington University School of Medicine, St Louis, MO, United States, 4Department of Pediatrics, Vanderbilt University Medical Center, Nashville, TN, United States, 5Department of Radiology, Johns Hopkins University School of Medicine, Baltimore, MD, United States
Synopsis
Keywords: Data Analysis, Brain, repeatability; reproducibility
We evaluated dual-site and dual-vendor test-retest repeatability and reproducibility of cerebral oxygen extraction fraction (OEF) measured with asymmetric spin echo (ASE) and T2-Relaxation-Under-Spin-Tagging (TRUST) MRI. The intra-site intra-class correlation coefficient (ICC) of global ASE-OEF were 0.952 and 0.919 for each site. The intra-site ICC of TRUST-OEF based on the bovine and the HbA model were 0.810 and 0.792 at site 1, and 0.928 and 0.924 at site 2. The inter-site inter-vendor correlation was 0.849 for ASE-OEF and 0.814 for TRUST-OEF based on the bovine model. ASE-OEF was significantly associated with TRUST-OEF (p<0.001).Introduction
Cerebral oxygen extraction fraction (OEF) reflects the ratio of oxygen consumed to oxygen delivered and has been shown to have sensitivity to treatment selection(1) and response(2,3) in patients with cerebrovascular and hematological diseases. OEF can be assessed non-invasively in vivo regionally using an asymmetric spin echo (ASE) sequence(4) and globally using T2-relaxation-under-spin-tagging (TRUST) MRI(5,6). Using ASE or TRUST MRI, altered OEF has been observed in patients with various neurological diseases, including cerebral small vessel disease and sickle cell disease(7-9). ASE and TRUST MRI are promising MRI sequences for clinical studies of treatment efficacy. Unlike anatomical imaging markers such as infarct progression or tissue atrophy, OEF may respond acutely to emerging treatments. However, these techniques have not been compared in the same participants to establish the test-rest repeatability, reproducibility, and potential sequence bias across sites and vendors. To address this limitation, we evaluated the test-retest repeatability and reproducibility of OEF measured with ASE and TRUST MRI at two sites using MRI scanners from two different vendors in a traveling cohort study with healthy participants.Methods
Healthy participants with no history of cerebrovascular disease (n=20; median [interquartile range] age: 29 [26,32] years; 10 female) provided informed consent and were recruited at two sites in North America. All participants underwent an MR scan session on a Siemens Prisma 3T scanner at site 1 and another MR scan session on a Philips Ingenia 3T scanner at site 2 with four days (interquartile range: [3,5.2] days) in between. The order of scanning was randomized across participants. 32-channel head coil reception and body coil transmission were used at both sites. Each scan session comprised one T1w MPRAGE scan, two ASE scans (TE1/TE2/TR=64/107/4400ms; ΔTE=0ms to 40ms for TE1; Voxel size=1.72x1.72x3mm; acquisition time=3:09min) and two TRUST scans (TE/TR=3.9/2000ms; Voxel size=3.4x3.4x5.0mm; acquisition time=58sec). T1w images were segmented using SPM12. Voxel-wise OEF maps were estimated from ASE MRI(10) using a susceptibility difference between fully-oxygenated and deoxygenated blood (Δχ0) of 0.19ppm measured from human HbA(11). Global ASE-OEF was computed by averaging voxel-wise OEF in brain tissues. TRUST MRI was processed as described previously to obtain T2 in the superior sagittal sinus (SSS) approximately 20mm above the torcula, thereby providing an estimate of global supratentorial OEF(5,6). The T2 in the sinus was converted to Yv using T2-Y calibration models derived using either bovine blood (bovine model)(12) or healthy human blood (HbA model)(13), respectively. The global TRUST-OEF was computed as 1-Yv.Intra-site repeatability of ASE-OEF and TRUST-OEF was evaluated using the intra-class correlation coefficient (ICC). Inter-site inter-vendor reproducibility of global ASE-OEF and TRUST-OEF was evaluated using Pearson's r. The association between ASE-OEF and TRUST-OEF was investigated using Pearson's r. The significance level was 0.05. The differences among various measurements were examined using the Bland-Altman plot.
Results
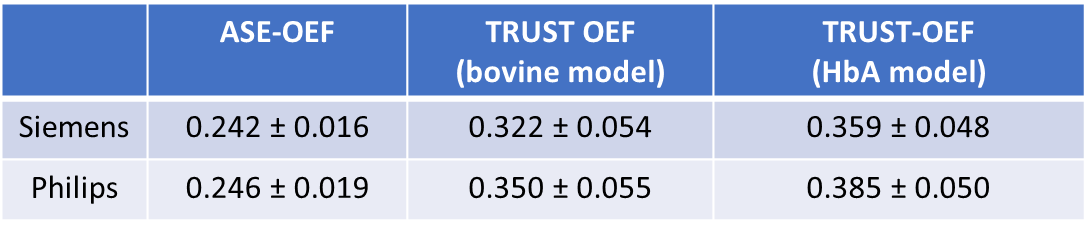
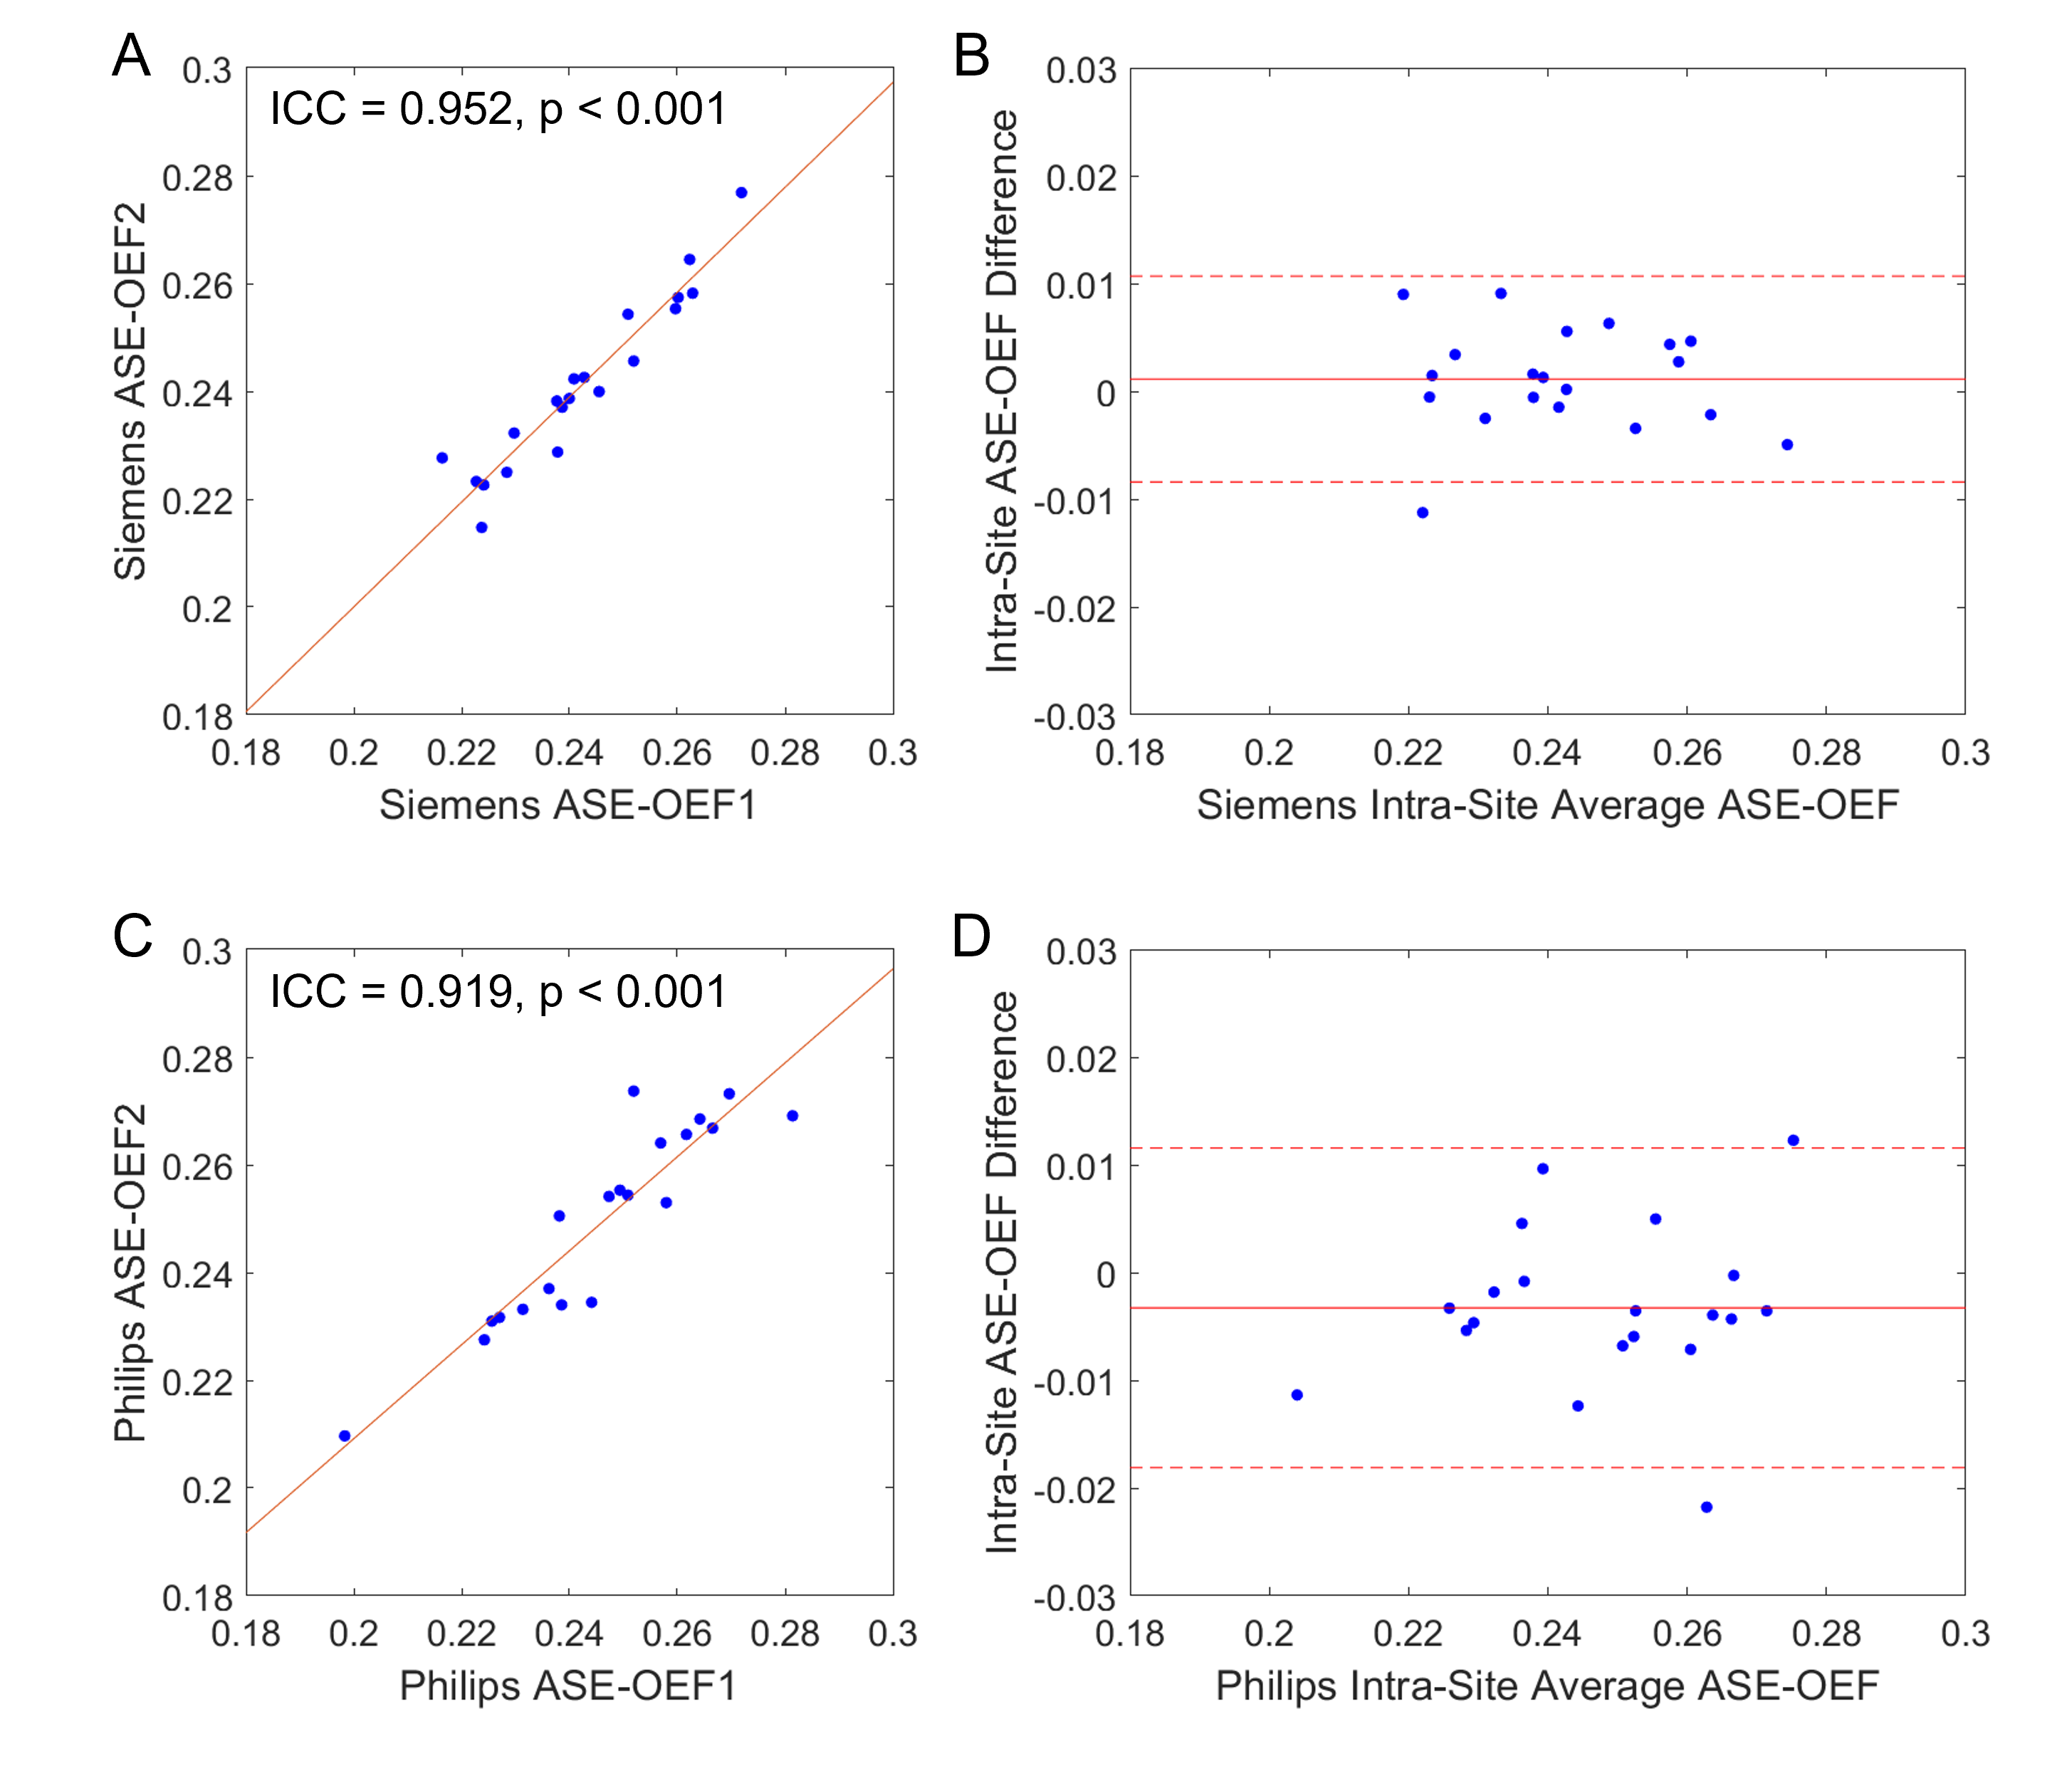
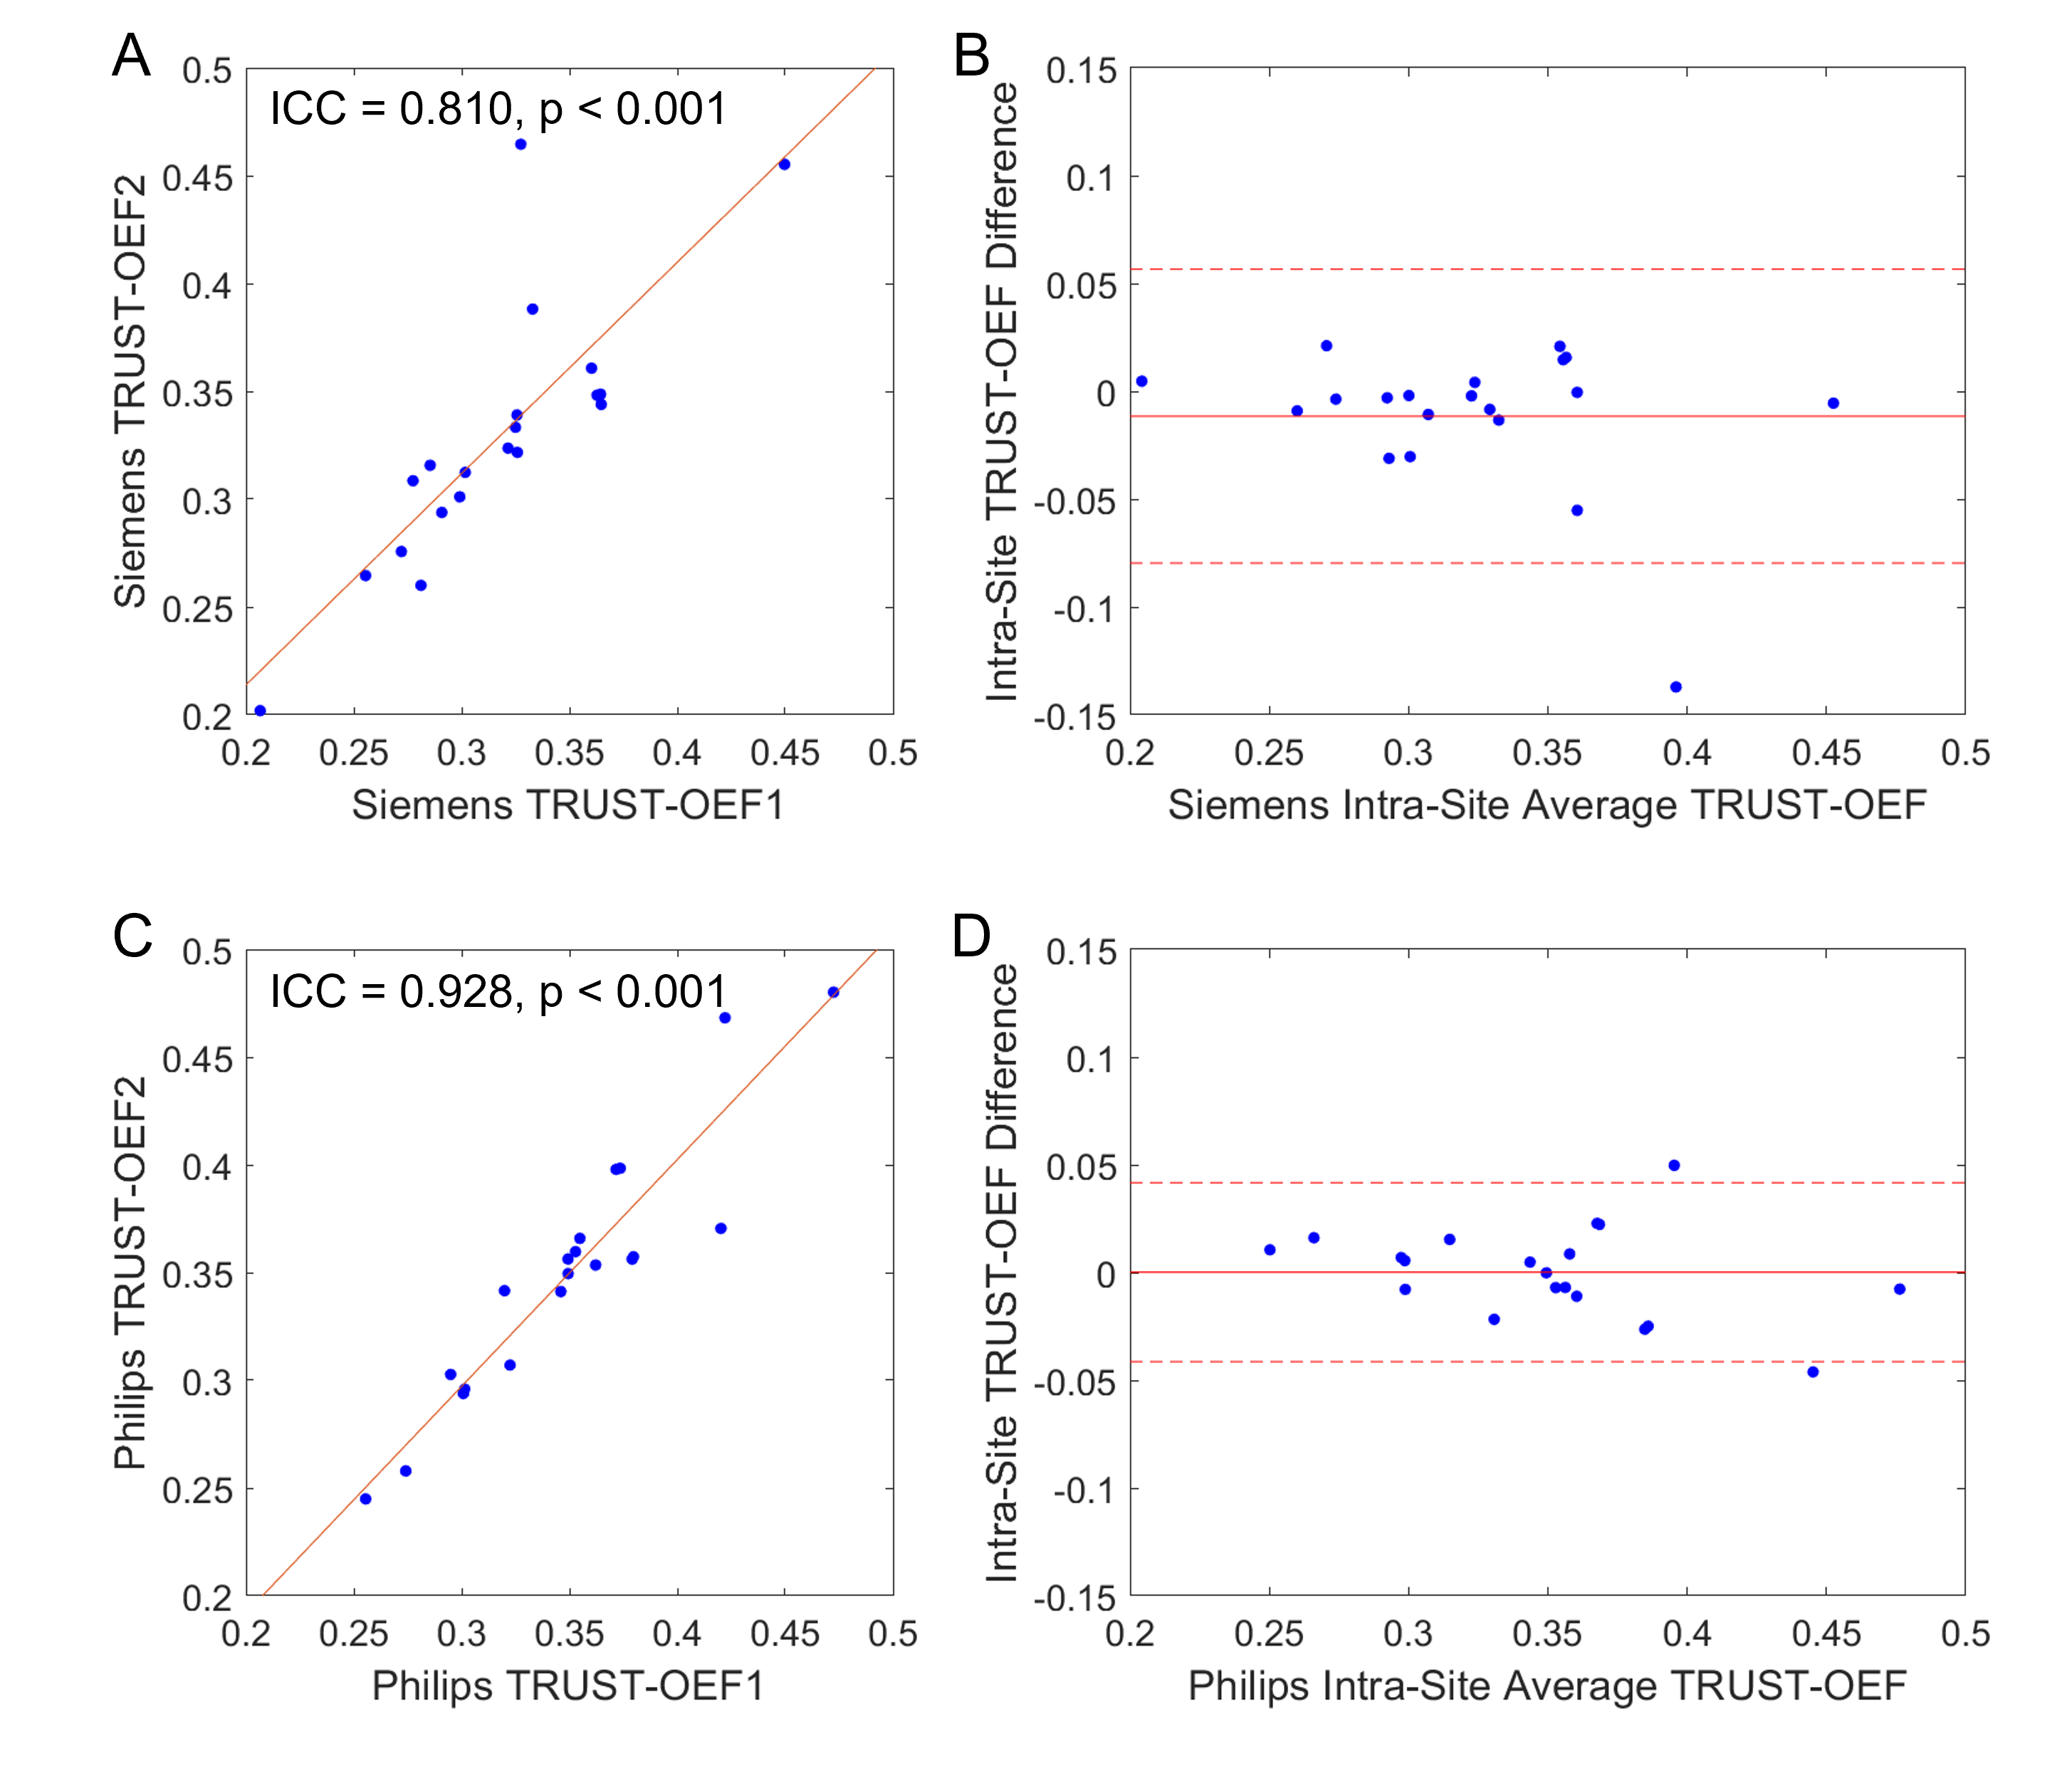
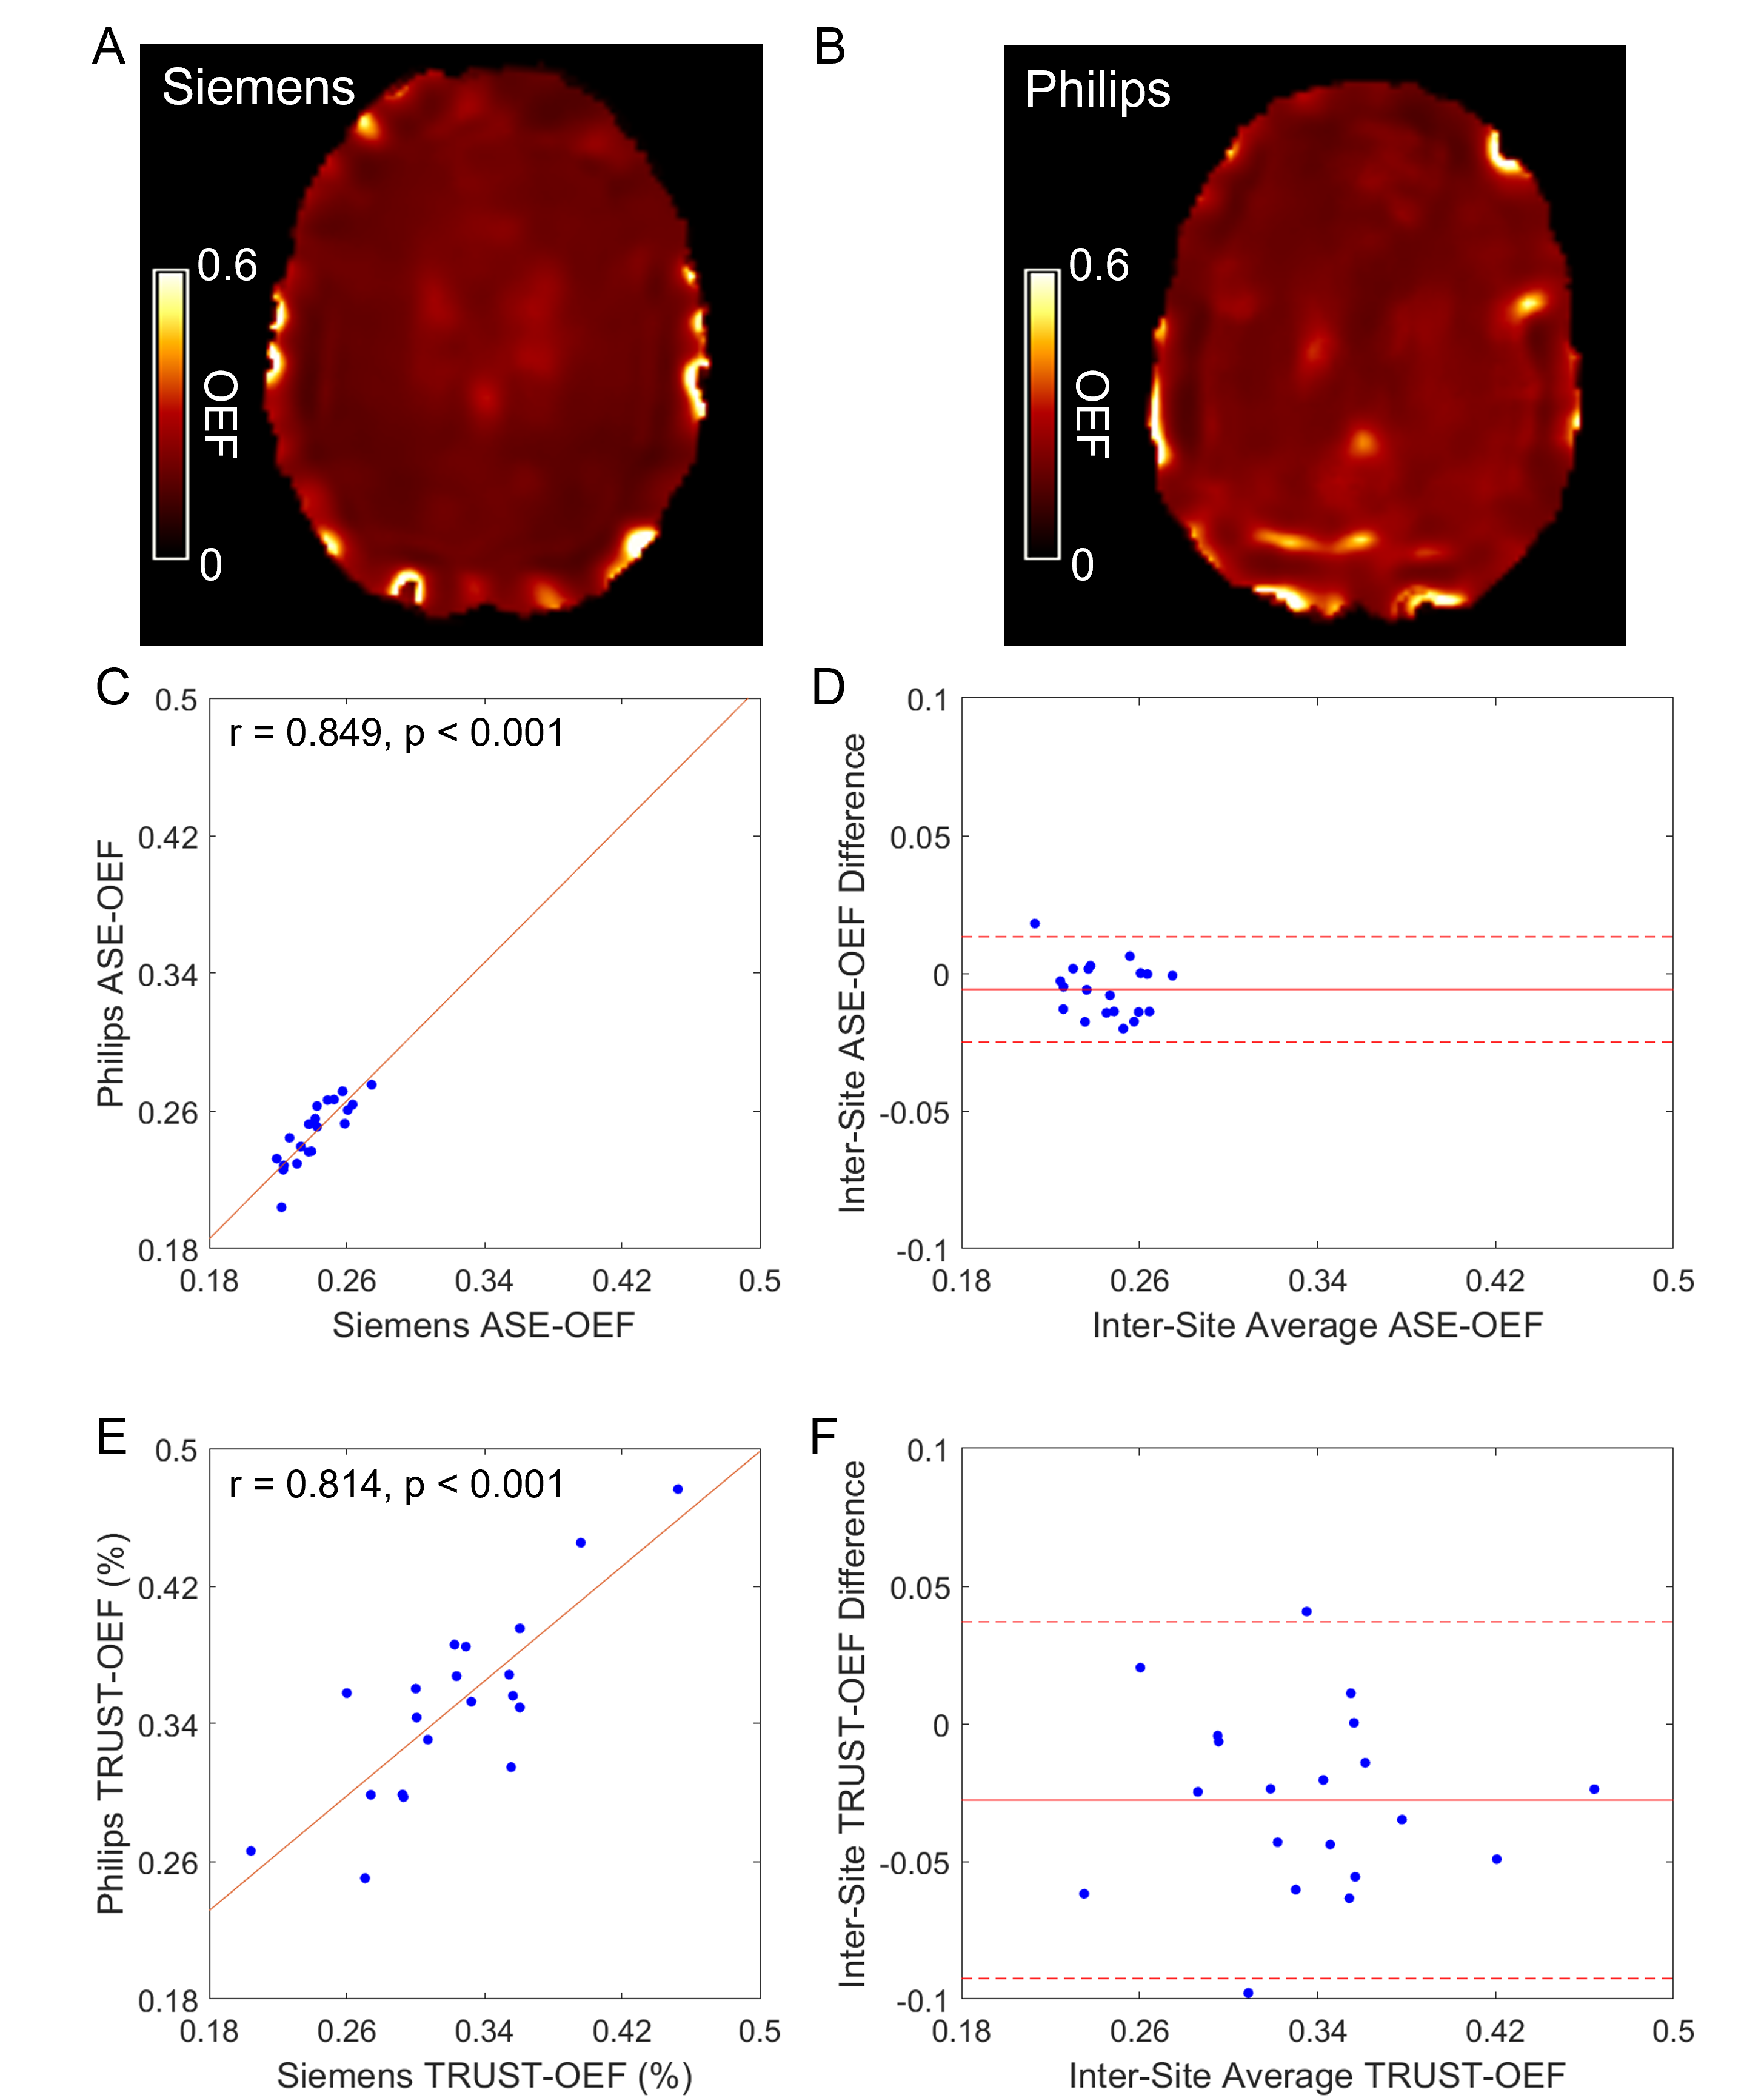
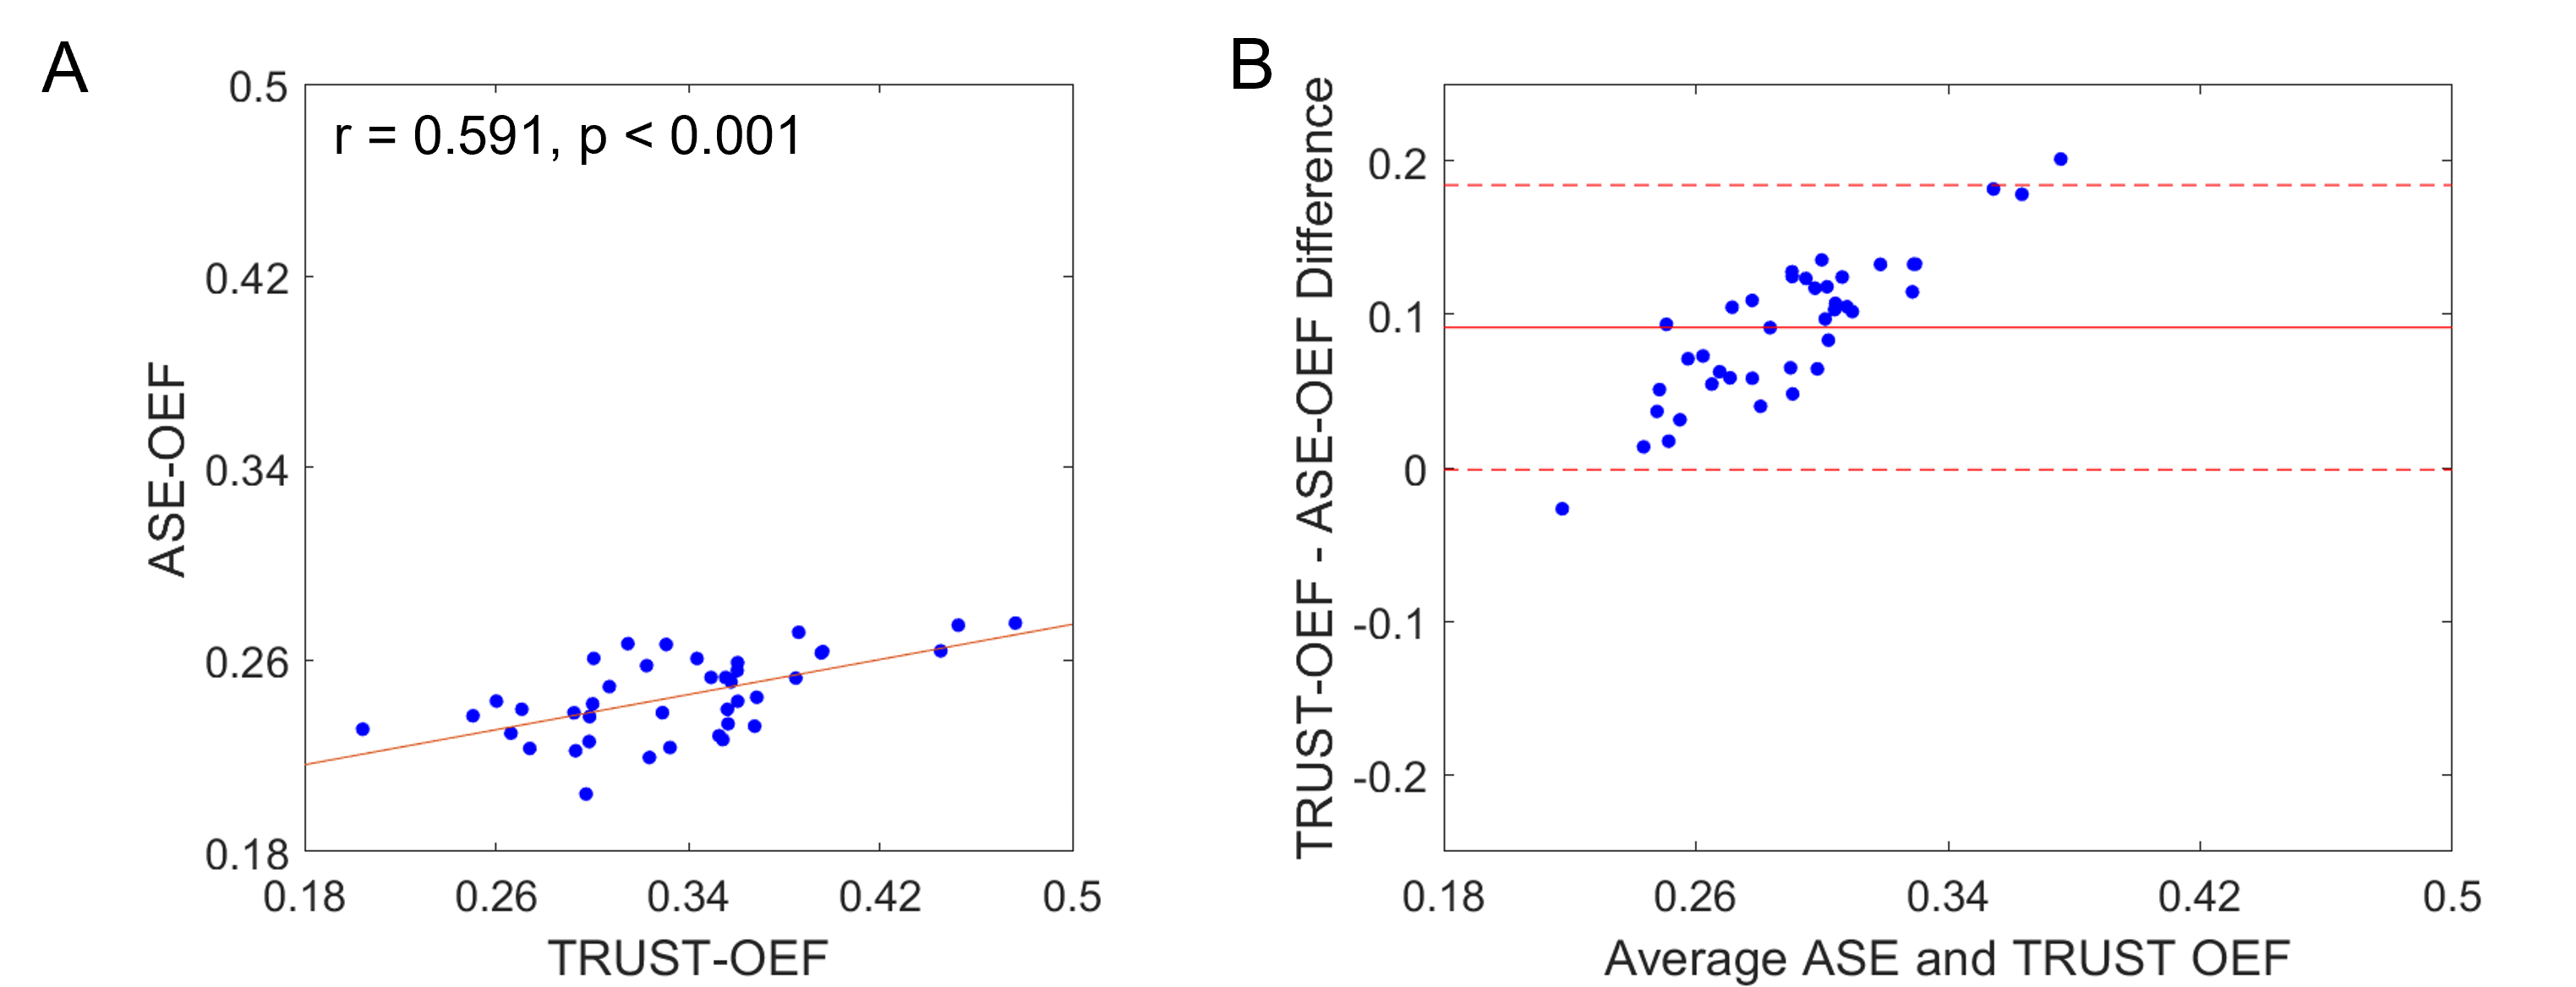
The ASE-OEF and TRUST-OEF based on the bovine and the HbA models are summarized in Table 1. The intra-site ICCs of ASE-OEF were 0.952 (P<0.001) and 0.919 (P<0.001) at site 1 and site 2, respectively (Figure 1A,C). The intra-site ICCs of TRUST-OEF based on the bovine model were 0.810 (P<0.001) and 0.928 (P<0.001) at site 1 and site 2, respectively (Figure 2A,C). The intra-site ICC of TRUST-OEF based on the HbA model was 0.792 (P<0.001) and 0.924 (P<0.001) at site 1 and site 2, respectively. Moreover, both ASE-OEF and TRUST-OEF had intra-site differences close to zero (Figure 1B,D; Figure 2B,D). The inter-site inter-vendor reproducibility of ASE-OEF and TRUST-OEF are shown in Figure 3. Figures 3A and 3B demonstrate OEF maps from a representative participant acquired at site 1 and site 2, respectively. The inter-site, inter-vendor correlation of ASE-OEF was 0.849 (P<0.001; Figure 3C). The inter-site, inter-vendor correlation of TRUST-OEF based on the bovine model was 0.814 (P<0.001; Figure 3E). The inter-site, inter-vendor correlation of TRUST-OEF based on the HbA model was 0.806 (P<0.001). ASE-OEF was associated with TRUST-OEF based on the bovine model (r=0.591, P<0.001; Figure 4) and the HbA model (r=0.562, P<0.001), respectively.Discussion
Both ASE-OEF and TRUST-OEF had excellent intra-site test-retest repeatability and inter-site inter-vendor reproducibility. Our two-site and two-vendor TRUST-OEF reproducibility corroborates with the previous two-vendor single-site(14) and multi-site single-vendor(15) findings, and extends these findings by including well-characterized participants with imaging acquired on both platforms.ASE-OEF was strongly associated with TRUST-OEF but had lower values (Table1, Figure 4B). Of note, ASE and TRUST estimate OEF using two distinct approaches. Assuming a static dephasing regime, ASE is an R2'-based method that measures regional tissue-level OEF through a qBOLD model(16). The difference in Δχ0 has a global scaling effect on ASE-OEF. The non-blood background susceptibility or diffusion effects may lead to lower ASE-OEF values. On the other hand, TRUST measures T2 in SSS and converts T2 to Yv using a T2-Y calibration model. Nevertheless, ASE-OEF was strongly associated with either TRUST-OEF based on the bovine model or the HbA model in healthy participants.
Conclusion
We evaluated the test-retest repeatability and reproducibility of OEF measured with ASE and TRUST MRI in a dual-site and dual-vendor setting. Both ASE and TRUST had excellent intra-site repeatability and inter-site inter-vendor reproducibility in healthy participants. We also found a strong association between tissue-level OEF measured with ASE MRI and global OEF measured with TRUST MRI.Acknowledgements
This study was supported by NIH R01NS082561, RF1 NS116565, R01 HL129241, NIH/NINDS 1R01NS123281, NIH/NHLBI 1R01HL155207, and Pfizer.References
1. Grubb RL, PoWeRs WJ, CLaRke WR, Videen TO, Adams HP, Derdeyn CP. Surgical results of the carotid occlusion surgery study. Journal of neurosurgery 2013;118(1):25-33.
2. Juttukonda MR, Lee CA, Patel NJ, Davis LT, Waddle SL, Gindville MC, Pruthi S, Kassim AA, DeBaun MR, Donahue MJ. Differential cerebral hemometabolic responses to blood transfusions in adults and children with sickle cell anemia. Journal of Magnetic Resonance Imaging 2019;49(2):466-477.
3. Fields ME, Guilliams KP, Ragan D, Binkley MM, Mirro A, Fellah S, Hulbert ML, Blinder M, Eldeniz C, Vo K. Hydroxyurea reduces cerebral metabolic stress in patients with sickle cell anemia. Blood, The Journal of the American Society of Hematology 2019;133(22):2436-2444.
4. An H, Lin W. Impact of intravascular signal on quantitative measures of cerebral oxygen extraction and blood volume under normo‐and hypercapnic conditions using an asymmetric spin echo approach. Magnetic Resonance in Medicine: An Official Journal of the International Society for Magnetic Resonance in Medicine 2003;50(4):708-716.
5. Xu F, Uh J, Liu P, Lu H. On improving the speed and reliability of T2-relaxation-under-spin-tagging (TRUST) MRI. Magn Reson Med 2012;68(1):198-204.
6. Lu H, Ge Y. Quantitative evaluation of oxygenation in venous vessels using T2-Relaxation-Under-Spin-Tagging MRI. Magn Reson Med 2008;60(2):357-363.
7. Kang P, Ying C, Chen Y, Ford AL, An H, Lee JM. Oxygen Metabolic Stress and White Matter Injury in Patients With Cerebral Small Vessel Disease. Stroke 2022;53(5):1570-1579.
8. Fields ME, Guilliams KP, Ragan DK, Binkley MM, Eldeniz C, Chen Y, Hulbert ML, McKinstry RC, Shimony JS, Vo KD, Doctor A, An H, Ford AL, Lee JM. Regional oxygen extraction predicts border zone vulnerability to stroke in sickle cell disease. Neurology 2018;90(13):e1134-e1142.
9. Jordan LC, Gindville MC, Scott AO, Juttukonda MR, Strother MK, Kassim AA, Chen S-C, Lu H, Pruthi S, Shyr Y. Non-invasive imaging of oxygen extraction fraction in adults with sickle cell anaemia. Brain 2016;139(3):738-750.
10. An H, Lin W. Impact of intravascular signal on quantitative measures of cerebral oxygen extraction and blood volume under normo- and hypercapnic conditions using an asymmetric spin echo approach. Magn Reson Med 2003;50(4):708-716.
11. Eldeniz C, Binkley MM, Fields M, Guilliams K, Ragan DK, Chen YS, Lee JM, Ford AL, An HY. Bulk volume susceptibility difference between deoxyhemoglobin and oxyhemoglobin for HbA and HbS: A comparative study. Magnetic Resonance in Medicine 2021;85(6):3383-3393.
12. Lu H, Xu F, Grgac K, Liu P, Qin Q, van Zijl P. Calibration and validation of TRUST MRI for the estimation of cerebral blood oxygenation. Magn Reson Med 2012;67(1):42-49.
13. Bush A, Borzage M, Detterich J, Kato RM, Meiselman HJ, Coates T, Wood JC. Empirical model of human blood transverse relaxation at 3 T improves MRI T2 oximetry. Magn Reson Med 2017;77(6):2364-2371.
14. Jiang D, Liu P, Li Y, Mao D, Xu C, Lu H. Cross-vendor harmonization of T2 -relaxation-under-spin-tagging (TRUST) MRI for the assessment of cerebral venous oxygenation. Magn Reson Med 2018;80(3):1125-1131.
15. Liu P, Dimitrov I, Andrews T, Crane DE, Dariotis JK, Desmond J, Dumas J, Gilbert G, Kumar A, Maclntosh BJ. Multisite evaluations of a T 2‐relaxation‐under‐spin‐tagging (TRUST) MRI technique to measure brain oxygenation. Magnetic resonance in medicine 2016;75(2):680-687.
16. Yablonskiy DA, Haacke EM. Theory of NMR signal behavior in magnetically inhomogeneous tissues: the static dephasing regime. Magnetic resonance in medicine 1994;32(6):749-763.
Figures