3231
The Effect of RF Pulse Duration Settings in Basis Sets on Sensitivity and Specificity of 2HG Spectroscopy1BWH, Boston, MA, United States, 2Vaderbilt University Institute of Imaging Science, Nashville, TN, United States
Synopsis
Keywords: Tumors, Spectroscopy, 2HG detection
2HG is the specific biomarker for the IDH mutation in tumors. In this study, we utilized two different 2HG basis sets, one using a 4.8ms refocusing pulse duration and another with 5.8ms. Using the two different basis sets, we analyzed the same data and found large differences in the sensitivity and specificity results.2-hydroxyglutarate (2HG) is the specific biomarker for the isocitrate dehydrogenase (IDH) mutations in brain tumors1-3 and has become of great interest to neuro-oncologists and neurosurgeons to provide a non-invasive method of assessing tumor status. However, the detection of 2HG is challenging due to overlap with neighboring metabolites such as glutamate, glutamine, and gamma amino butyric acid as well as its relatively low concentration. The use of a longer echo time (97ms) helps to isolate the C4 proton resonances of 2HG at 2.25 ppm1. In order to quantify the metabolite, studies have largely utilized LCmodel4 to measure 2HG concentrations. It has been previously shown that factors such as RF pulse profiles utilized when creating the LCmodel basis sets can significantly change the quantitation of metabolites5 however, the impact on clinical diagnosis has not been shown. The goal of this study is to demonstrate how a very small change in the construction of the basis set can have significant impacts on the diagnostic use of MR spectroscopy, specifically in the detection of 2HG in brain tumor patients.
Methods
This is a retrospective study of 307 consecutive patients referred for 2HG spectroscopy for a total of 1165 scans. All scans are acquired using either Skyra and Prisma 3T MR systems (Siemens Healthcare, Erlangen, Germany) with 20, 32, or 64 channel T/Rx head coils. Single voxel PRESS sequence was acquired in each patient using: TR: 2000 and TE1/TE2: 17/80 ms for a total of 97 ms. Refocusing pulse duration = 5.8ms, FA: 180. The refocusing BW: 990Hz. Most of the scans used a 8cc voxel size with 128 averages. Data are extracted from the scanner console in the TWIX format, which contains individual free induction decays for every channel and repetition. The data was pre-processed using OpenMRSLab. First, the weightings for channel combination (Cc) are calculated using singular value decomposition to maximize SNR. For this calculation, the water reference acquisition is used in preference to the main acquisition because of its relatively high SNR. This is followed by frequency correction (Fc) which starts by assigning a reference spectrum (usually the first in the series) and then tries to make each subsequent spectrum as similar as possible to that reference. It uses a minimization algorithm to test different frequency shifts and identify the one that gives the smallest difference between the two spectra. Finally, eddy current correction (Ecc) is also applied. This results in four different pipelines with each of the three correction methods and then one that utilizes all three methods (FcEcc).
The 2HG basis set was developed by calculating the effects of the volume-localized radiofrequency pulses to allow for spectral fitting of the following metabolites: 2HG, Cr, PCr, GPC, PCh, NAA, NAAG, lactate, Ala, Glu, Gly, mI, sI, and Gln. Those are optimized for detecting ~2.25ppm C4-proton resonances from 2HG molecule. The first basis set was simulated by using 4.8ms refocusing pulse duration, while the second basis set was obtained by setting 5.8ms duration.
In PRESS sequence, we used 5.8ms refocusing pulse duration. To measure the sensitivity and specificity, unknown IDH mutation status subjects’ scans were excluded from the analysis. We analyzed 2HG MRS spectrum with LC Model(6.3-1M)[4]. All four pipeline spectrums were included in the analysis. To exclude the false values from the poor-quality spectrums, only the spectrums which satisfy the following criteria were analyzed. [ FWHM <= 0.075 ppm, SNR >= 10, Lipid <= 5 mM ]. To calculate sensitivity and specificity, 2HG >= 1mM was set for the cut-off value.
Results
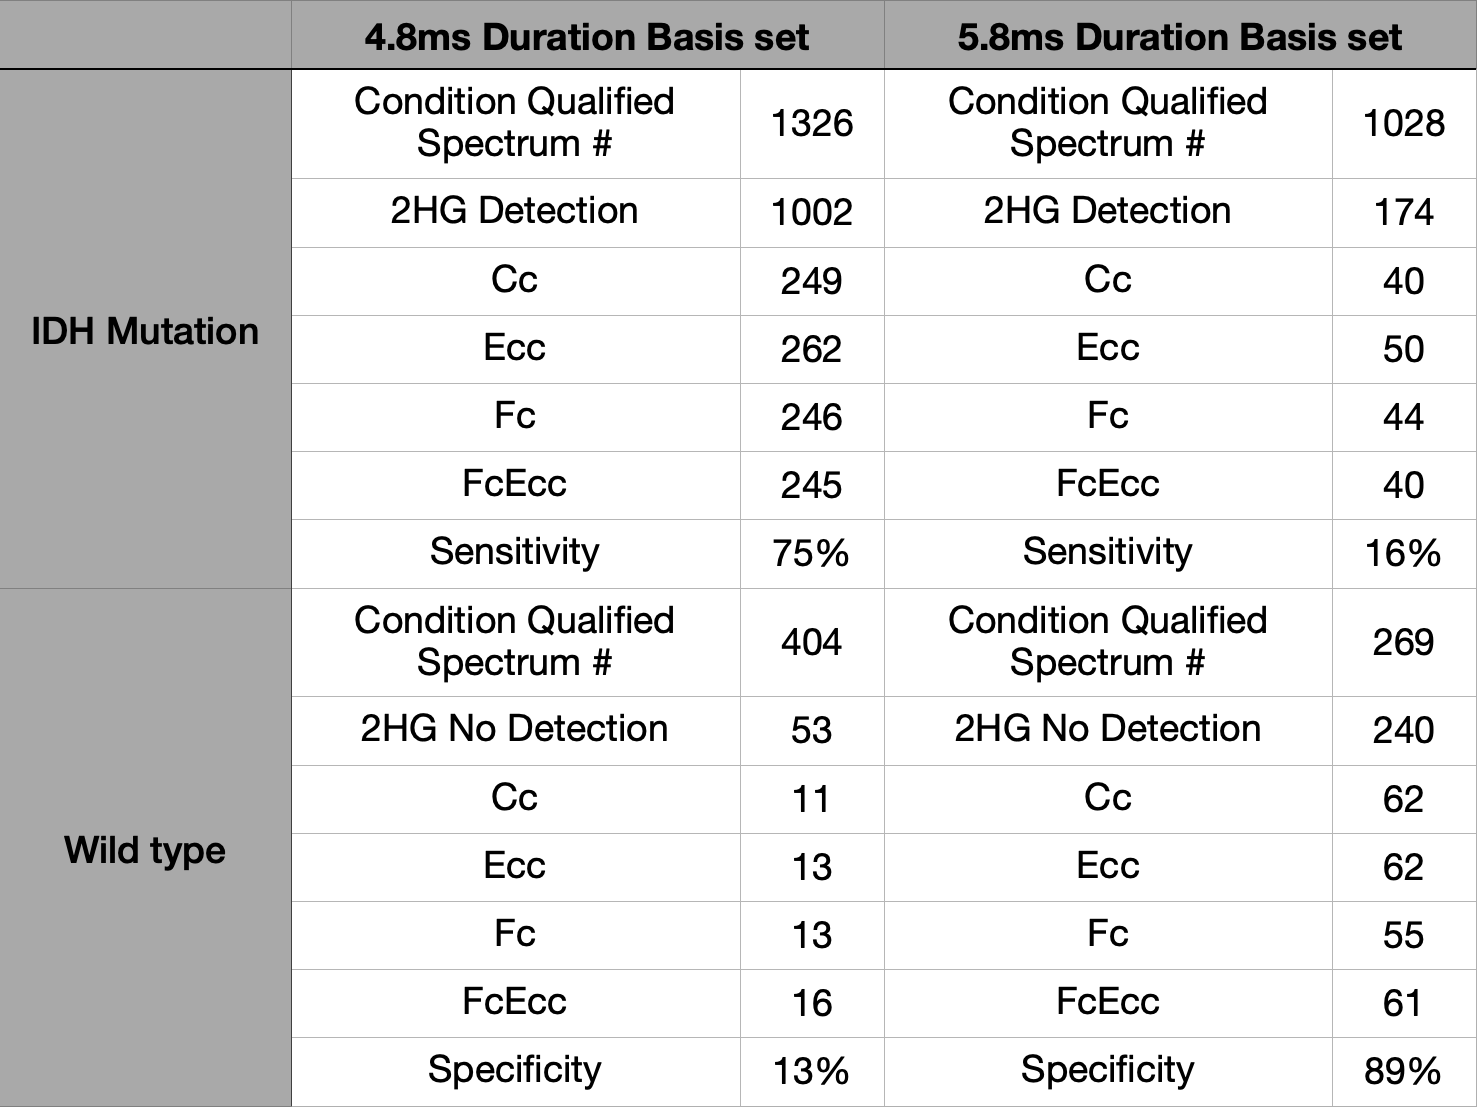
The basis set that used the 4.8ms refocusing pulse simulation results is shown in Table. In IDH mutation subjects, 1326 spectrums qualified cut-off criteria and 1002 spectrums detected 2HG which provides 75% of sensitivity. In IDH wildtype subjects, 404 spectrums qualified cut-off criteria and 52 spectrums do not detect 2HG which provides specificity of 13%.
The basis set with 5.8ms refocusing pulse simulation results (Table). In IDH mutation subjects, 1028 spectrums qualified cut-off criteria and 174 spectrums detected 2HG which provides 16% of sensitivity. In IDH wildtype subjects, 269 spectrums qualified cut-off criteria and 240 spectrums do not detect 2HG which provides 89% of specificity.
Discussion
Our result was processed with normal LC Model parameter settings. When we compare the two different basis set, metabolite number differences can be a major source of the difference. To reduce those effects, baseline splining can be restricted using the Hidden Control Parameter setting with ‘DKNTMN’. We also analyzed the data with the DKNTMN:0.9 setting, however, the result was similar to the normal LC Model parameter setting.
Conclusions
We analyzed two 2HG basis set results from the same 2HG scan data. A subtle change in basis set simulation can induce large differences in sensitivity and specificity results.
Acknowledgements
The authors would like to thank the Dana-Farber Cancer Institute Center for Neuro-Oncology and the Brigham and Women’s Hospital radiology staff for their contributions to patient care. SK would like to acknowledge the support of the “Training in Image Guidance, Precision Diagnosis and Therapy” NIH T32 Fellowship (T32 EB025823) in the Department of Radiology at Brigham and Women’s Hospital.References
1. Choi C, Ganji SK, DeBerardinis RJ, et al. 2-hydroxyglutarate detection by magnetic resonance spectroscopy in IDH-mutated patients with gliomas. Nat Med 2012;18:624–9.
2. Andronesi OC, Rapalino O, Gerstner E, et al. Detection of oncogenic IDH1 mutations using magnetic resonance spectroscopy of 2-hydroxyglutarate. J Clin Invest 2013;123:3659–63.
3. Emir UE, Larkin SJ, Pennington N de, et al. Noninvasive Quantification of 2-Hydroxyglutarate in Human Gliomas with IDH1 and IDH2 Mutations. Cancer Res 2016;76:43–9.
4. Provencher SW, Estimation of metabolite concentrations from localized in vivo proton NMR spectra. Magn Reson Med. 1993 Dec;30(6):672-9.
5. Landheer K, Swanberg KM and Juchem C. (2019). Magnetic Resonance Spectrum Simulator (MARSS), a novel software package for fast and computationally efficient basis set simulation. NMR Biomed e4129.
Figures