3229
Segmentation of Contrast Enhancing Gliomas and Whole Brain Multi-Parametric Mapping in a 6-minute Scan without Injecting Contrast
Jing Liu1, Angela Jakary1, Duan Xu1, Javier Villanueva-Meyer1, Nicholas Butowski1, Jennifer Clarke1, Jennifer Taylor1, Nancy Ann Oberheim Bush1, and Janine Lupo1
1University of California San Francisco, San Francisco, CA, United States
1University of California San Francisco, San Francisco, CA, United States
Synopsis
Keywords: Tumors, Cancer
Multiple brain MRI sequences are routinely applied for tissue characterization and lesion detection, by acquiring multi-contrast anatomical images. We developed a single continuous data acquisition to generate multi-contrast images with high acquisition efficiency, which allows automatic brain tissue segmentation and lesion detection without contrast injection. Multi-compartment model-based dictionary searching method was developed to derive multi-parametric mapping, including T1, T2 and macromolecular proton fraction mapping. This short imaging acquisition (6 mins versus conventional ~30 mins scan time) without use of contrast injection and the efficient processing pipeline (automatic segmentation and quantitative mapping) can provide great potentials for imaging brain tumor patients.INTRODUCTION
Gliomas are the most common type of primary brain tumors in adults. MRI has been used for assessing gliomas at all phases including diagnosis, treatment planning, monitoring response to therapy, and evaluating progression. Multiple brain MRI sequences, including T2 FLAIR and T1-weighted pre- and post-contrast imaging, are routinely performed for lesion detection and characterization [1], which can take as long as a half an hour. Requirement of contrast administration may not be suitable for patients with renal dysfunction and brings a concern of Gad deposition in the deep brain, which is not ideal for longitudinal scans in patients with lower-grade, less aggressive lesions. We have developed a whole brain multi-contrast imaging method by continuously acquiring data applied with multiple inversion pulses in a 6-minute scan [2-6], allowing multi-parametric mapping, automatic brain tissue segmentation, and lesion detection without the use of contrast.METHODS
Subjects & Data Acquisition: We have developed an Incomplete Inversion Recovery with balanced Steady State Free Precession (IIR-bSSFP) acquisition using efficient undersampling strategy CIRcular Cartesian UnderSampling (CIRCUS) [1-5]. Clinical brain MRI scans and our developed data acquisition were performed on 14 patients (5 females, age of 56.4±10.4 years) with enhancing gliomas on a 3T MRI scanner (GE Healthcare, Milwaukee) with 32-channel head coil. Scan parameters of IIR-bSSFP acquisition were: FOV=25.6x19.2cm, image matrix = 256x192x160, FA=30o, TR/TE=4.2/1.7ms, BW=±125kHz, inversion pulses applied every Tinv=3s, and scan time of 6 mins. Multi-contrast images of isotropic resolution 1mm3 at 20 inversion times (TIs) were reconstructed using k-t SPARSE-SENSE method [7,8] (achieving a ~8-fold acceleration).Data Analysis: Automatic segmentation based on the multi-contrast images was developed to segment the white matter (WM), grey matter (GM), cerebrospinal fluid (CSF), the hyperintense lesion (T2L), the contrast-enhancing lesion (CEL) and the necrosis (NEC). The T2L and CEL obtained with the developed method without injection of gadolinium were compared against manually segmented regions drawn from conventional anatomical images (T2 FLAIR and post-contrast T1w). Linear regression, Bland-Altman analysis, and paired t-test were performed to analyze the measurements acquired with the new method and the reference methods.
Quantitative Mapping: Multi-contrast images were explored to derive T1, T2 and macromolecular proton fraction (MF) mapping of the whole brain, using modified two-compartment model (macromolecular proton and “free” water) [9,10] and dictionary search [11] by integrating the key imaging parameters (TR, TE, FA, BW, Tinv etc), the sequence design, and with the assumptions of tissue properties (ranges of T1, T2 and MF; T1/T2/exchange rate of macromolecular proton). In a smaller cohort (6 out 14 cases), the conventional 2D T1 mapping using spin-echo inversion recovery SE-IR sequence (~9mins) and 2D T2 mapping using Carl-Purcell-Meiboom-Gill (CPMG) sequence(~5mins) were applied to image 8 slices centered around the CEL. We also acquired data using 3D MAGiC (SyntheticMR) for myelin water fraction MWF and T2 mapping (1.2mm3, scan time of 6mins). Mapping values in brain tissue and lesion segments were compared between different methods.
RESULTS
Segmentation: Figure 1 shows the results of automatic brain tissue and lesion segmentation from two cases, compared to their manual segmentation on conventional post-contrast T1w and T2 FLAIR images. Figure 2 shows that the volume measurements of CEL and T2L between the conventional method and our method are comparable (correlation coefficients r=0.7, p<0.01; paired t-test of differences in volumes p=0.46,0.48 for CE, T2L respectively).Mapping: Figure 3 displays the whole brain quantitative T1, T2 and MF maps, from the two cases in Figure 1. Mapping values in each segment were measured on all 14 patients, as shown in Figure 4. Although the T1/T2 measurements (n=6) of our method were not significantly correlated with those obtained with 2D imaging methods, overall similar lesion contrast was observed visually and T2/MF measurements of our method were significantly correlated with T2/MWF acquired using 3D MAGiC (r=0.77/0.85, p<0.05).
Distinguishing Infiltrating Tumor: 3D visualization of the T1/T2/MF mapping measurements (Figure 5) clearly demonstrates the brain tissue/lesion mapping distribution, where the center/radius of each ellipsoid corresponds to the mean/standard deviation of T1/T2/MF measurements in one of the segments among 14 cases. WM/CSF/NEC are quite separable from other tissues given their distribution. The T1/T2 values of T2L-2 are significantly different from those in CEL (p<0.05); the MF value of T2L-2 is significantly different from that of GM; and the T2/MF values of GM is significantly different from those of T2L-1. This suggests that T2L-2 reflects areas of infiltrating tumor whereas T2L-1 contains more white matter, but mixed with some edema.
CONCLUSIONS
We demonstrated the potential of achieving whole brain quantitative multi-parametric mapping, brain tissue segmentation and lesion detection of contrast enhancing gliomas without the use of contrast agent in a relatively short single scan (6 mins). Further work will confirm these results in a larger cohort and will correlate with other imaging and histopathological analysis of tissue.Acknowledgements
We acknowledge the funding support of NIH R21CA238137 (Liu/Lupo).References
1. Ellingson B, et al. Neuro Oncol 2015 Sep;17(9):1188-98.
2. Liu J, et al. ISMRM Workshop on MR Value, Mar 2019.
3. Liu J, et al. SNO Annual Meeting 21(2019):NIMG- 45.
4. Cao P. et al. Med Phys. 2019 Oct;46(10):4610-4621.
5. Liu J, et al, ISMRM Annual Meeting 2020, p1242.
6. Liu J, et al. Quant Imaging Med Surg 2014;4:57–67.
7. Otazo R, et al. Magn Reson Med. 2010 Sep;64(3):767-76.
8. Feng L, et al. Magn Reson Med. 2013 Jul;70(1):64-74.
9. McConnell HM. J Chem Phys 1958;28:430–431.
10. Liu F, et al. Magn. Reson. Med., vol. 75, no. 4, pp. 1423–1433, Apr. 2016.
11. Ma D, et al. Nature. 495, 187-192, 2013.
Figures
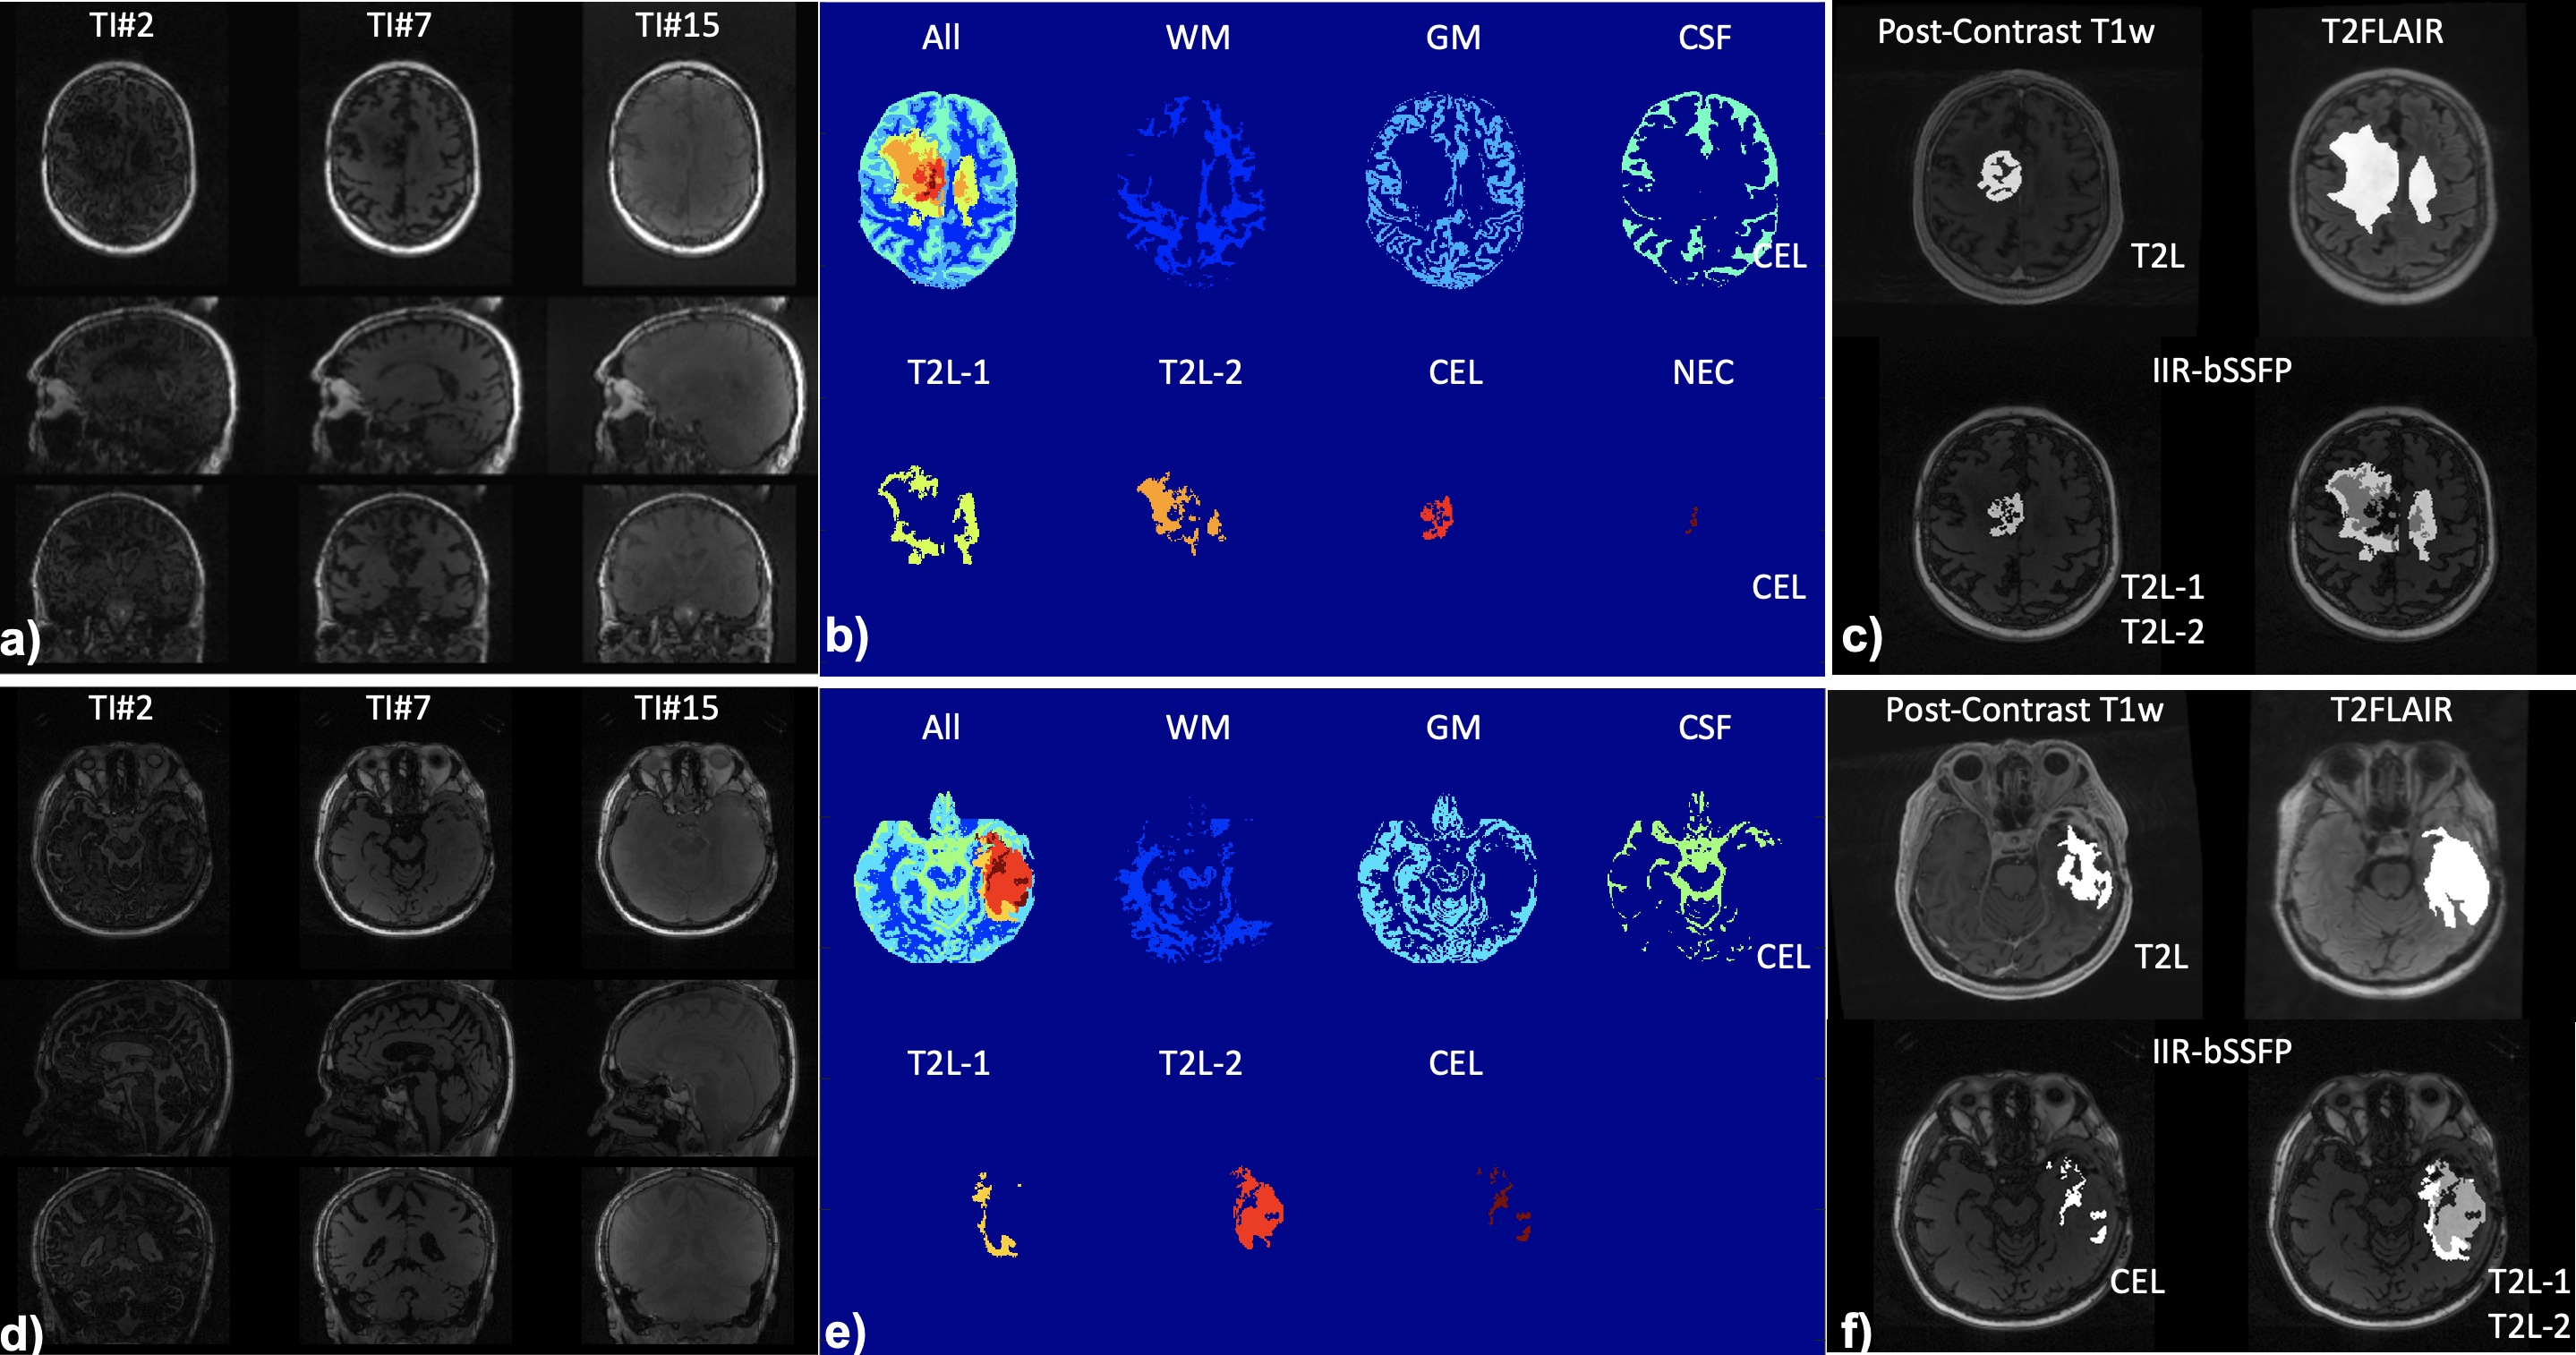
Figure 1. With the developed multi-contrast imaging (a&d, IIR-bSSFP, images at 3 out of 20 inversion times from two cases), automatic brain tissue and lesion segmentation (b&e) were achieved, compared to the manual segmentation based on conventional imaging methods (c&f). With our new method, two regions in the T2L were detected.
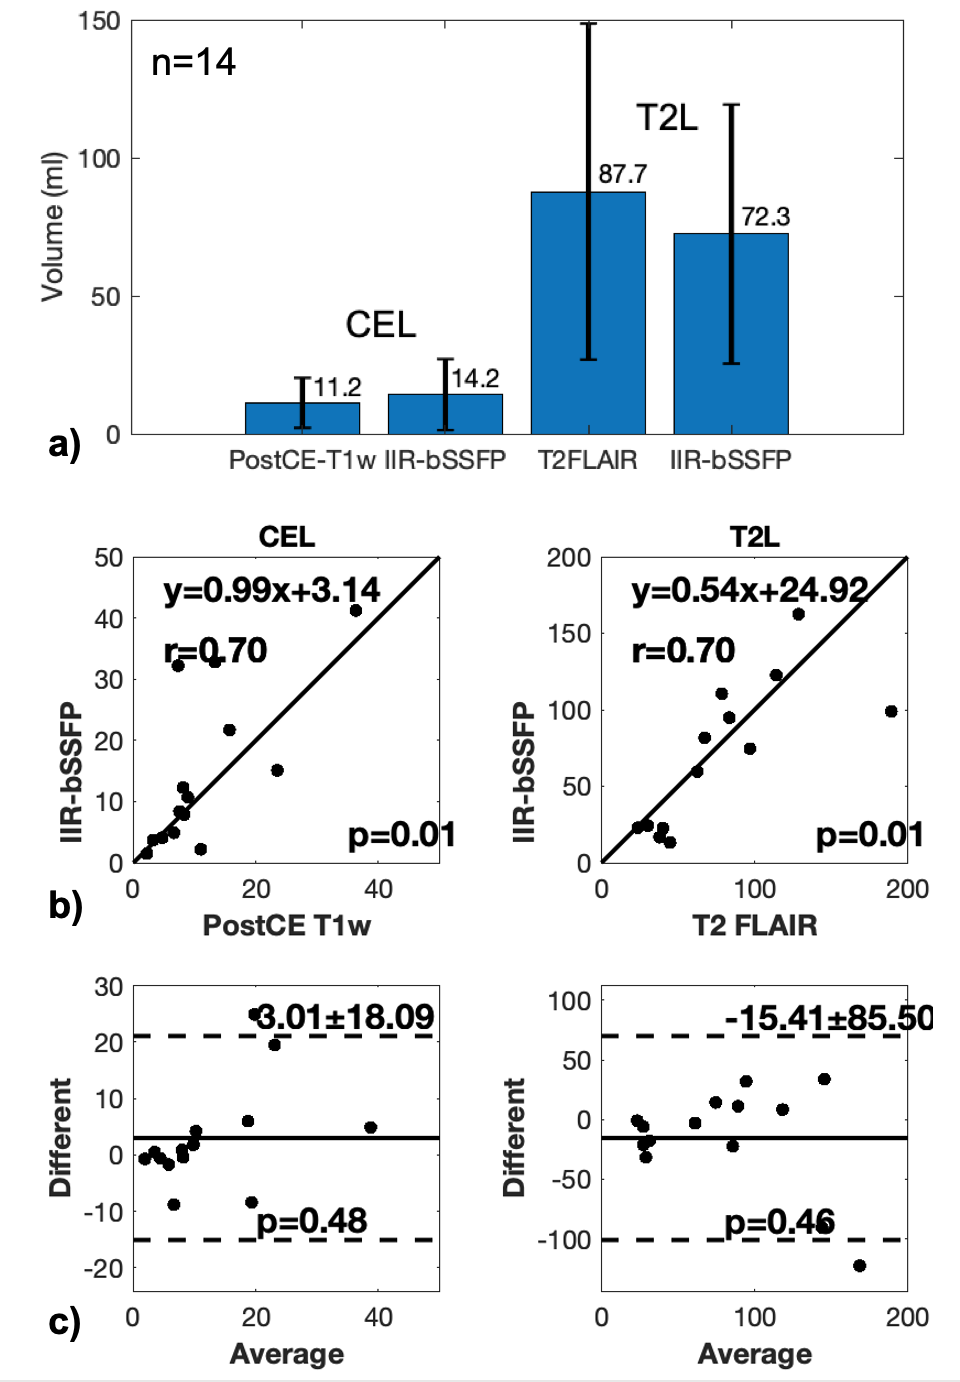
Figure 2. CEL and T2L volume measurements with the conventional methods and our developed method IIR-bSSFP are plotted in a), and the linear regression and Bland-Altman plots are shown in b&c) (n=14). Strong correlations (p<0.05) of CEL and T2L volume measurements between the conventional and new methods were found; no significant difference (p>0.05) of CEL and T2L volume measurements were found between the different methods (unit: ml)
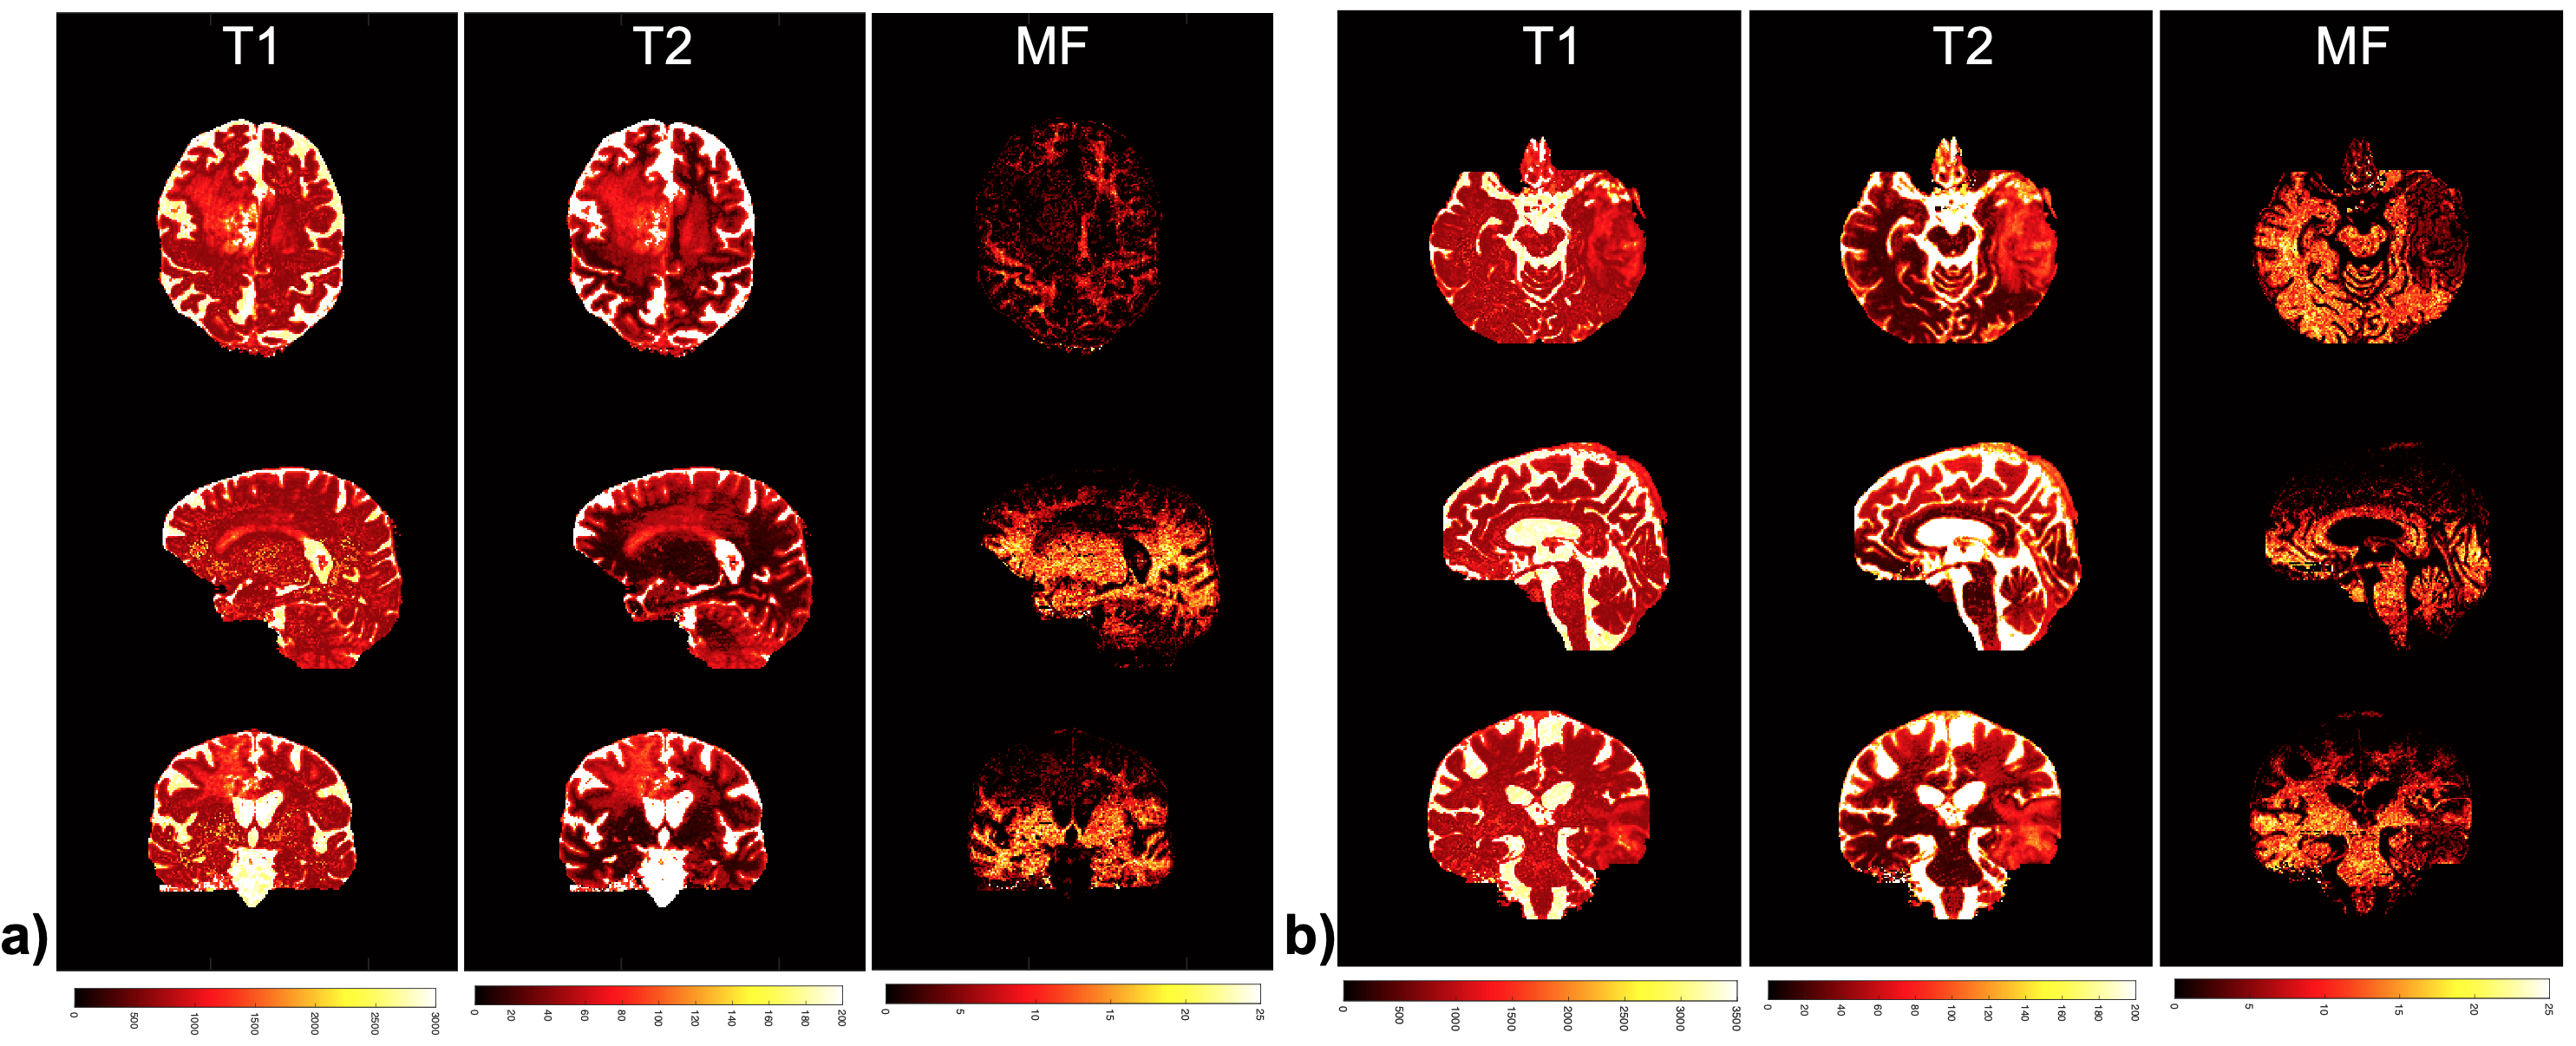
Figure 3. Quantitative multi-parametric mapping (T1/T2/macromolecular proton mapping) derived from IIR-bSSFP-CIRCUS acquisition and dictionary searching with two-compartment model.
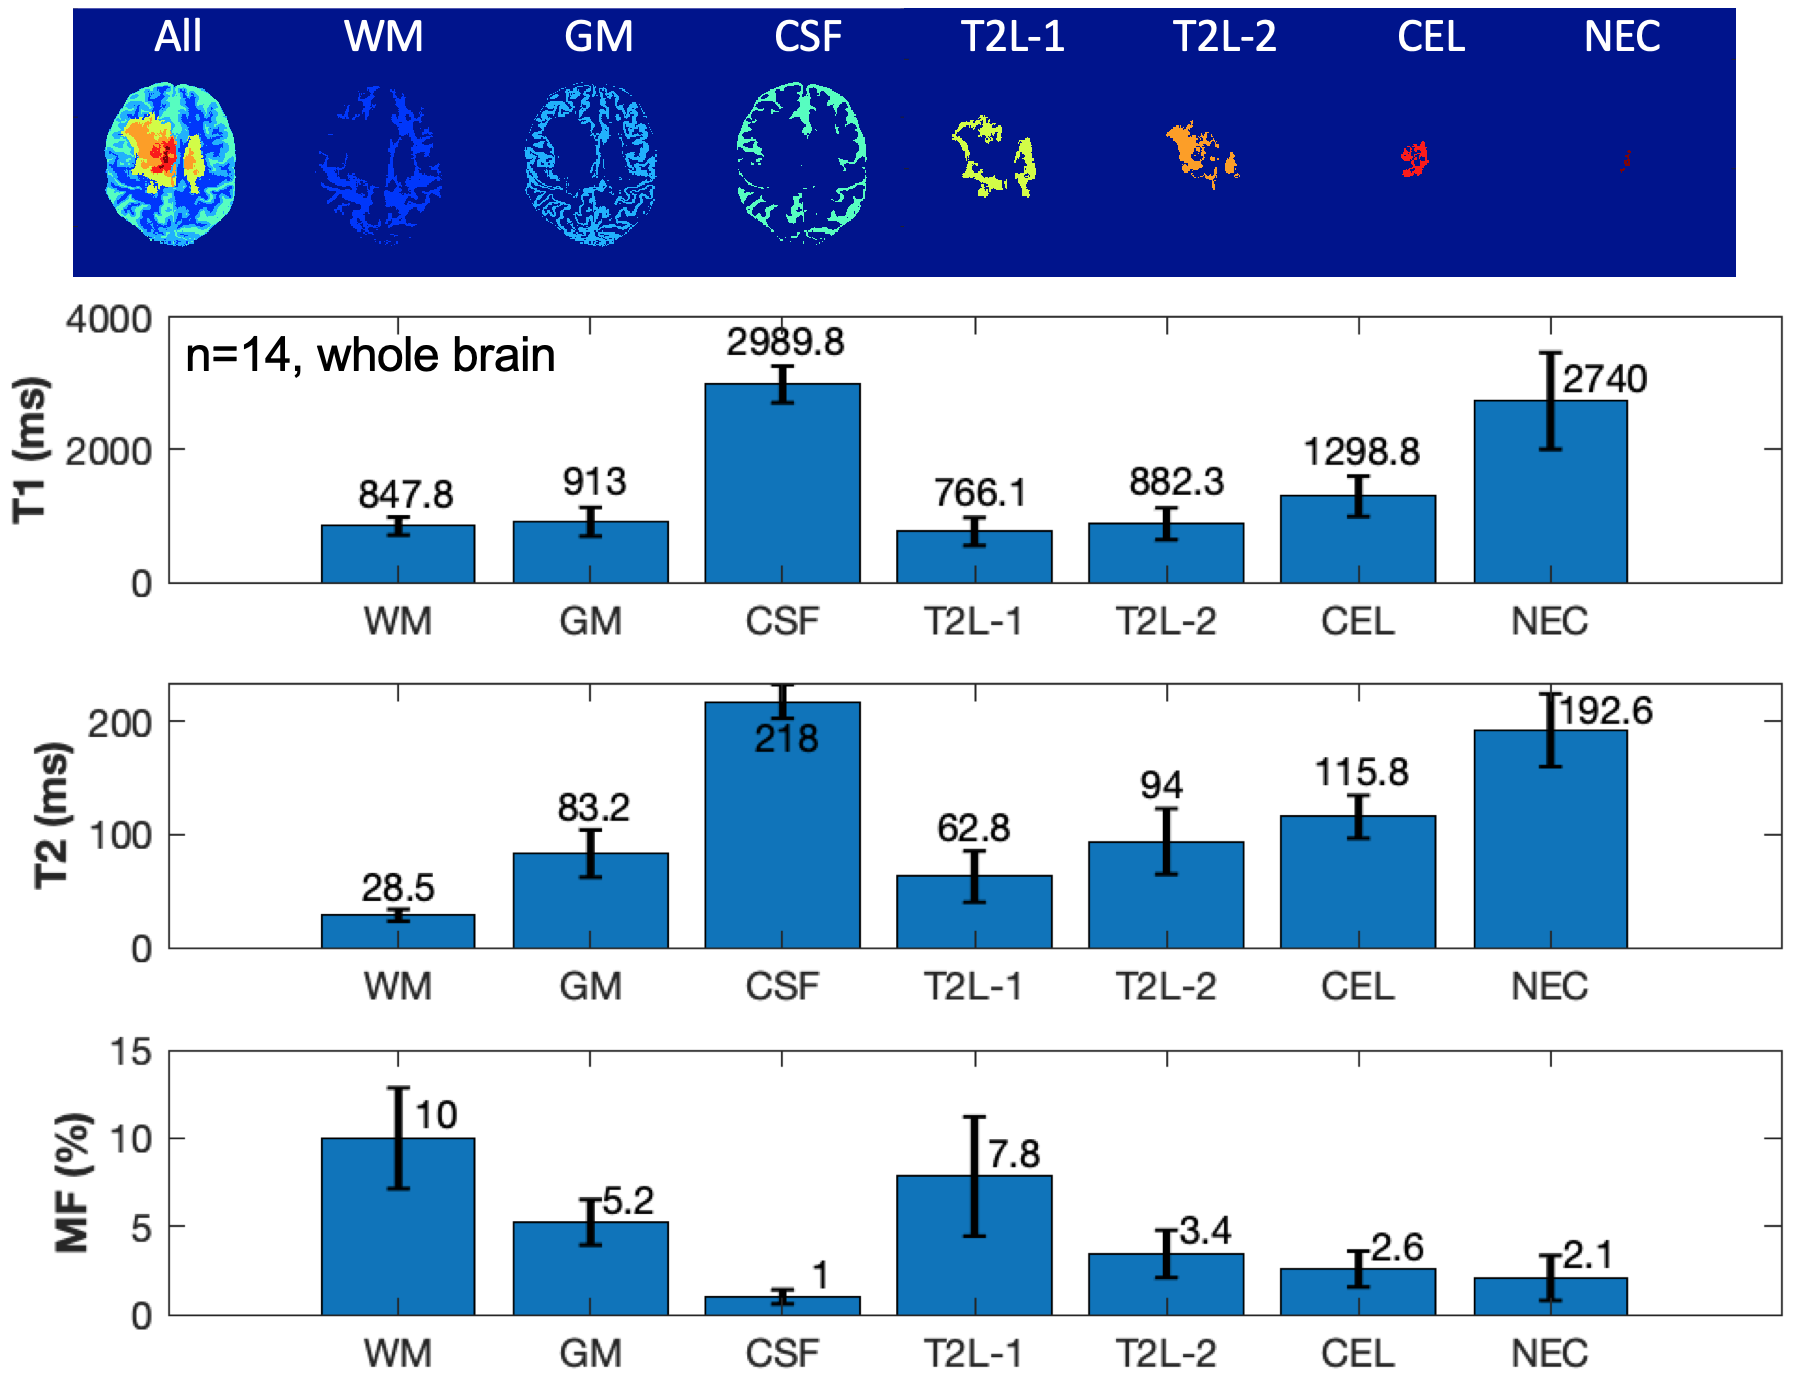
Figure 4. T1, T2 and MF measurements in each segment (whole brain, n=14).
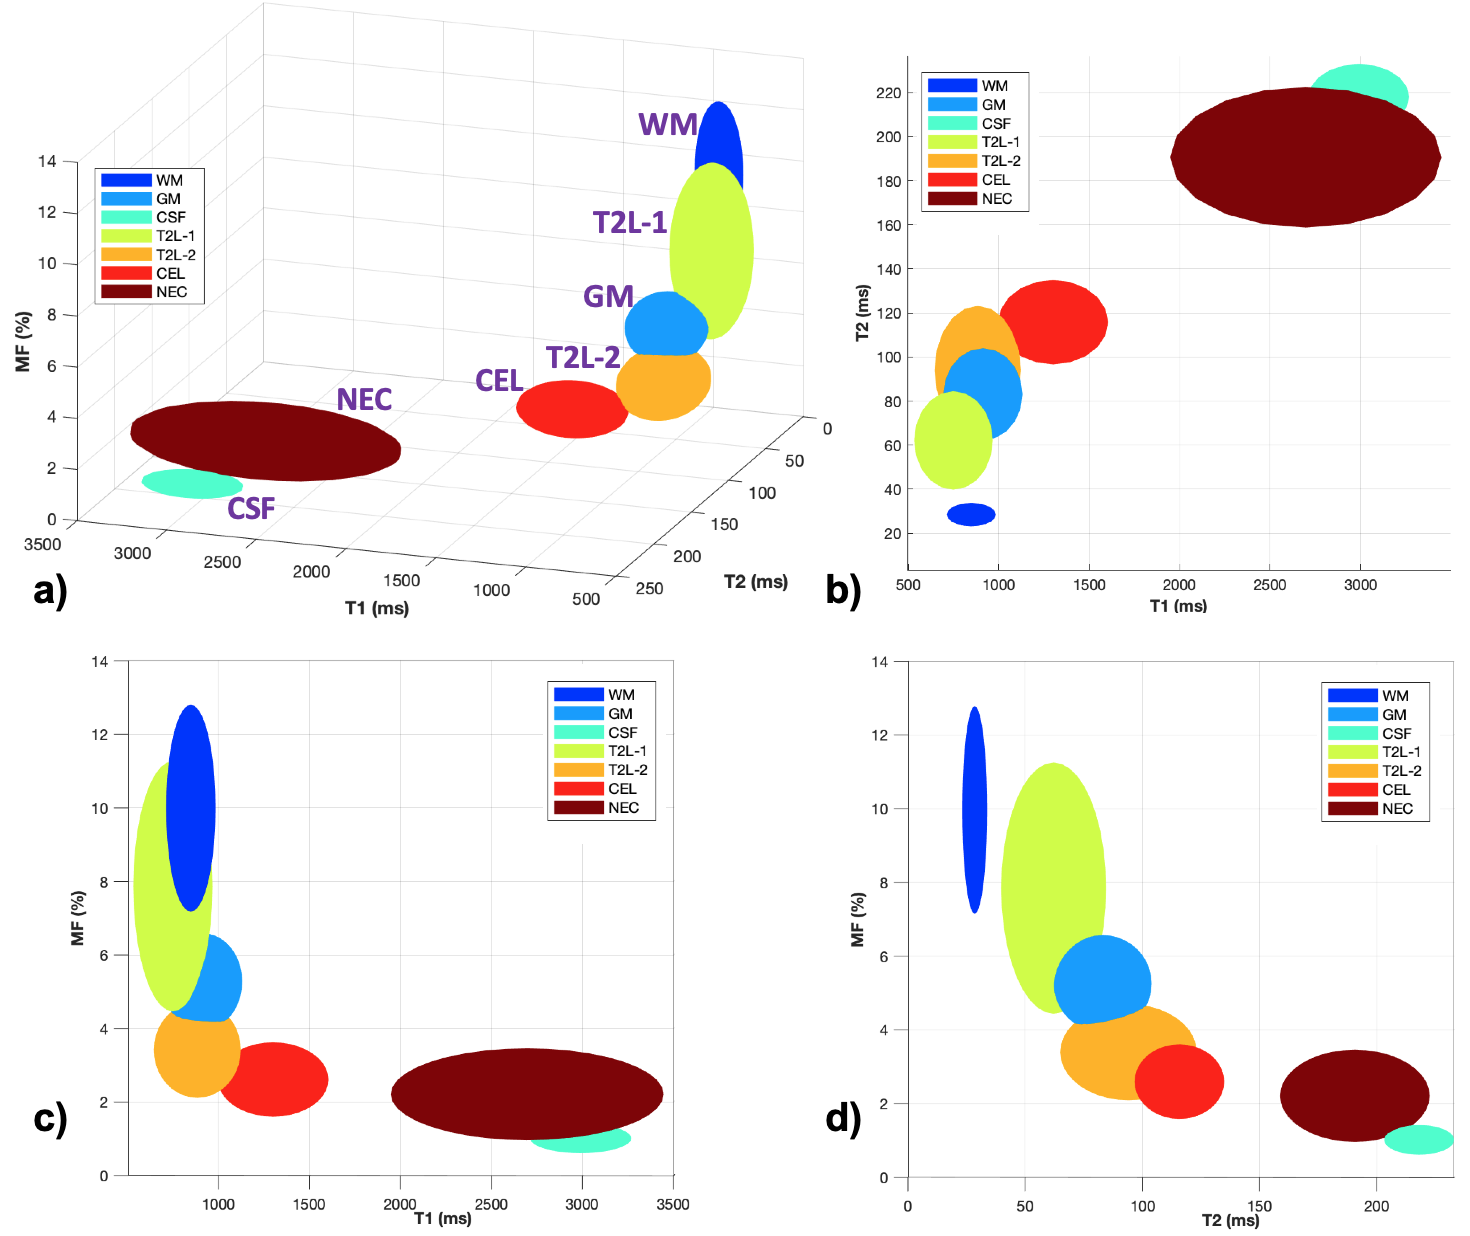
Figure 5. 3D visualization of the T1/T2/MF mapping measurements (n=14) in each segment. The center/radius of each ellipsoid corresponds to the mean/standard deviation of T1/T2/MF measurements.
DOI: https://doi.org/10.58530/2023/3229