3228
Differentiation of atypical high-grade glioma from primary central nervous system lymphoma with mean apparent propagator-MRI
Eryuan Gao1, Guohua Zhao1, Huiting Zhang2, Xiaoyue Ma1, Peipei Wang1, Jie Bai1, Xu Yan2, Guang Yang3, and Jingliang Cheng1
1Department of Magnetic Resonance, the First Affiliated Hospital of Zhengzhou University, Zhengzhou, China, 2MR Scientific Marketing, Siemens Healthcare, Shanghai, China, 3Shanghai Key Laboratory of Magnetic Resonance, East China Normal University, Shanghai, China
1Department of Magnetic Resonance, the First Affiliated Hospital of Zhengzhou University, Zhengzhou, China, 2MR Scientific Marketing, Siemens Healthcare, Shanghai, China, 3Shanghai Key Laboratory of Magnetic Resonance, East China Normal University, Shanghai, China
Synopsis
Keywords: Tumors, Diffusion/other diffusion imaging techniques, mean apparent propagator
Atypical high-grade glioma (HGG) (with no or little necrosis) and primary central nervous system lymphoma (PCNSL) are difficult to distinguish in routine MR images but their treatment strategies are totally different. Therefore, it’s important to distinguish between them before treatment. This study aimed to investigate the diagnostic efficiency of quantitative analysis based on mean apparent propagator-MRI in discriminating atypical HGG from PCNSL. Through quantitative analysis of MAP parameters, we found that MAP-MRI performed well in differentiating between atypical HGG and PCNSL.Introduction
High-grade glioma (HGG) and primary central nervous system lymphoma (PCNSL) are two common primary tumors in brain [1]. Typical HGG often demonstrates ring-enhancement and necrosis, and typical PCNSL is usually homogenously enhanced. However, atypical HGG with little or no necrosis, is hard to be distinguished from PCNSL [2, 3]. In addition, HGG is usually resected by surgery and then treated by concurrent chemoradiation with temozolomide, while PCNSL is usually treated with methotrexate [4, 5]. Therefore, it’s crucial to distinguish between atypical HGG and PCNSL before treatment. In this study, we aimed to differentiate them with quantitative analysis based on an advanced DWI model, called mean apparent propagator (MAP)-MRI.Materials and Methods
This prospective study was approved by the review board of our hospital and written informed consent was obtained from all patients. We recruited patients with atypical HGG or PCNSL from September 2018 to October 2022. The criteria were as follows: (1) patients who were pathologically diagnosed with HGG or PCNSL; (2) no history of biopsy or antitumor treatment such as chemotherapy, radiotherapy, or surgery before scanning. The exclusive criteria were as follows: (1) HGG with obvious necrosis; (2) images with severe motion or susceptibility artifact; (3) the surgery or biopsy was performed within two weeks after the MRI examination. Finally, 30 patients with atypical HGG and 25 patients with PCNSL were recruited. All patients were examined on a 3T scanner (MAGNETOM Prisma, Siemens Healthcare, Erlangen, Germany) with an integrated 64-channel head and neck coil. The sequences included axial T1WI (time of repetition [TR]=250 ms, time of echo [TE]=2.46 ms, acquisition time=37 seconds), axial T2WI (TR=4090 ms, TE=99 ms, acquisition time=34 seconds), axial T2-tirm dark-fluid (TR=8000 ms, TE=81 ms, acquisition time=1min 38 seconds), axial multi-b-value DWI (TR=2500.0 ms, TE=71 ms, acquisition time=6min 34 seconds) and 3-dimensional (3D) contrast-enhanced T1 magnetization prepared rapid gradient echo (CE-T1 MPRAGE) (TR=2300 ms, TE=2.32 ms, acquisition time=5min 21 seconds). The multi-b-value DWI were acquired using 5 b-values (500, 1000, 1500, 2000, and 2500 s/mm2) distributed in 30 directions and one DWI with b = 0. The MPRAGE sequence was conducted after administering 0.2 mol/kg body weight of gadopentetate dimeglumine (Magnevist, Bayer Schering Pharma AG, Berlin, Germany). After examination, all images of the 3D CE-T1 MPRAGE were reconstructed into 20 slices in the axial planes. The parametric maps of MAP, including return to the origin probability (RTOP), return to the axis probability (RTAP), return to the plane probability (RTPP),non-Gaussianity (NG), axial non-Gaussianity (NGAx), radial non-Gaussianity (NGRad), mean square displacement (MSD) and q-space inverse variance (QIV), were computed from the multi-b-value DWI data using an in-house-developed post-processing software, named NeuDiLab, based on Diffusion Imaging In Python (DIPY; http://nipy.org/dipy). After processing, all parametric maps of MAP were registered to the axial CE-T1 MPRAGE images and the region of interest (ROI) containing the contrast-enhanced area of the tumor (Fig. 1), was manually delineated on the axial CE-T1 MPRAGE images by the consensus of two radiologists (respectively with 10 years and 15 years of experience). Then the average values of RTOP, RTAP, RTPP, NG, NGax, NGrad, MSD and QIV were calculated from the ROI. The three steps above were all performed with the ITK-SNAP (http://www.itksnap.org) software. Statistical analysis was performed using SPSS 21.0 (SPSS Inc., Chicago, IL, USA). Between the atypical HGG and PCNSL groups, the average values of RTOP, RTAP, RTPP, NG, NGAx, NGRad, MSD and QIV were compared using the Mann–Whitney U test between the two groups. Receiver operating characteristic (ROC) curves were constructed to assess the diagnostic performance of significant parameters. Statistical significance was set at P < 0.05.Results
As shown in Table 1, the mean values of RTOP, RTAP, RTPP, NG, NGAx, and NGRad in atypical HGG group were significantly lower than those in PCNSL group (P<0.05), while QIV significantly higher in atypical HGG group. MSD had no significant difference between two groups (p=0.0630.05). The ROC analyses of MAP parameters with significance are shown in Table 2 and Figure 2.Discussion
In this study, the diagnostic efficiency of MAP in discriminating between atypical HGG and PCNSL was explored. Our results demonstrated that the MAP-MRI did well in differentiating atypical HGG from PCNSL. Among all significant parameters, NGRad achieved the highest area under the curve (AUC). According to previous studies, the cellularity and mean nucleus/cytoplasm ratio of lymphoma is higher than that of glioblastoma, which was identified by our results with significantly higher NG, NGAx and NGRad in PCNSL. Pang et. al [6, 7] showed lower MD in PCNSL compared to HGG using DKI. In addition, researchers showed that the water diffusivity in tissue is mainly affected by the extracellular space. Lower MD in PCNSL than that in HGG demonstrated that the PCNSL has smaller extracellular space than HGG. In our research, significantly higher RTOP, RTAP and RTPP were obtained in PCNSL, which was in accordance with the findings of Pang et al [6, 7].Conclusion
In conclusion, MAP-MRI is a promising method in differentiating atypical HGG from PCNSL.Acknowledgements
No acknowledgement found.References
[1] Louis D N, Perry A, Wesseling P, et al. The 2021 WHO Classification of Tumors of the Central Nervous System: a summary. Neuro-Oncology, 2021, 23(8): 1231–1251. [2] Al-Okaili RN, Krejza J, Woo JH et al (2007) Intraaxial brain masses: MR imaging-based diagnostic strategy–initial experience. Radiology 243:539–550 [3] Buhring U, Herrlinger U, Krings T, Thiex R, Weller M, Kuker W (2001) MRI features of primary central nervous system lymphomas at presentation. Neurology 57:393–396 [4] Schlegel U (2009) Primary CNS lymphoma. Ther Adv Neurol Disord 2:93–104 [5] Stupp R, Mason WP, van den Bent MJ et al (2005) Radiotherapy plus concomitant and adjuvant temozolomide for glioblastoma. N Engl J Med 352:987–996 [6] Pang H, Ren Y, Dang X, et al. Diffusional kurtosis imaging for differentiating between high-grade glioma and primary central nervous system lymphoma. J Magn Reson Imaging. 2016;44(1):30-40. [7] Pang H, Dang X, Yan R, et al. Diffusion kurtosis imaging differs between primary central nervous system lymphoma and high-grade glioma and is correlated with the diverse nuclear-to-cytoplasmic ratio: a histopathologic, biopsy-based study. Eur Radiol. 2020;30(4):2125-2137.Figures
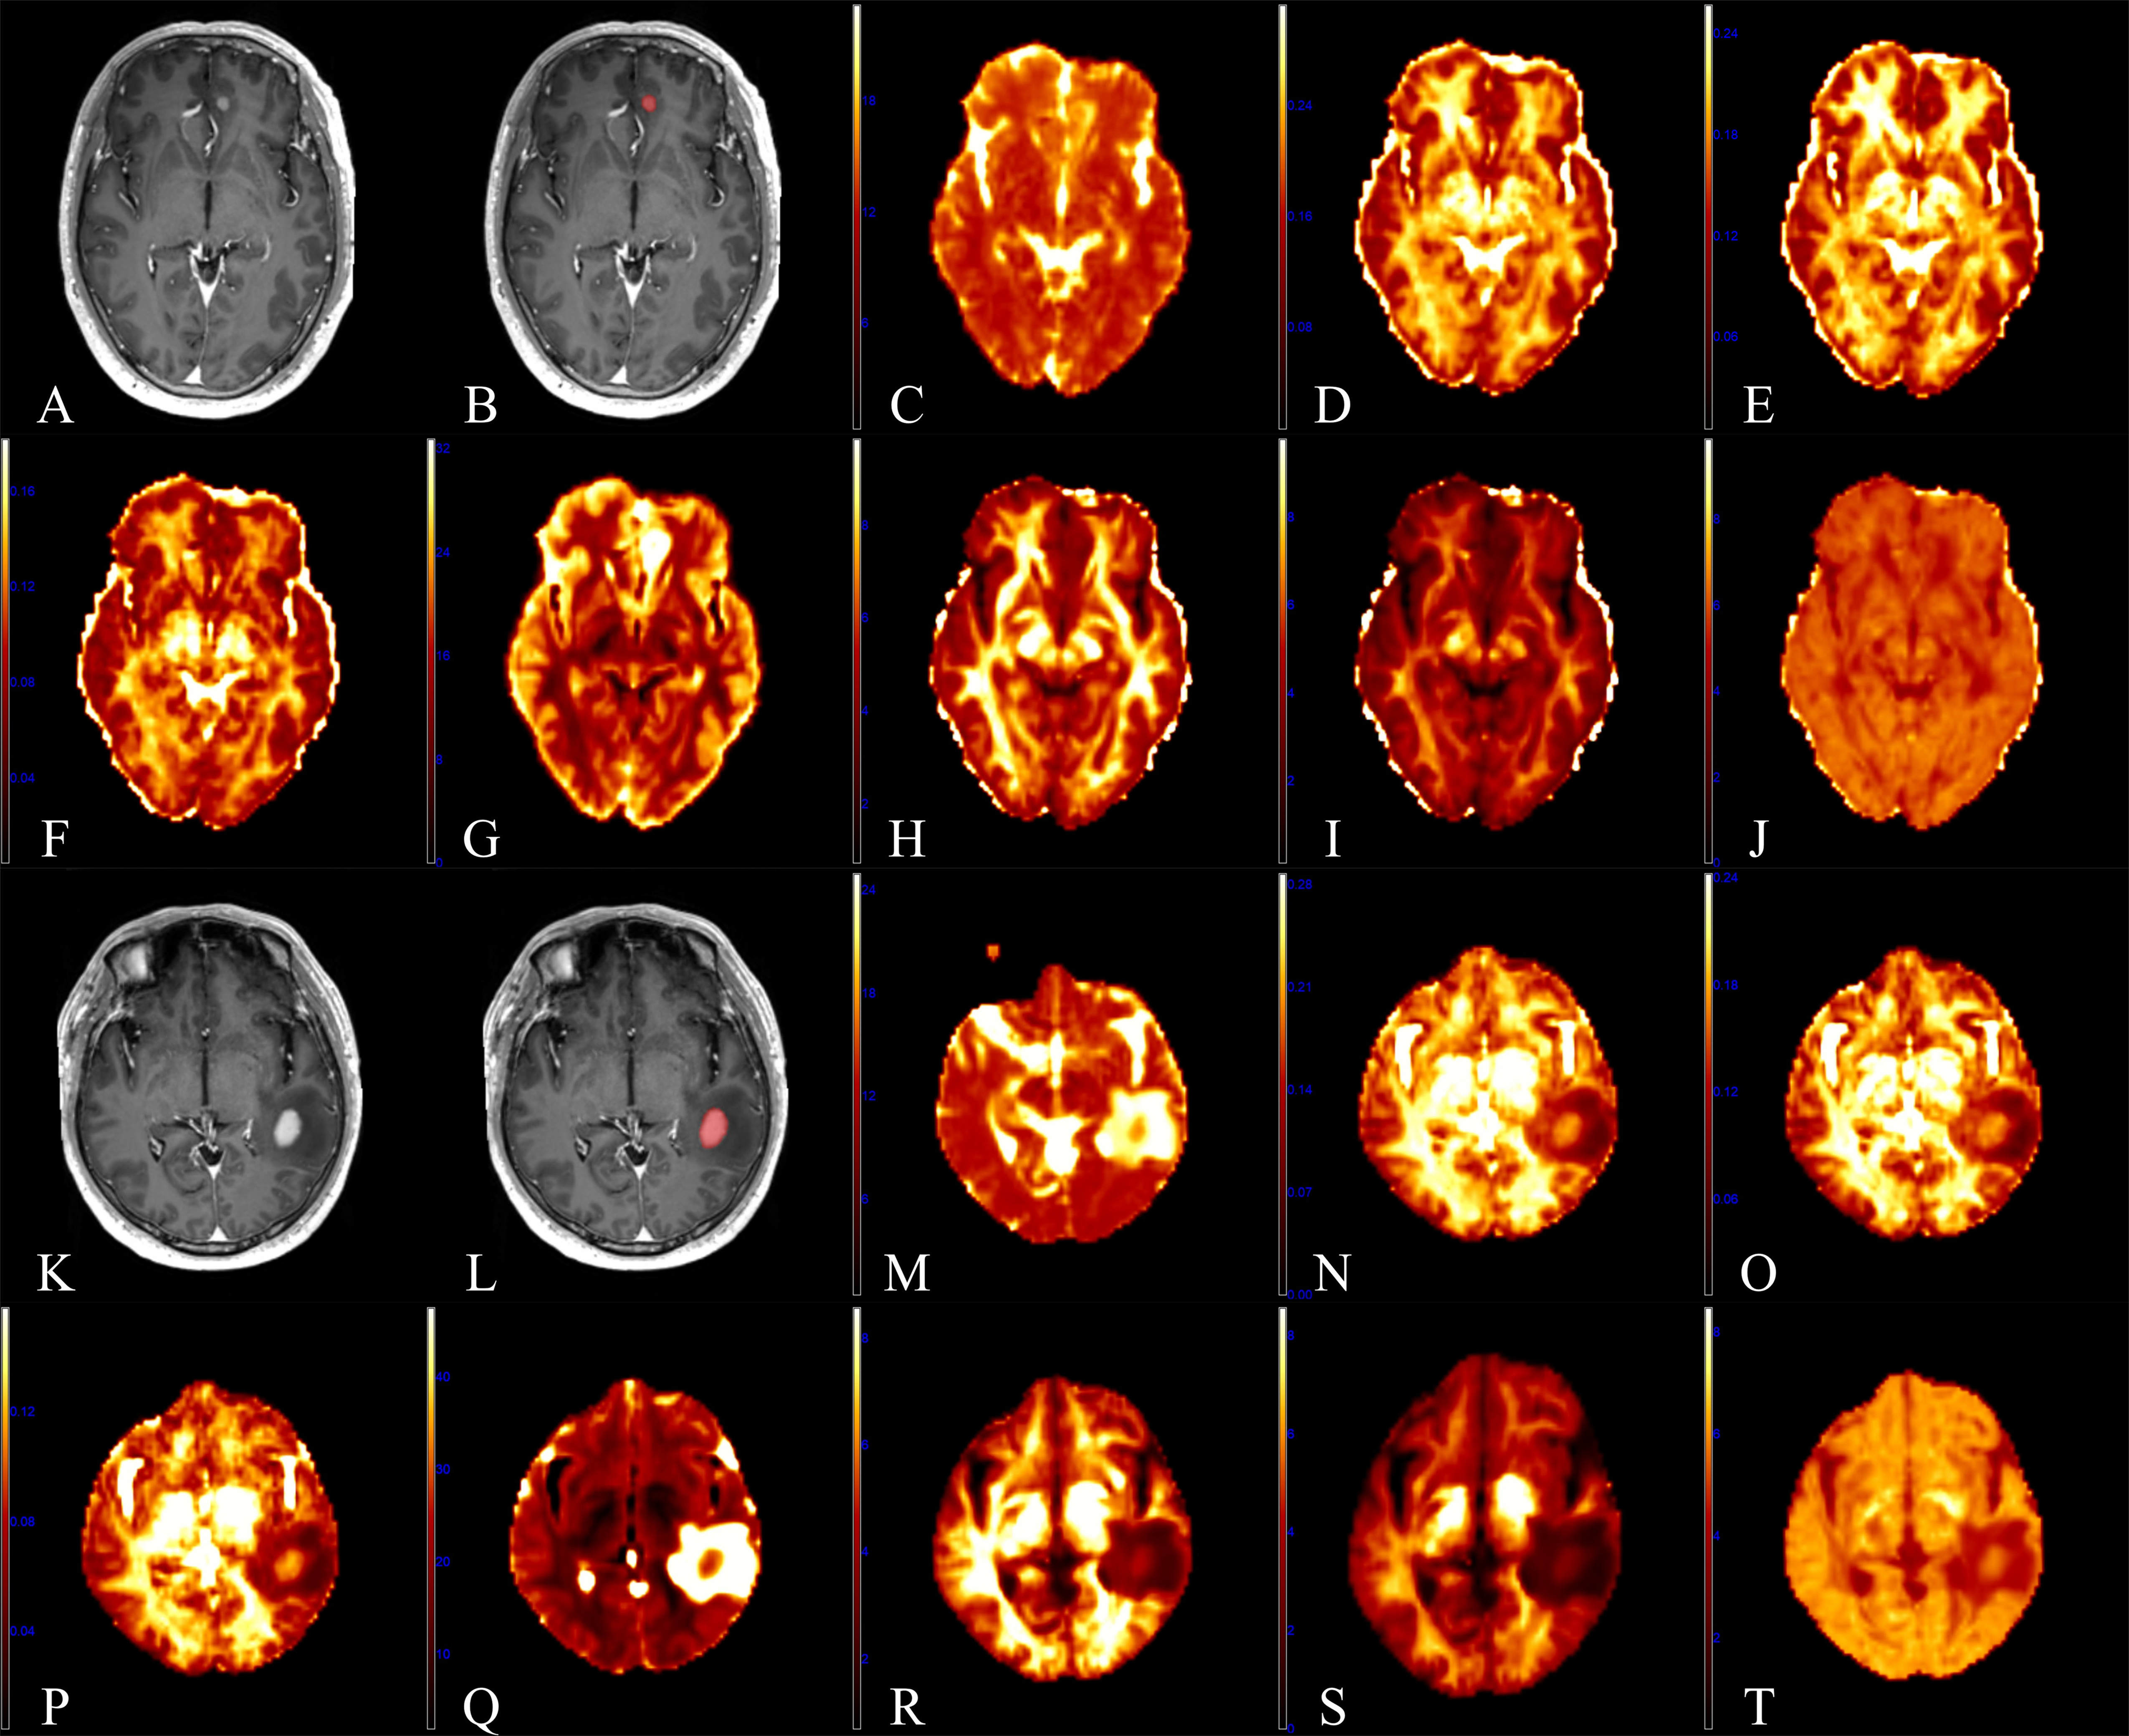
Fig.
1 A 60-year-old male with primary central nervous system lymphoma (PCNSL) in
the left frontal lobe (A-J) and a 48-year-old male with atypical high-grade
glioma (HGG) in the left temporal lobe (K-T). (A, K): CE-T1 MPRAGE images. (B, L):
Region of interest (ROI) (contrast-enhanced area) in the CE-T1 MPRAGE images.
(C, M): Parametric maps of MSD. (D, N):
NG. (E, O):
NGAx. (F,
P): NGRad. (G, Q): QIV. (H, R): RTAP. (I, S): RTOP. (J, T): RTPP.
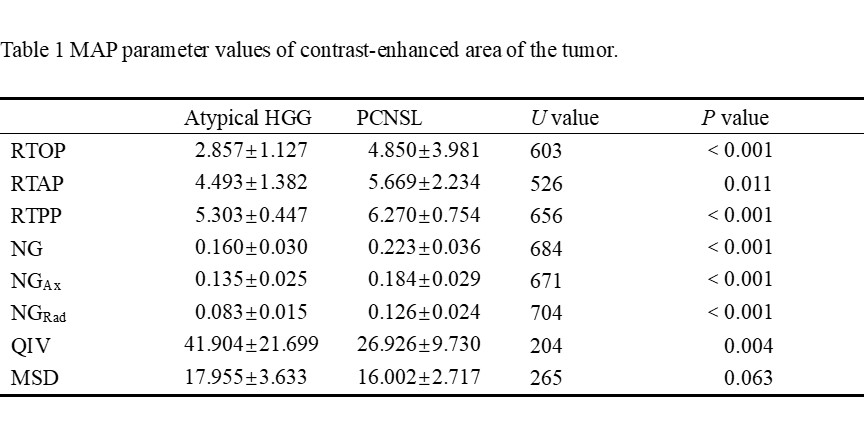
Table
1 MAP parameter values of contrast-enhanced area of the tumor.
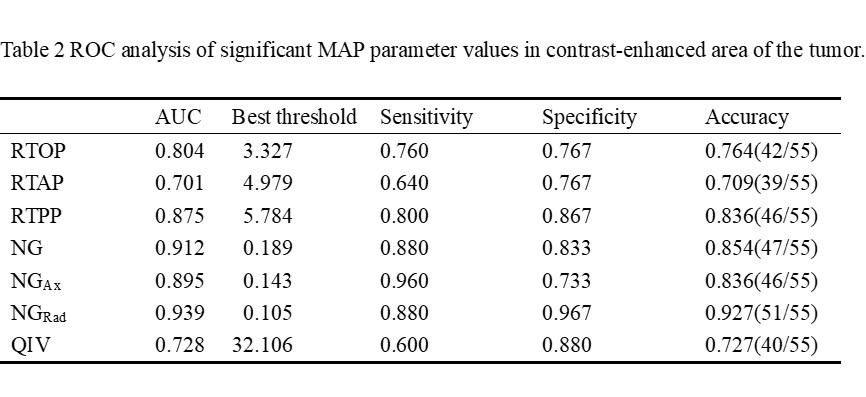
Table
2 ROC analysis of significant MAP parameters in contrast-enhanced area of
the tumor.
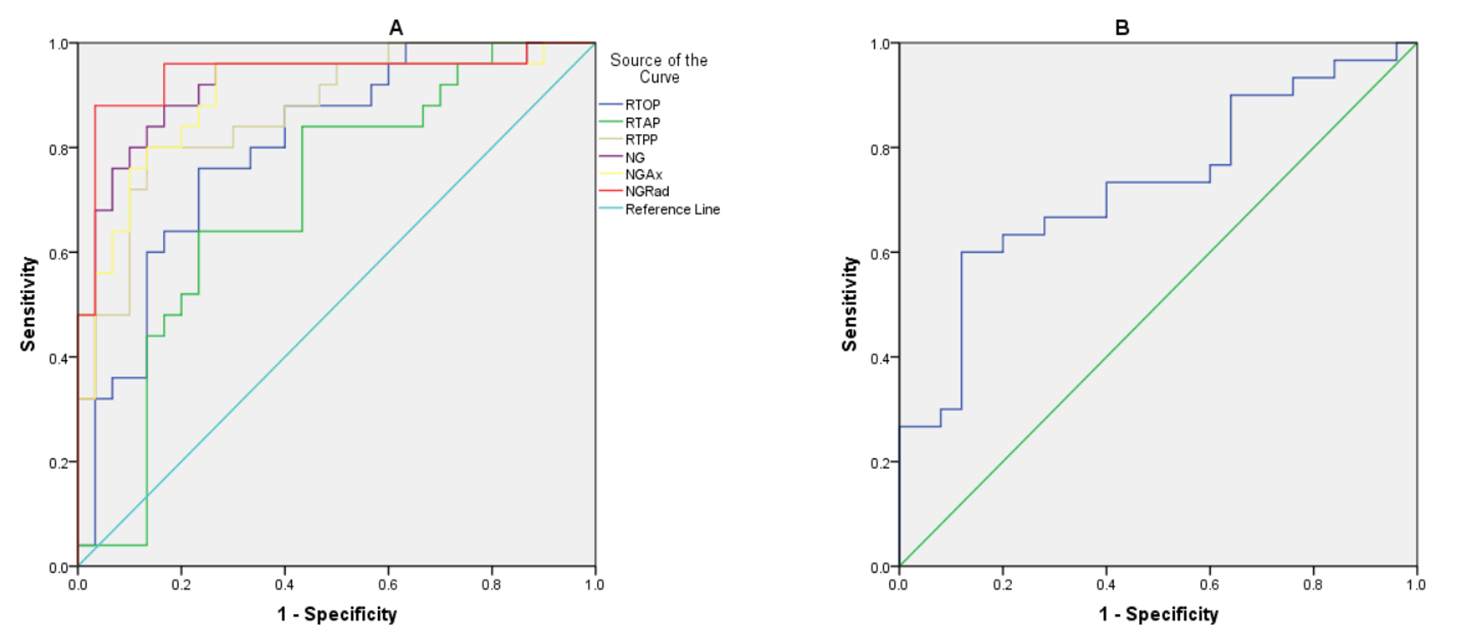
Fig.
2 (A) The receiver operating characteristic (ROC) curves of the mean apparent
propagator (MAP) parameter values in the contrast-enhanced area. (B) The ROC curve of q-space inverse variance (QIV) in the contrast-enhanced area.
DOI: https://doi.org/10.58530/2023/3228