3226
Brain MRI phenotypes of glioblastomas are suggestive of overall patient survival1Department of Radiology, Leiden University Medical Center, Leiden, Netherlands, 2Medical Delta Cancer Diagnostics 3.0, South-Holland, Netherlands, 3Department of Neurology, Leiden University Medical Center, Leiden, Netherlands, 4Department of Neurology, Haaglanden Medical Center, The Hague, Netherlands, 5Department of Radiology, HagaZiekenhuis, The Hague, Netherlands, 6Clinical Artificial Intelligence Implementation and Research Lab (CAIRELab) and Department of Information Technology & Digital Innovation, Leiden University Medical Center, Leiden, Netherlands, 7Department of Digital Health, University Medical Center Utrecht, Utrecht, Netherlands
Synopsis
Keywords: Tumors, Tumor, Perfusion
Despite multimodal anti-tumor treatment, glioblastomas typically progress, yet identifying true tumor progression on MRI-scans is challenging. We aimed to establish brain MRI phenotypes of glioblastomas by combined analysis of radiological scoring of structural and perfusion tumor characteristics 3-months post-radiotherapy. Hierarchical clustering analysis method was applied to group patients by similar tumor characteristics and it was analyzed whether these groups showed differences in tumor progression and overall survival outcome. Four distinct MRI phenotypes of glioblastoma were established and showed between-group differences in median overall survival time.Introduction
Glioblastoma is the most common and severe type of primary malignant brain tumor and despite multimodal treatment shows a high local recurrence rate (90%)1. Distinguishing between true tumor progression (TP) and treatment induced abnormalities (e.g. pseudo-progression (PP) after radiotherapy) on conventional MRI scans remains challenging. Perfusion imaging techniques such as dynamic susceptibility contrast (DSC) and arterial spin labeling (ASL) MRI have shown to be promising in differentiating between TP and PP2. However, separate imaging markers only showed at best a modest association with tumor progression and overall survival. Our hypothesis was that combined analyses of structural and perfusion tumor characteristics could lead to a more accurate prediction of glioblastoma recurrence rate and overall-survival time. We aimed to establish brain MRI phenotypes of glioblastomas by combined analysis of radiological scoring of structural and perfusion tumor characteristics 3-months post-radiotherapy. We assessed whether these patient groups with similar MRI phenotypes showed differences in tumor progression status (TP vs. PP) and overall survival time.Methods
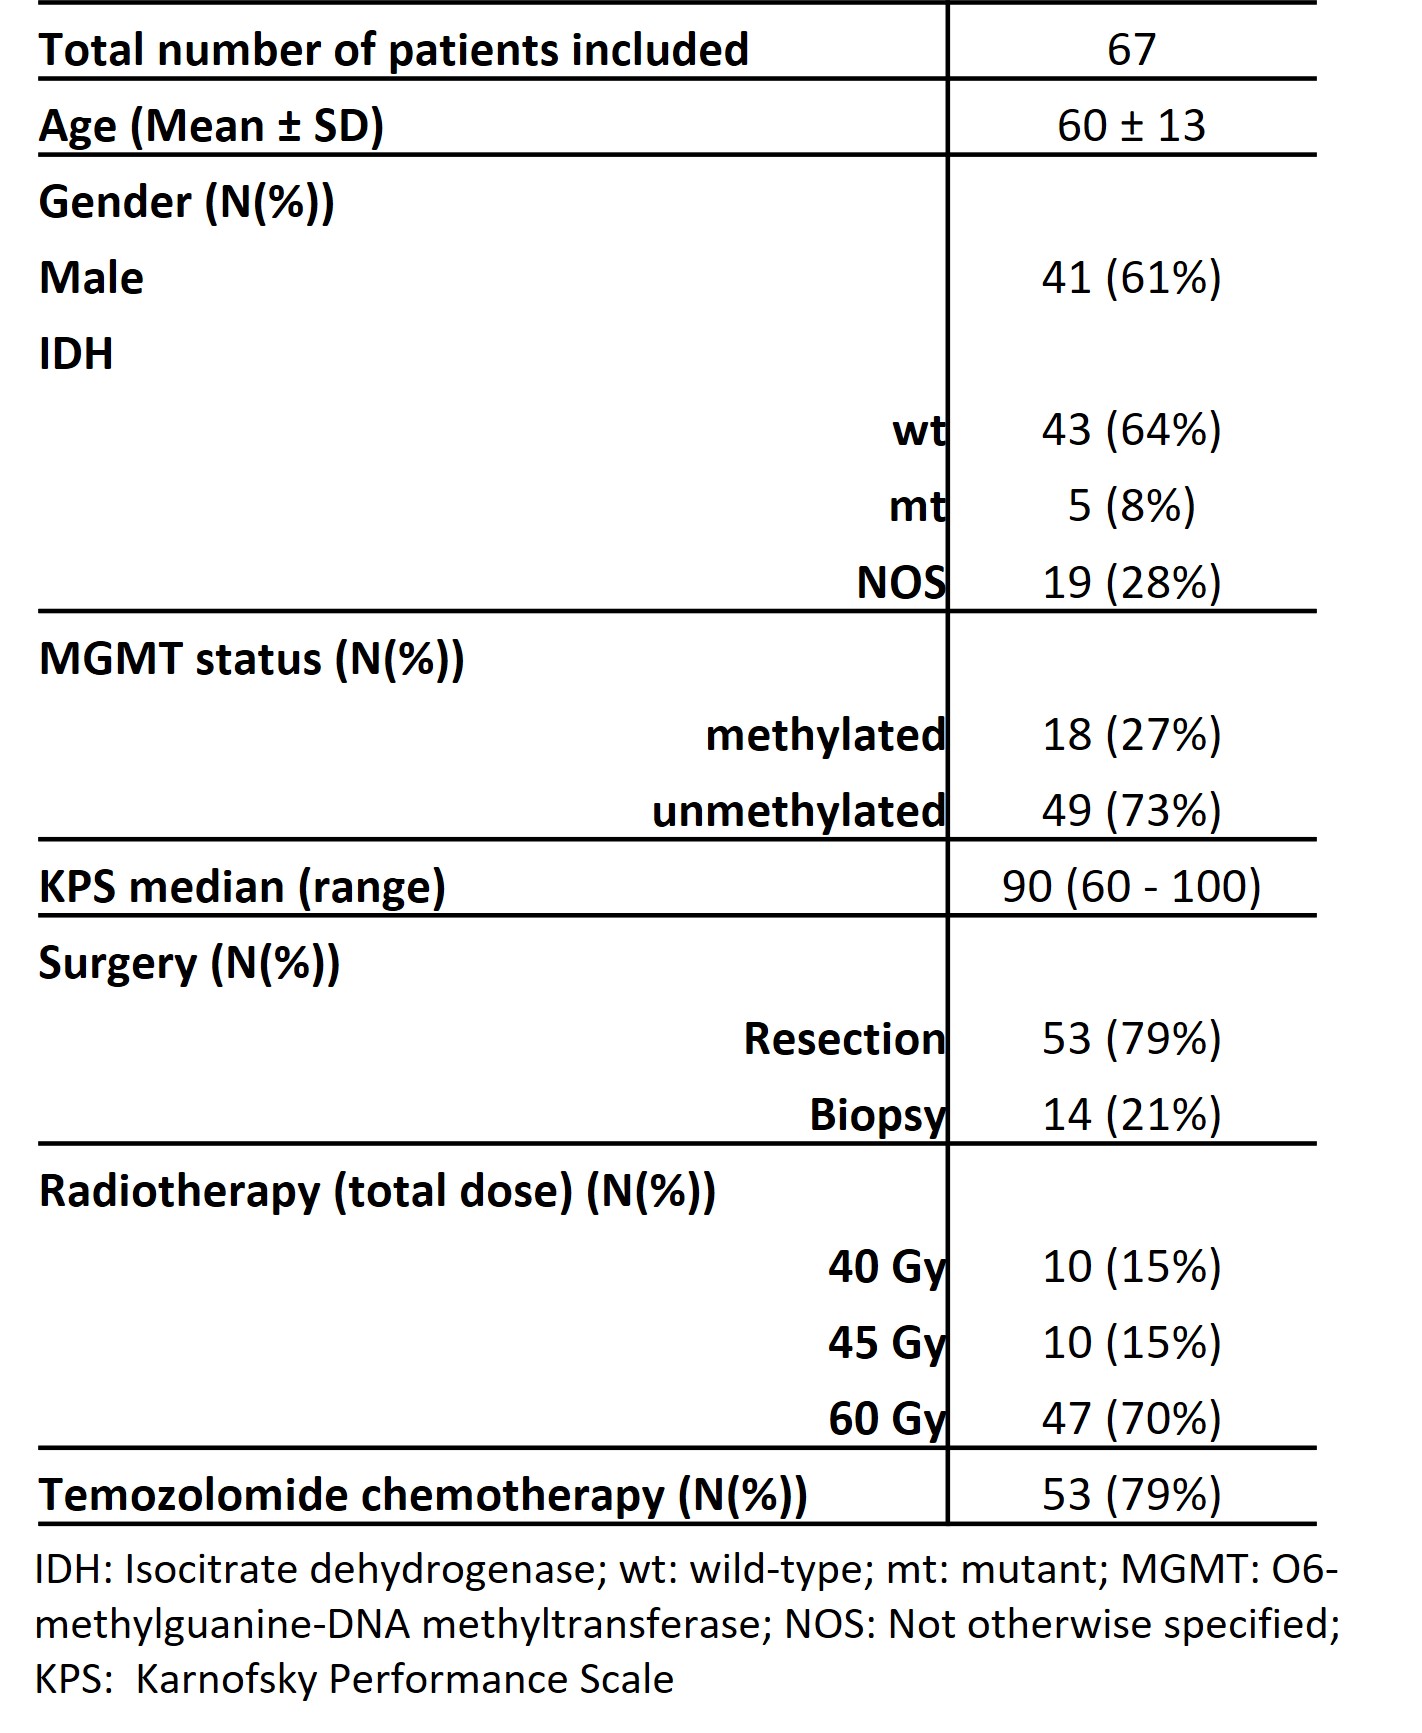
Data collectionPatient MR images and clinical data were retrospectively retrieved following local IRB regulations. In total 67 histologically confirmed glioblastoma patients were included (Table1). ASL, DSC, T2-FLAIR and post-contrast 3D-T1w scans were performed on a 3T-MR scanner (Philips Ingenia) at approximately 3 months post-radiotherapy according to routine clinical image acquisition guidelines.
Cluster Analysis
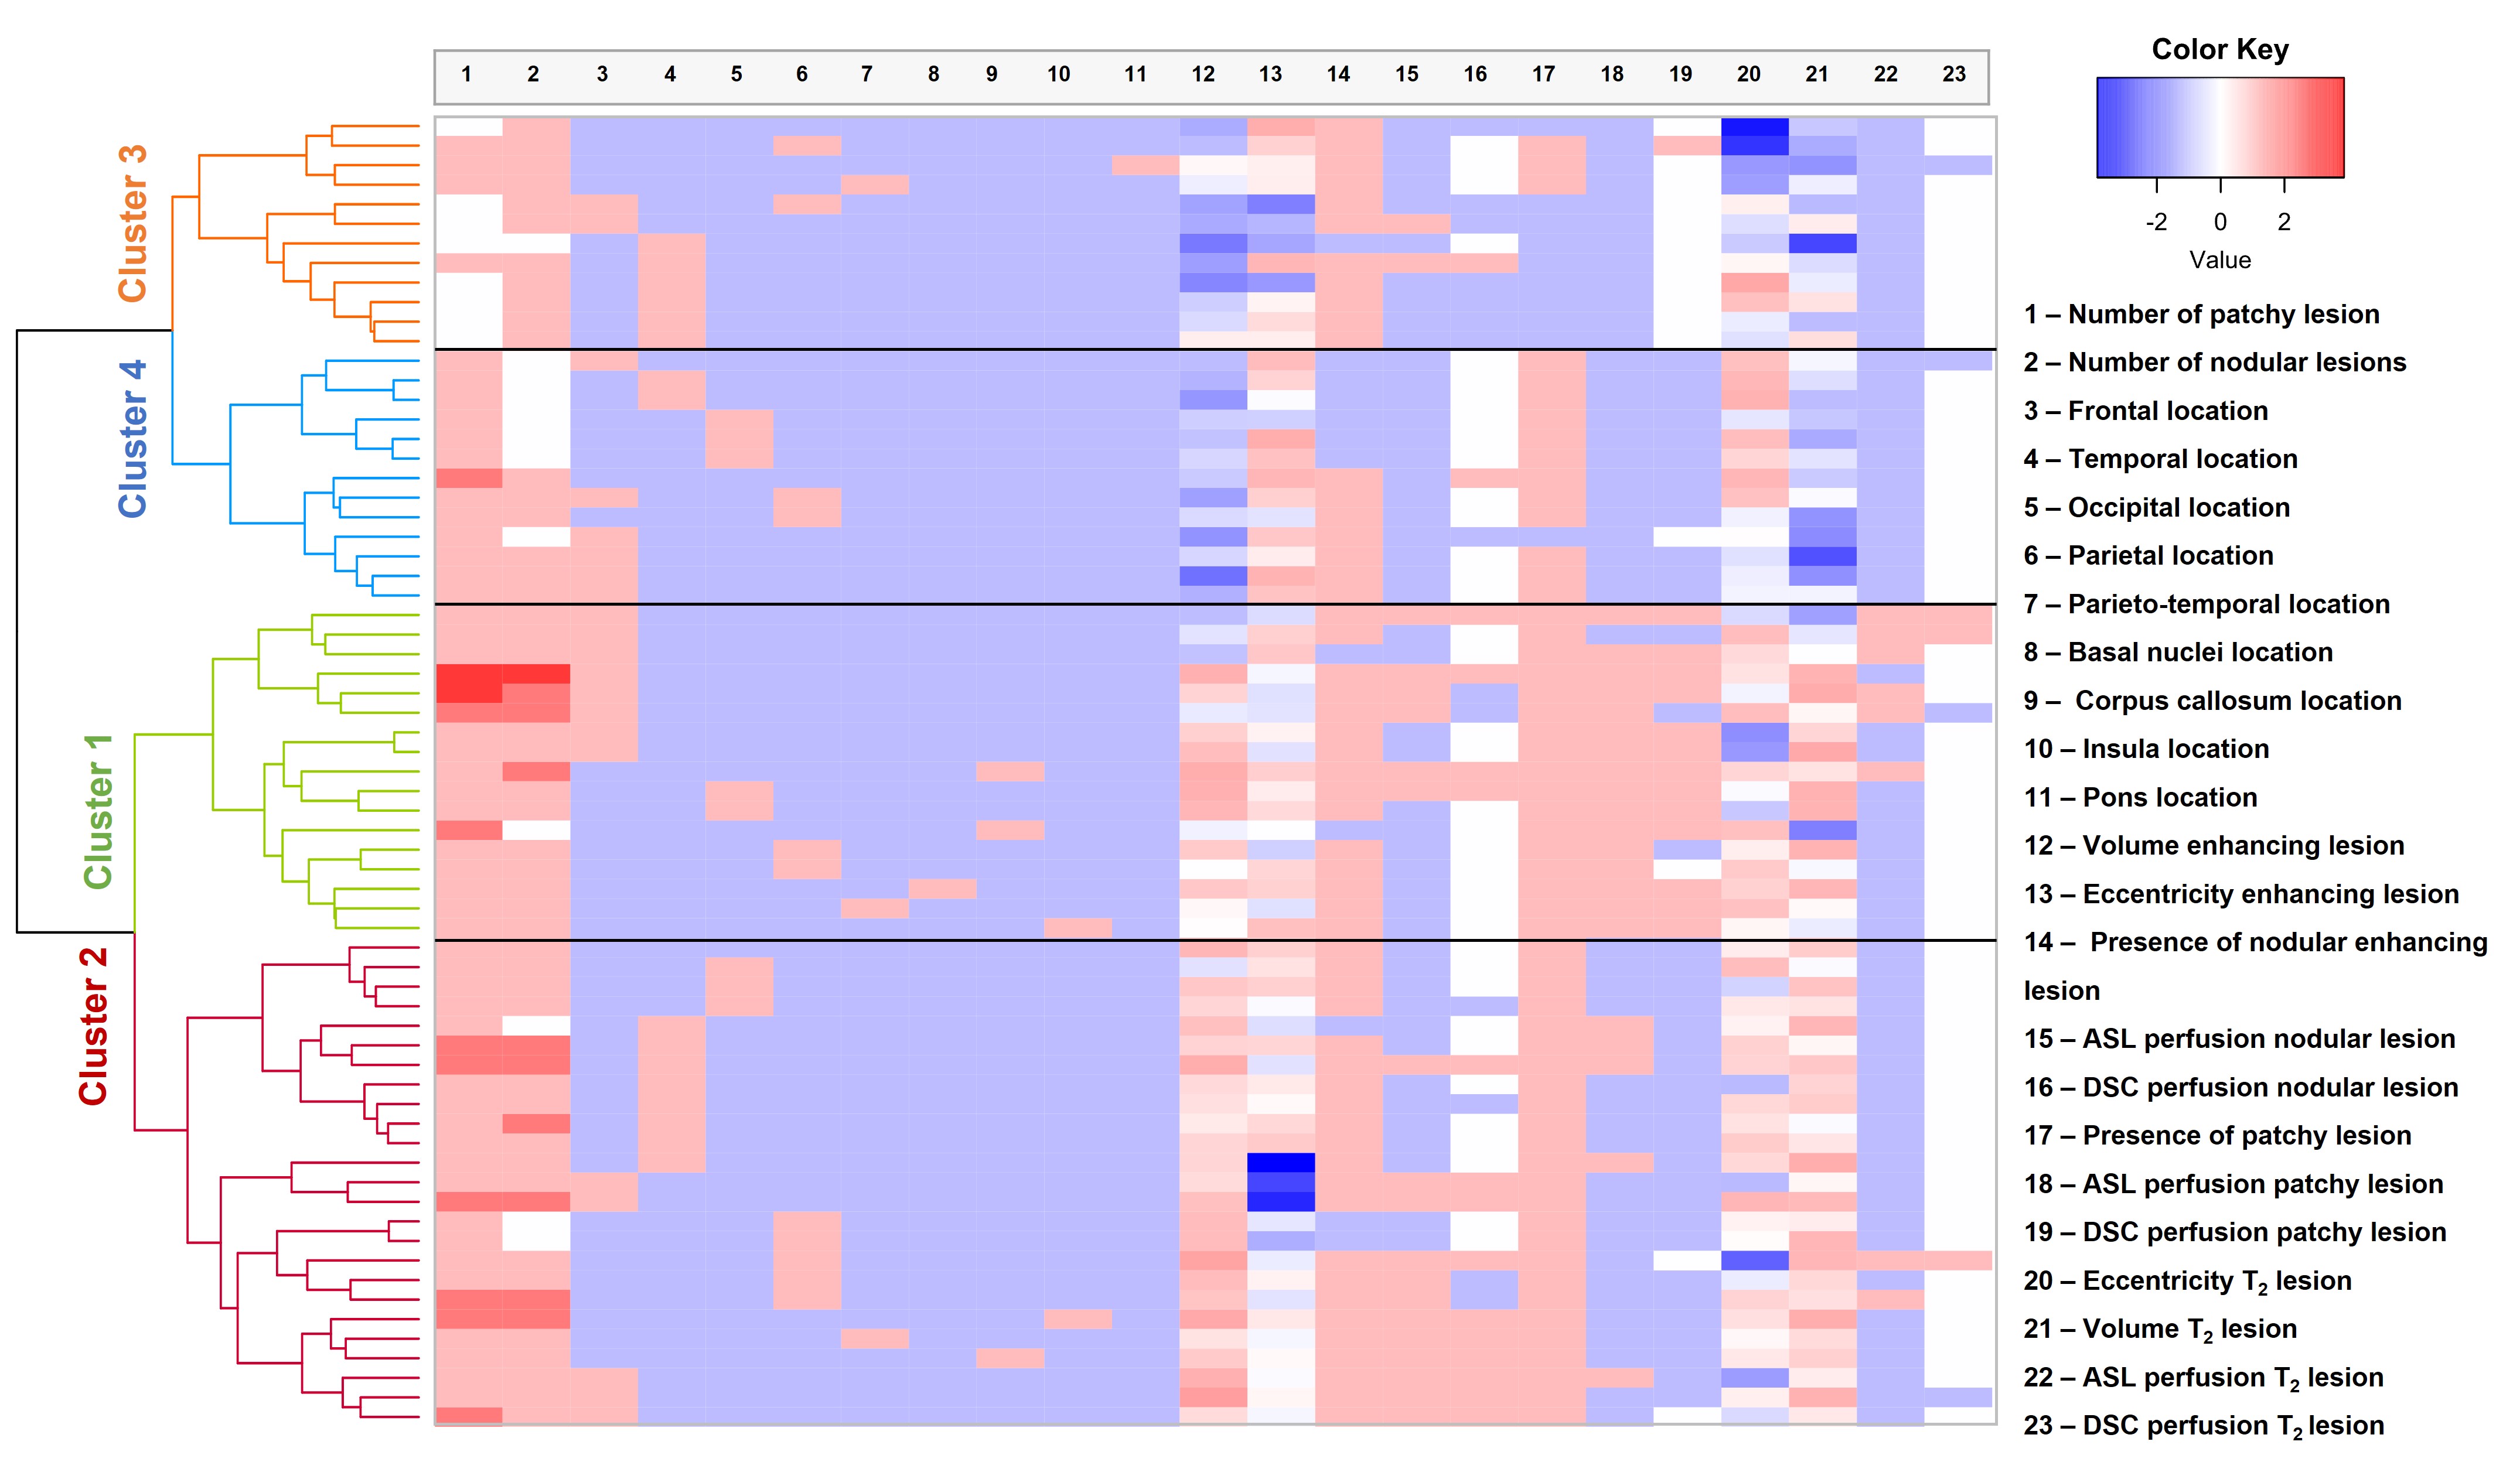
The analysis method consisted of hierarchical clustering, grouping patients based on the similarity between parameters3. Parameters consisted of visual scoring by a neuroradiologist and are listed in figure1. Volume of the enhancing and T2-hyperintense lesions were calculated as a product of the size in three directions of one representative lesion per patient. Eccentricity factor (EF) of the enhancing and T2-hyperintense lesions were calculated with the following formula:$$EF = \sqrt({1-}(\frac{LPD}{MD})^{2}$$ where LPD is the largest perpendicular size and MD is the maximal dimension. DSC perfusion was scored as either increased (hyperperfusion), decreased (hypoperfusion) or no change (isoperfusion). ASL was scored as hyper- or isointense. Continuous parameters including the volume and eccentricity were transformed (multiplied by 100 and log-transformed) and normalized with z-scores. Categorical and binary (ordinal) variables were scaled between -1 and 1.
Hierarchical clustering was computed using the Ward’s method, Nbclust4, factoextra5, cluster6 and dendextend7 in R version 4.1.2 (R Core-Team2021). The number of clusters was determined using the Dunn Index, the average silhouette width, and visually inspecting the heatmap (figure2).
Statistical Analysis
Categorical and binary variables (perfusion and tumor location parameters) were compared between the different subclusters using a chi-square test. Continuous variables were compared using a one-way ANOVA. To assess whether the number of TP cases differed per subcluster, we compared the number of patients with progression, no progression and unknown outcome at 9-months (or the latest available) between subclusters using a chi-square test. Progression status was clinically evaluated at 9-months post-radiotherapy (or the latest timepoint available) and was defined in a multidisciplinary clinical consensus. We calculated the median overall survival time (OS) per cluster using the Kaplan-Meier estimator. Finally we compared OS per subcluster using a Kruskal-Wallis test. The threshold for significance was p≤0.05. All statistical analysis were performed using IBM SPSS version25 (Chicago-IL).
Results
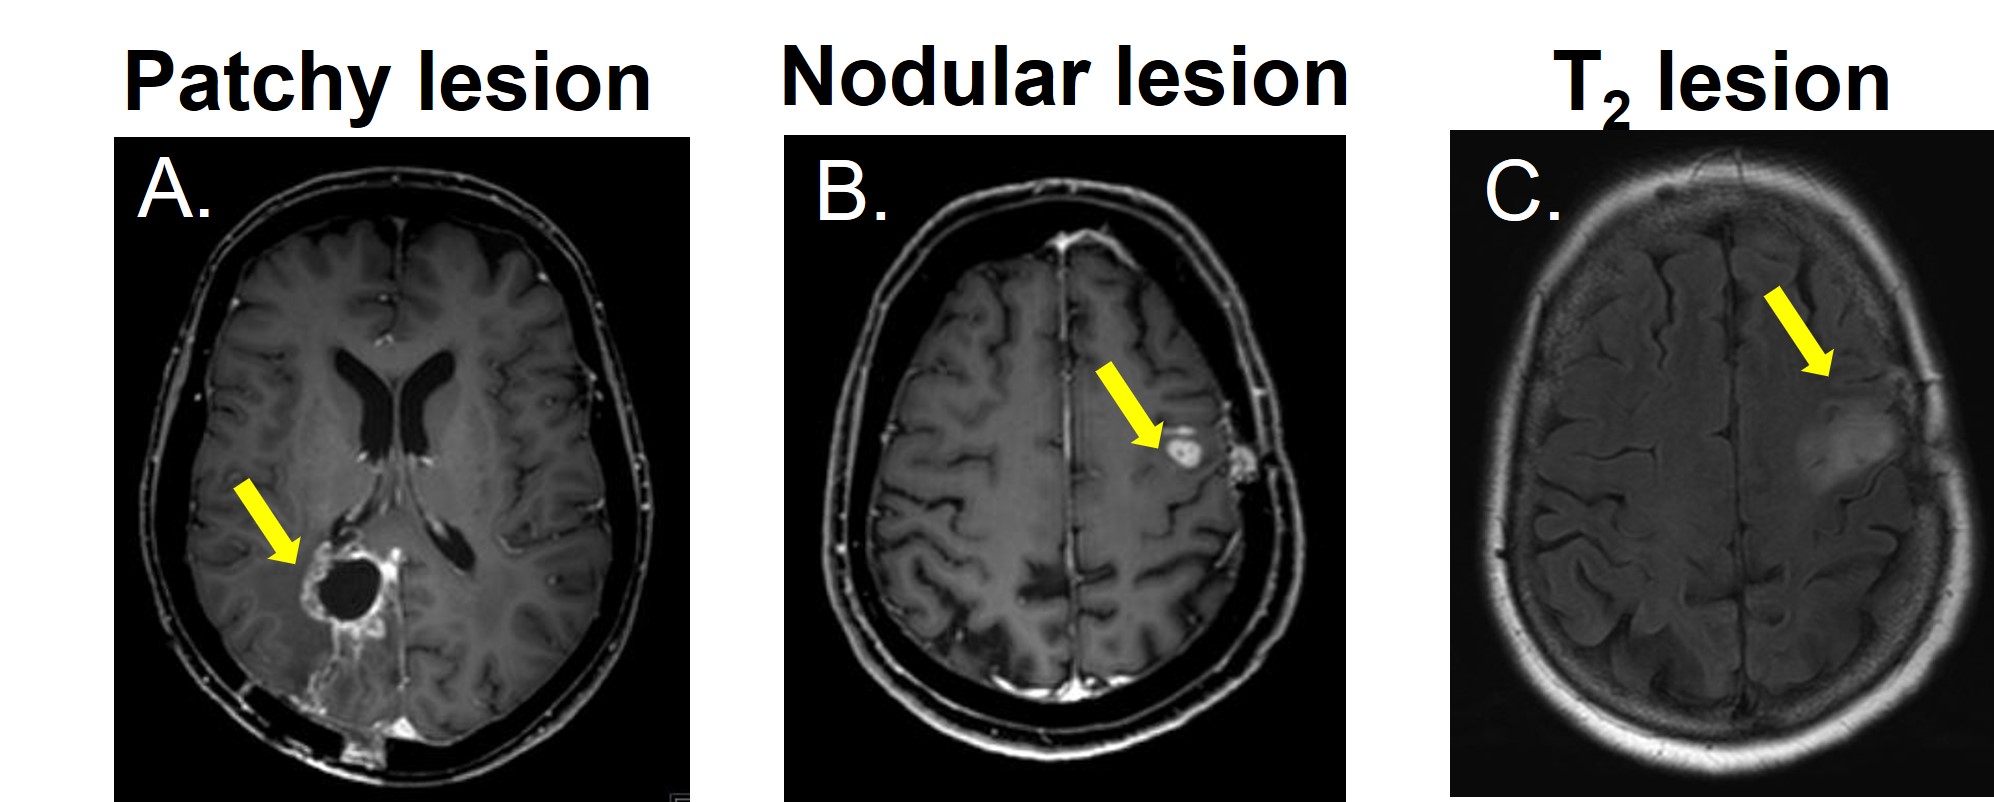
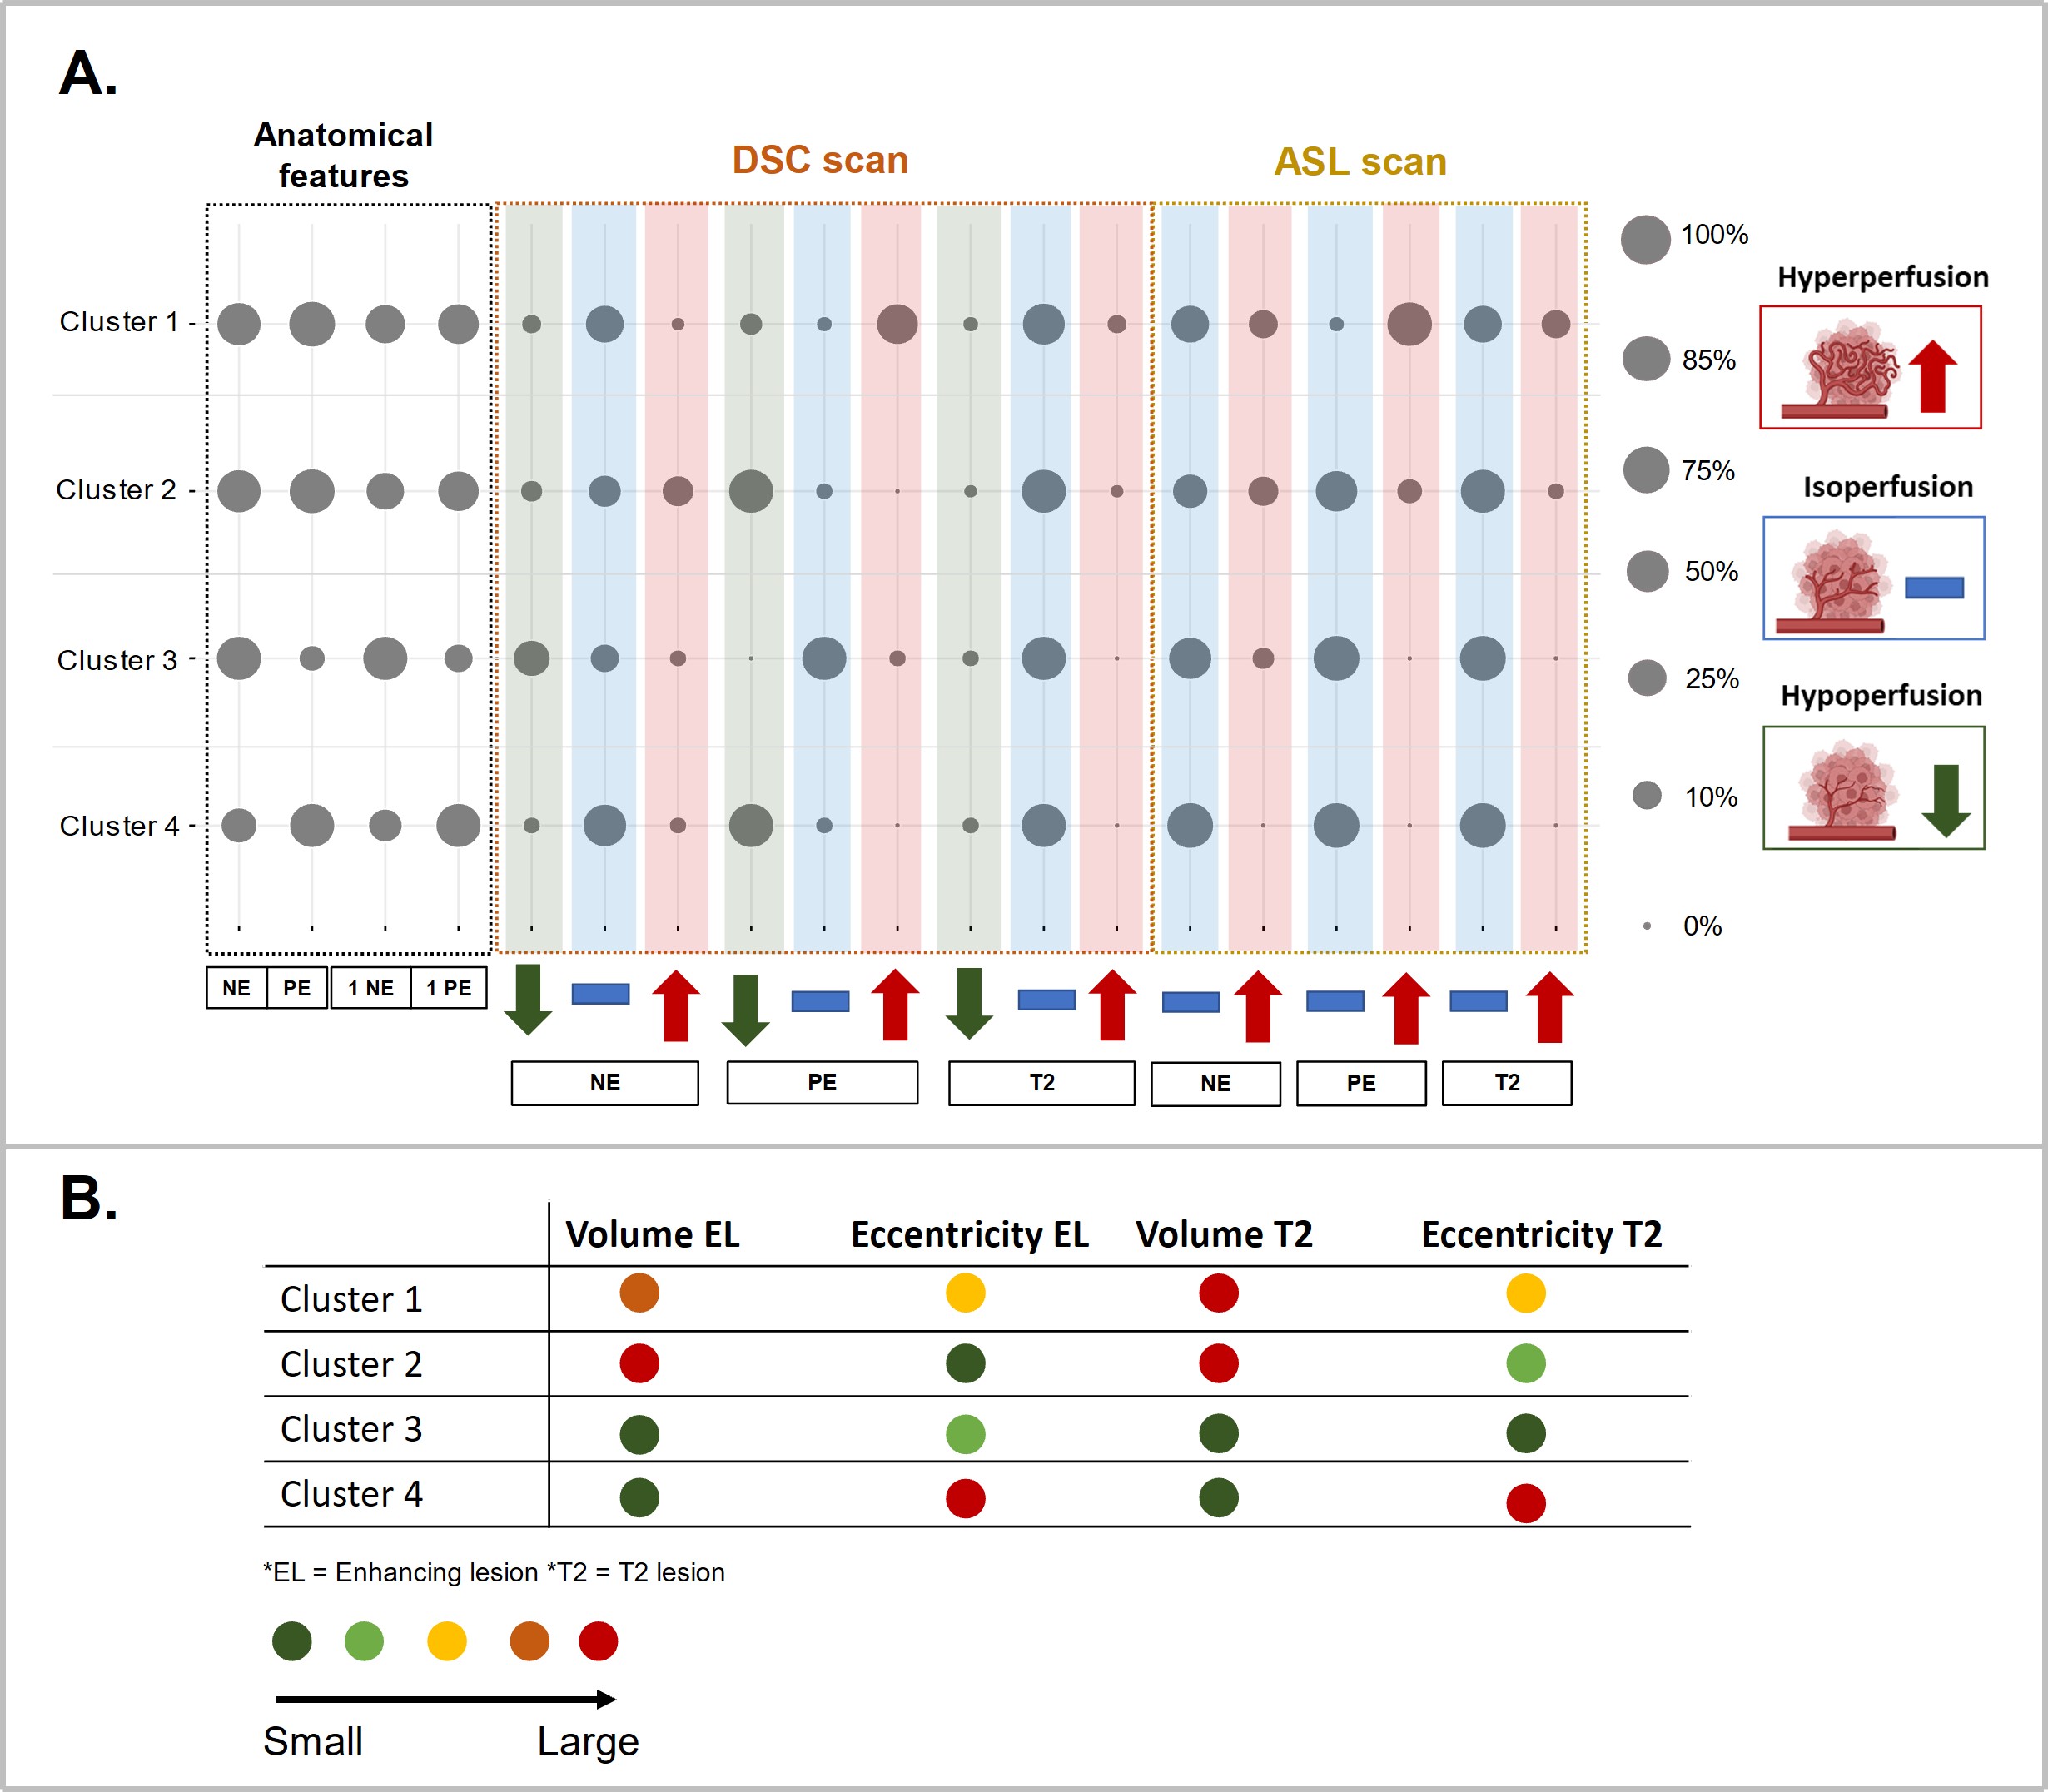
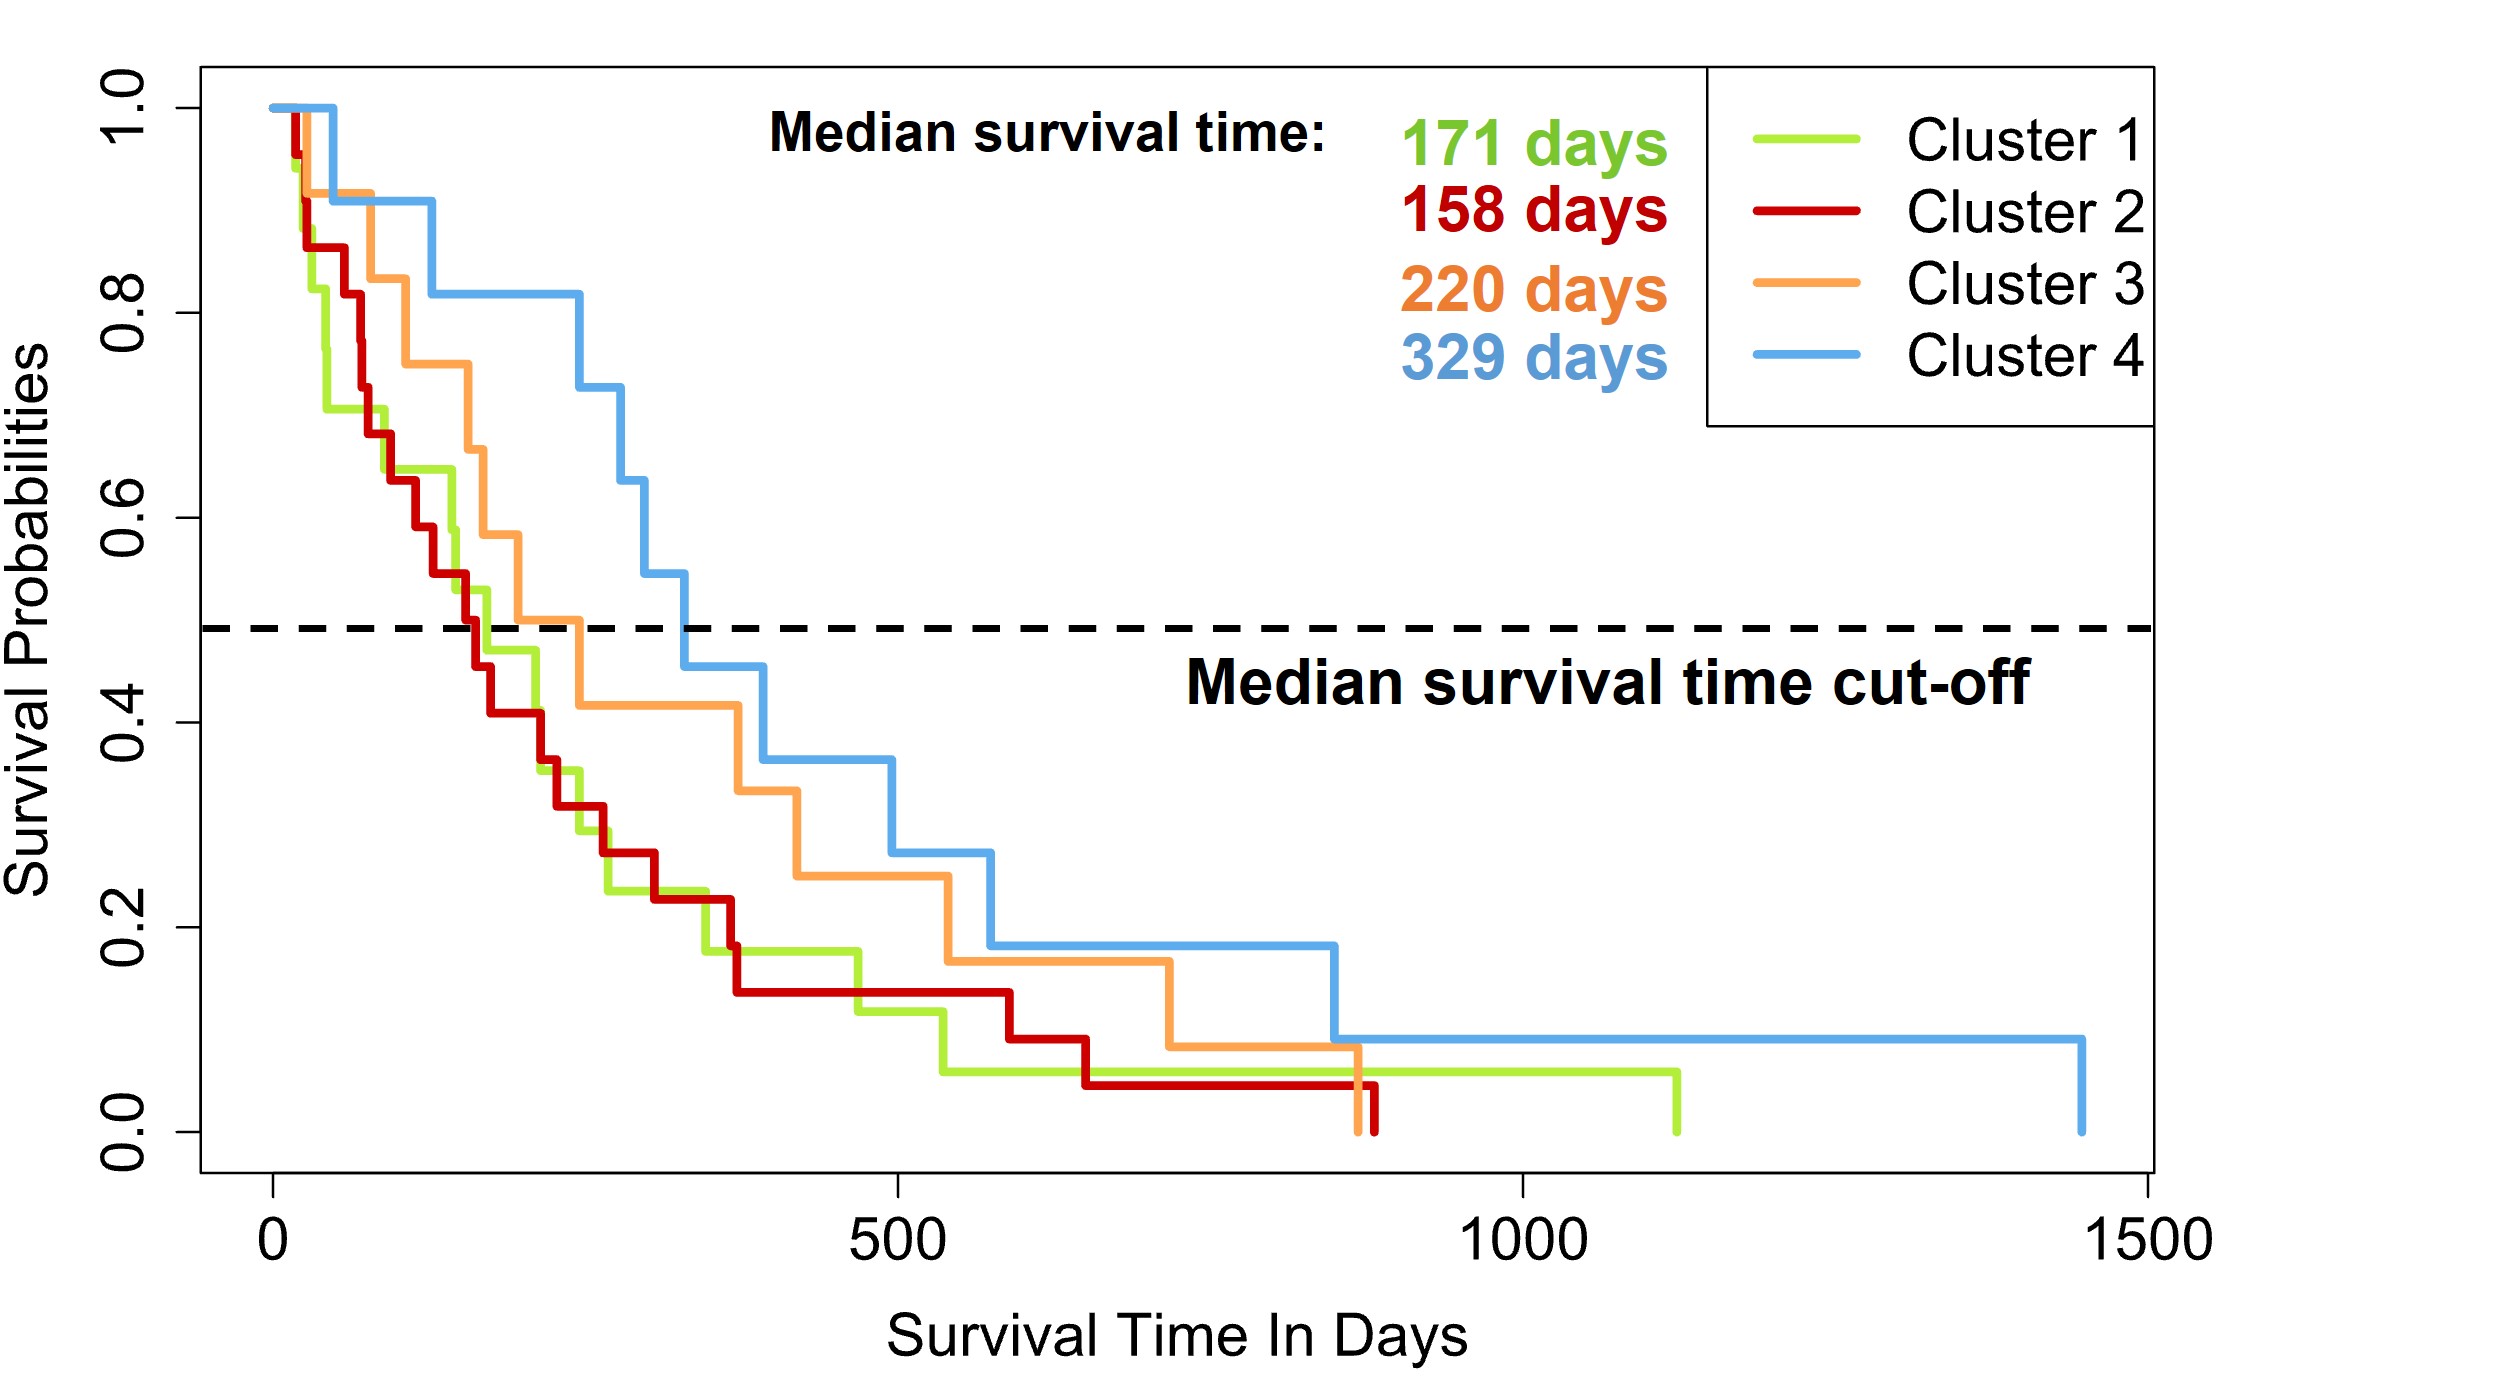
Figure1 shows examples of patchy enhancing lesions (PE), nodular enhancing lesions (NE), and a T2-hyperintense lesion. Figure2 illustrates the output of the clustering analysis as a heatmap where patients and subsequently clusters of patients are grouped based on similar tumor characteristics. Most markers differed significantly per cluster (p≤0.05). Few exceptions included the tumor location parameters (except the temporal region), the presence of NE, the DSC perfusion in T2-hyperintense lesions and the eccentricity of enhancing and T2-hyperintense lesions (p>0.05). We then chose the markers that most clearly differentiated the 4 clusters to provide a summary illustration (figure3). For example, cluster 1 and 2 have similar incidence of PE and NE. Interestingly cluster 1 has predominantly hyperperfused PE whereas cluster 2 has mostly NE hyperperfused lesions. Clusters 3 and 4 have mostly only NE and PE respectively, as well as smaller tumor volumes and mostly isoperfused tumor lesions . Figure4 shows that the OS is different for each cluster and had a substantial effect size especially between cluster 2 with the lowest OS (158days±5months) and cluster 4 with the largest OS (329days±11months). However, there was no significant between-group difference in OS and tumor progression rates at 9 months (p>0.05).Discussion and conclusion
We defined 4 distinct glioblastoma clusters based on radiological tumor characteristics from MRI scans 3 months post-radiotherapy, representing distinct MRI glioblastoma phenotypes. Between these 4 clusters we observed that the OS differed (ranging from 5 to 11 months). Identifying tumor MRI phenotypes and relating it to patient outcome may allow to better understand which MRI markers may be indicative of poor survival outcome. In this way it suggests that different biological properties might underly different enhancement patterns and affect patient survival8. Future studies may need to include a larger group of patients to reliably achieve statistical power, and also explore the relationship between MRI phenotypes and underlying physiology to find a causal relationship explaining the differences in overall survival. In conclusion, our study suggests that differences in MRI phenotypes of glioblastomas at 3 months post-radiotherapy may be indicative of overall patient survival.Acknowledgements
No acknowledgement found.References
1. Sheikh S, Radivoyevitch T, Barnholtz-Sloan JS, Vogelbaum M. Long-term trends in glioblastoma survival: Implications for historical control groups in clinical trials. Neuro-Oncology Pract. 2020;7(2):158-163. doi:10.1093/nop/npz046
2. Manning P, Daghighi S, Rajaratnam MK, et al. Differentiation of progressive disease from pseudoprogression using 3D PCASL and DSC perfusion MRI in patients with glioblastoma. J Neurooncol. 2020;147(3):681-690. doi:10.1007/s11060-020-03475-y
3. Jaarsma-Coes MG, Ghaznawi R, Hendrikse J, et al. MRI phenotypes of the brain are related to future stroke and mortality in patients with manifest arterial disease: The SMART-MR study. J Cereb Blood Flow Metab. 2020;40(2):354-364. doi:10.1177/0271678X18818918
4. Charrad M, Ghazzali N, Boiteau V et al. NbClust: An R Package for Determining the Relevant Number of Clusters in a Data Set. Journal of Statistical Software. 2014;61(6),1-36.
5. Kassambara A. FactoExtra: Extract and Visualize the Results of Multivari- ate Data Analyses for R, version 1.0.7. 2020.
6. M. Maechler, Rousseeuw P, Struyf A et al. Package “cluster”: R package version 2.1.2. 2021.
7. Galili T. dendextend: an R package for visualizing, adjusting and comparing trees of hierarchical clustering. Bioinformatics. 2015 Nov 15;31(22):3718-20.
8. Wang YY, Wang K, Li SW, et al. Patterns of tumor contrast enhancement predict the prognosis of anaplastic gliomas with IDH1 mutation. Am J Neuroradiol. 2015;36(11):2023-2029. doi:10.3174/ajnr.A4407
Figures