3224
Effects of radiotherapy on tissue in patients with brain metastases in terms of OEF and CMRO21Imaging Division, UMC Utrecht, Utrecht, Netherlands, 2SUNY Buffalo, Buffalo, NY, United States, 3Brain Department, Radiotherapy, UMC Utrecht, Utrecht, Netherlands, 4Radiology Department, UMC Utrecht, Utrecht, Netherlands
Synopsis
Keywords: Tumors, Metabolism
Radiotherapy might have an influence on the ratio of deoxygenated versus oxygenated blood in the venous blood vessels (OEF) in the brain. The relationship between delivered dose and the OEF may be a more direct measure of tissue damage or recovery. Preliminary results suggest that there is a marginal significant increase in OEF values after radiotherapy. This indicates that OEF can be of valuable use in determining the effects of radiotherapy. Additionally, CMRO2 maps show an identical increase or decrease in cerebral metabolic activity.
Keywords: Oxygen extraction fraction Cerebral metabolic rate of oxygen extraction Radiotherapy Brain tumor
Introduction
Oxygen extraction fraction (OEF) is a measure indicating oxygen uptake by the tissues and is calculated as the ratio between oxygenated and deoxygenated red blood cells in venous blood. OEF is influenced by the balance of cerebral blood flow and cerebral metabolic rate of oxygen extraction (CMRO2). CMRO2, and thereby OEF, may change after radiotherapy due to damage and/or necrosis (reduction in OEF), or the recovery from damage (potentially elevated OEF). The change in the amount of oxygen that is consumed by the brain may indicate tissue damage after radiotherapy. Unfortunately, Aside from tumor tissue, a substantial amount of healthy tissue can also be exposed to high doses during radiotherapy. A direct measure of OEF may offer new insights into the relationship between delivered dose and tissue damage in both disease affected, or healthy appearing tissue. Therefore, the aim of this study was to compare direct measures OEF calculated using a susceptibility based approach in a set of patients with brain metastases before and after radiotherapy treatment.Methods
A subset of ten patients was included from the ongoing study Assessing and Predicting Radiation Influence on Cognitive Outcome using the cerebrovascular stress Test (APRICOT). These patients completed both the pre- and post-radiotherapy MRI on a Philips 3T MRI system using a 32 channel Nova receive coil. Along with structural images, the scan protocol also included resting susceptibility weighted imaging (SWI) and baseline perfusion imaging (PCASL). SWI images were made with the following imaging parameters: flip angle=17 degrees, number of slices=63 , voxel size=0.342x0.342x2mm, TR=50 ms, scan resolution=384x383, nr echos=5, TE1=8.5ms, TE5=44.5ms, echo spacing=8ms , FOV=230x126x189mm, waterfatshift=3 pixels. Total scan duration=393 seconds. Raw phase and magnitude data provided QSM maps calculated using the Sepia toolbox1. QSM data were then used to generate OEF maps using the QQ-CCTV method of Cho et al2,3The mean OEF values were then evaluated on regions of interest based on the gross tumor volume (GTV) before radiotherapy. Therefore, the tumor masks which were annotated in pre-radiotherapy CT scans, were registered to the SWI data via an anatomical T1w scan.
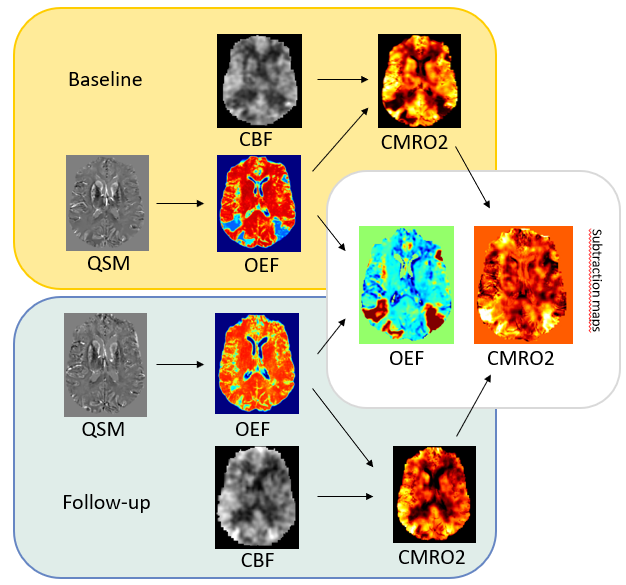
A complete set of OEF maps for both pre and post radiotherapy were obtained for 8 patients. In two patients, CMRO2 maps were calculated by multiplying OEF with CBF values calculated from a multi-PLD PCASL sequence. Since not all CMRO2 data was processed, it was only used for visual inspection and to contextualize OEF results. An overview of the MR data used and computed can be found in Figure 1.
Results
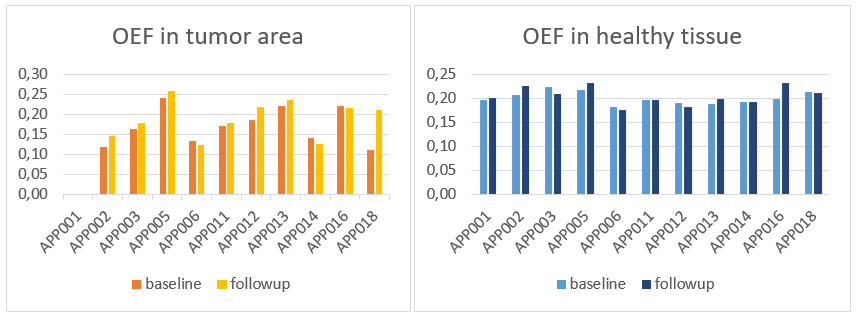
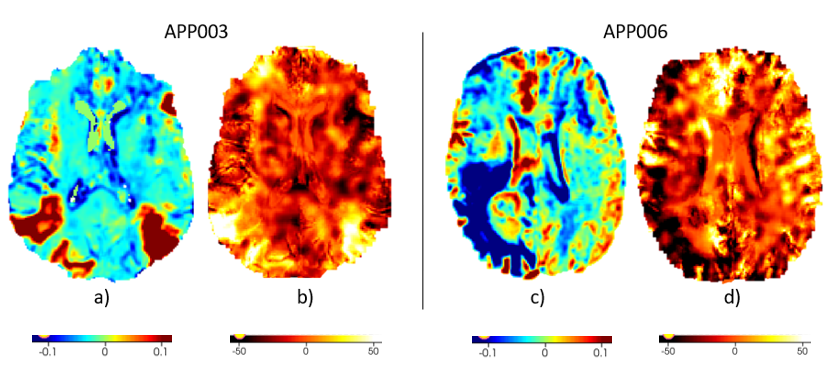
A paired sample t-test was performed to compare the OEF in the gross tumor volume in baseline and followup (Figure 2). There was a nonsignificant lower OEF at baseline (M=0.17, SD=0.05) and followup (M=0.19, SD=0.05) t(9)=2.11, p=0.06. An additional comparison was made between the OEF in the healthy tissue area in baseline and followup (whole brain minus the planned tumor volume). There was a nonsignificant difference found between baseline (M=0.20, SD=0.01) and followup (M=0.20, SD=0.02) t(10)=1.07, p=0.31. Next to that, OEF and CMRO2 subtraction maps were made by subtracting the pre radiotherapy data from the post radiotherapy data to visualize the change in OEF or CMRO2 in the particular brain areas (Figure 3) Preliminary CMRO2 maps showed different patient reactions to the radiotherapy. In most patients, the OEF of the tumor increased, while in others, the OEF decreased. The increase or decrease in cerebral metabolic activity corresponds to an increase or decrease, respectively, in oxygen extraction fraction (Figure 3)Discussion and Conclusion
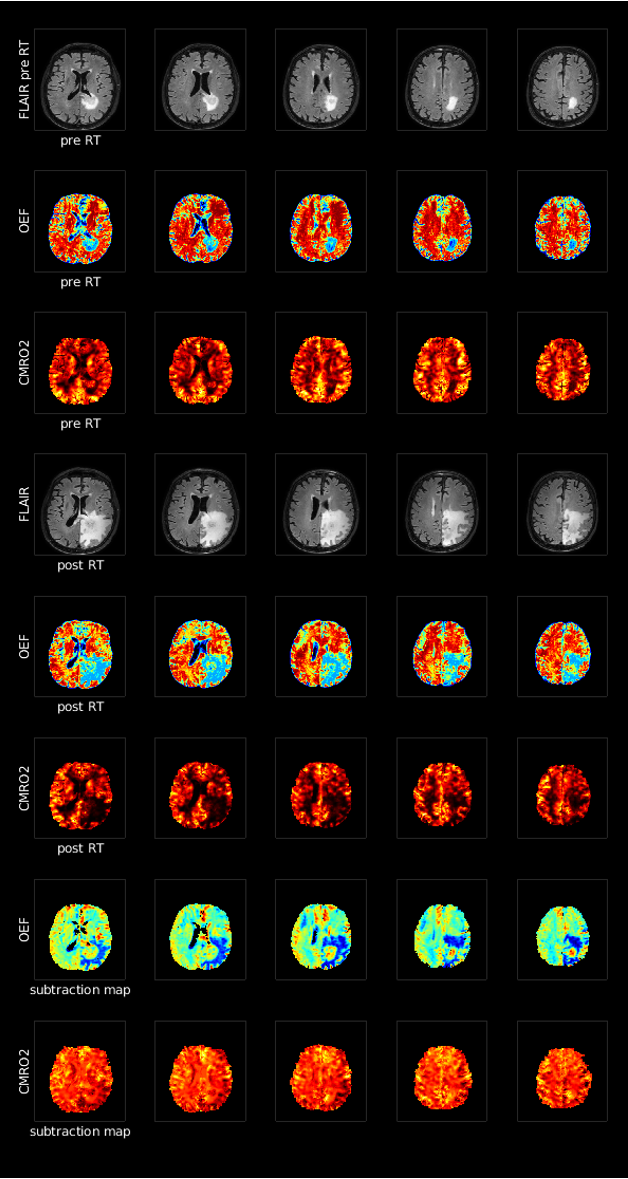
The preliminary results suggest that there is no significant difference in OEF values in healthy tissue. However, since the volume of interest is very large for this comparison, future research might further subdivide the healthy tissue in regions according to the delivered dose to further elucidate any dose-specific OEF effects. Next to that, there was a nonsignificant relationship in the OEF values in the tumor region. However, the means of the baseline (M=0.17) and followup (M=0.19) tumor area are different and show an increasing relationship. This nonsignificance may be due to the small sample (N=10) and the implementation of the tumor mask, which is only drawn for the baseline scans. After radiotherapy, the tumor volume may have decreased and may have been replaced by healthy tissue. Therefore, readings of OEF values in followup should be investigated further in terms of tumor area. Additionally, a global effect of OEF is visible when the tumor tissue reacts badly to the radiotherapy and develops edema. The patient in figure 4 is a clear example of this tissue reaction and shows a negative effect on OEF values and CMRO2 values in the healthy tissue. Further research may also account for changes in edema to account for its adverse effect on OEF. At last, we will also investigate the effect of treatment on CMRO2 as well as the relationship with cognition.Acknowledgements
No acknowledgement found.References
1. Chan, K.-S., & Marques, J. P. (2021). Sepia—susceptibility mapping pipeline tool for phase images. NeuroImage, 227, 117611. https://doi.org/10.1016/j.neuroimage.2020.117611
2. Cho J, Spincemaille P, Nguyen TD, Gupta A, Wang Y. Temporal clustering, tissue composition, and total variation for mapping oxygen extraction fraction using QSM and quantitative BOLD. Magn Reson Med. 2021 Nov;86(5):2635-2646. doi: 10.1002/mrm.28875. Epub 2021 Jun 10. PMID: 34110656.
3. Zhang, S., Cho, J., Nguyen, T. D., Spincemaille, P., Gupta, A., Zhu, W., & Wang, Y. (1AD, January 1). Initial experience of challenge-free MRI-based oxygen extraction fraction mapping of ischemic stroke at various stages: Comparison with perfusion and diffusion mapping. Frontiers. Retrieved November 4, 2022, from https://www.frontiersin.org/articles/10.3389/fnins.2020.535441/full
Figures